KKR & Co. Inc.'s management explains the business in its own materials. The slides below do the most of that work, pulled from the documents preserved in Sources. Each source link opens the complete presentation at that slide in a new tab.
KKR's current standing overview deck: what the firm owns, how the three segments earn, and where management says growth comes from. · Open the full document →
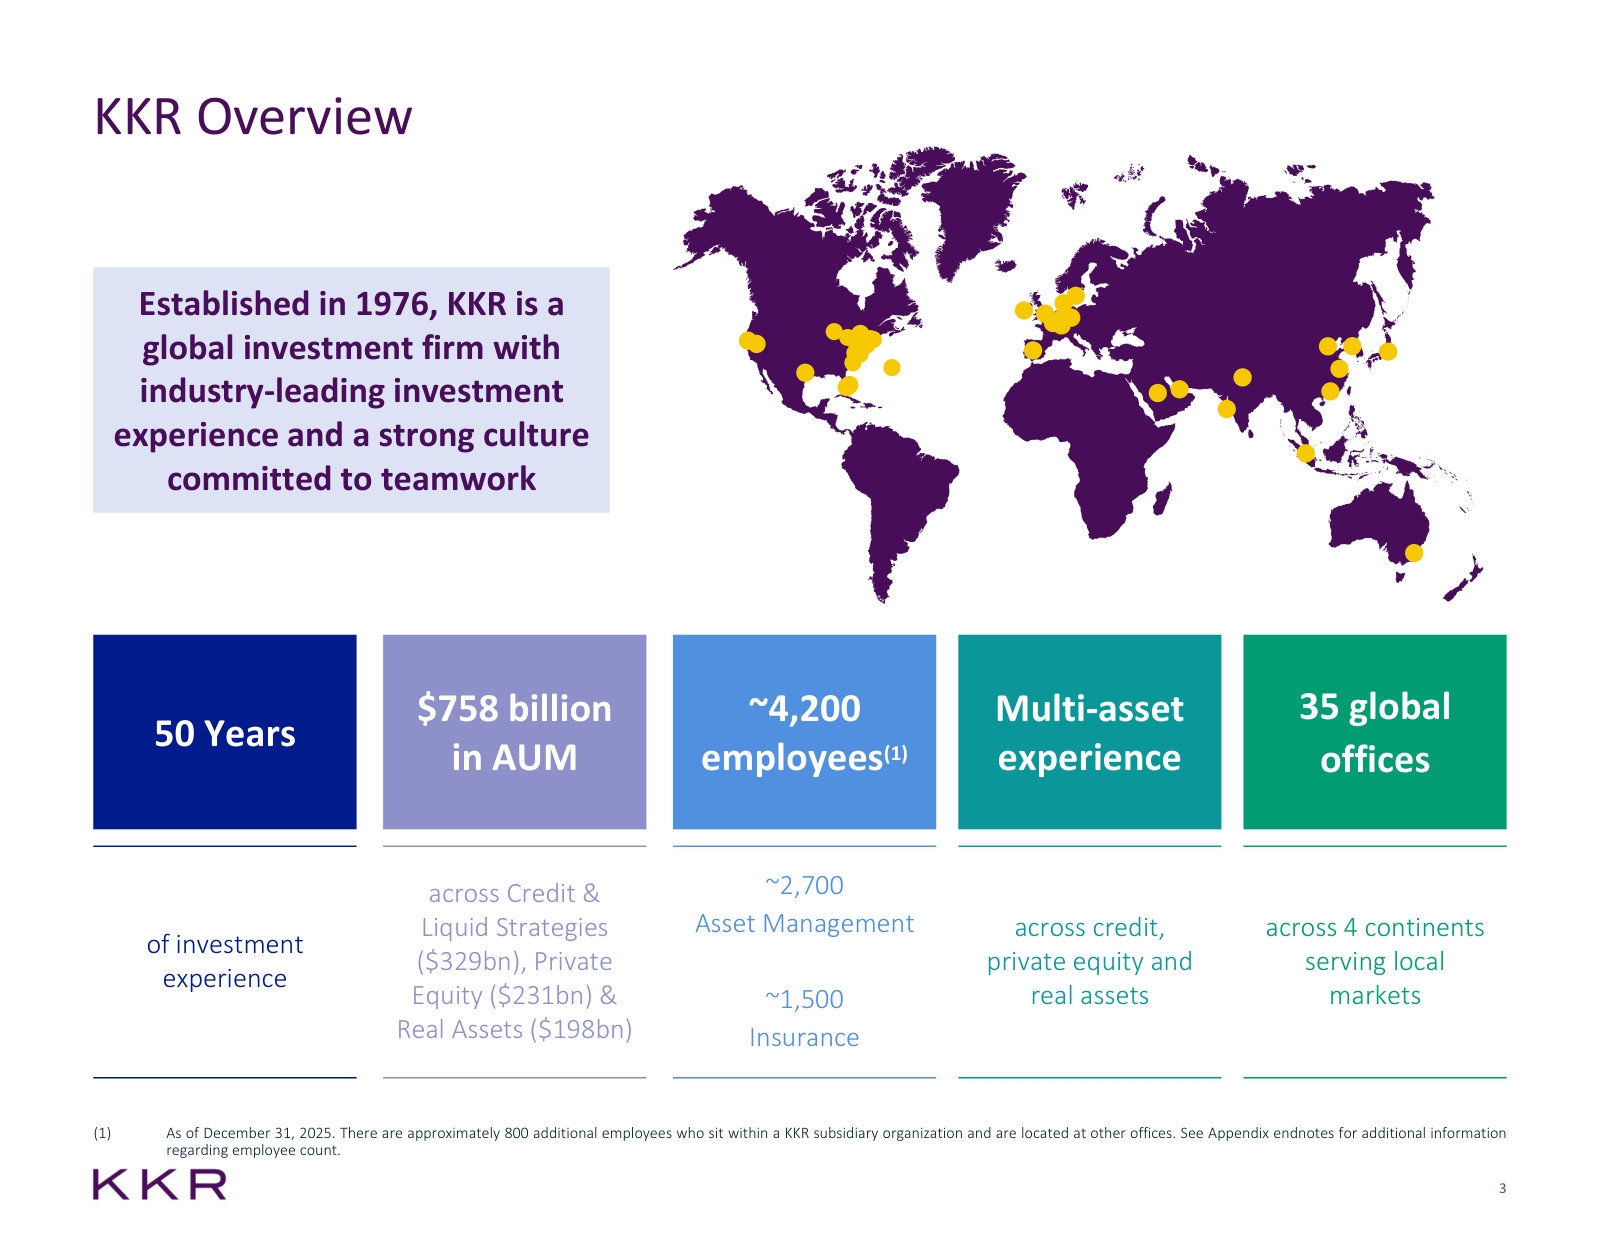
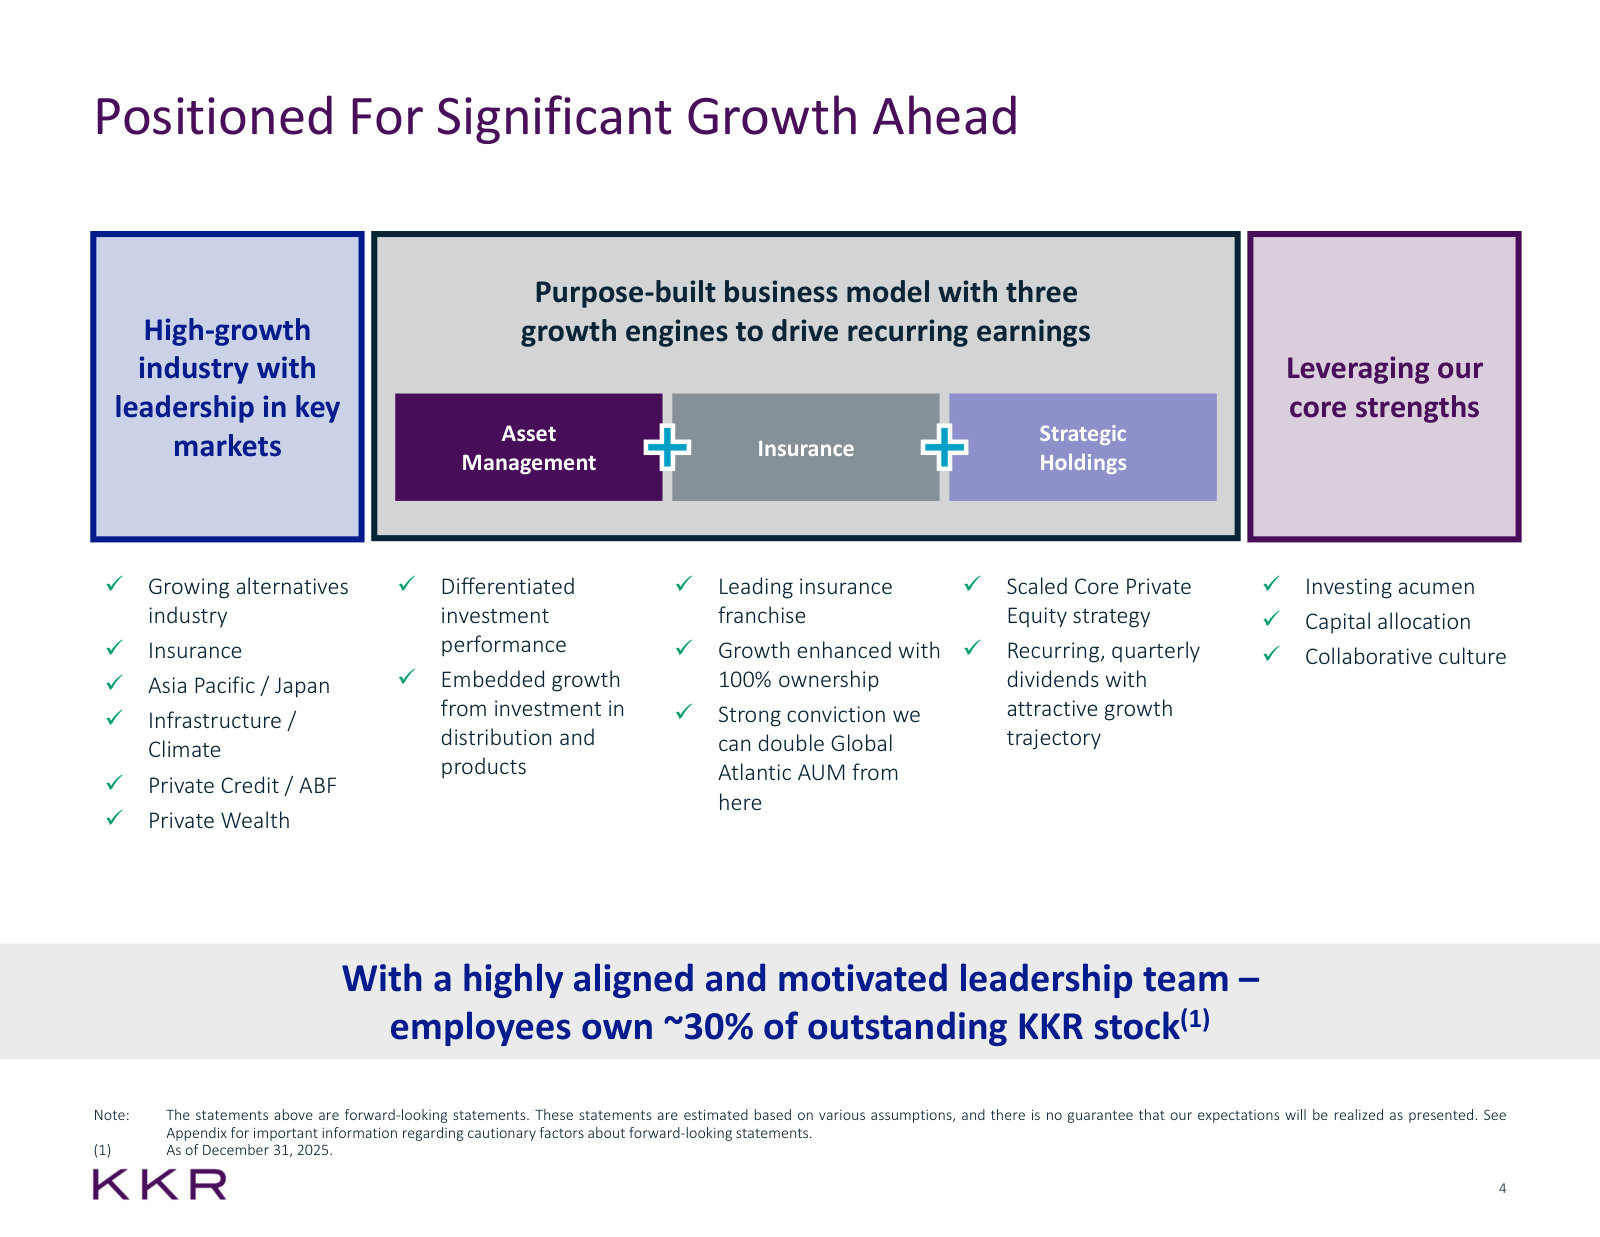
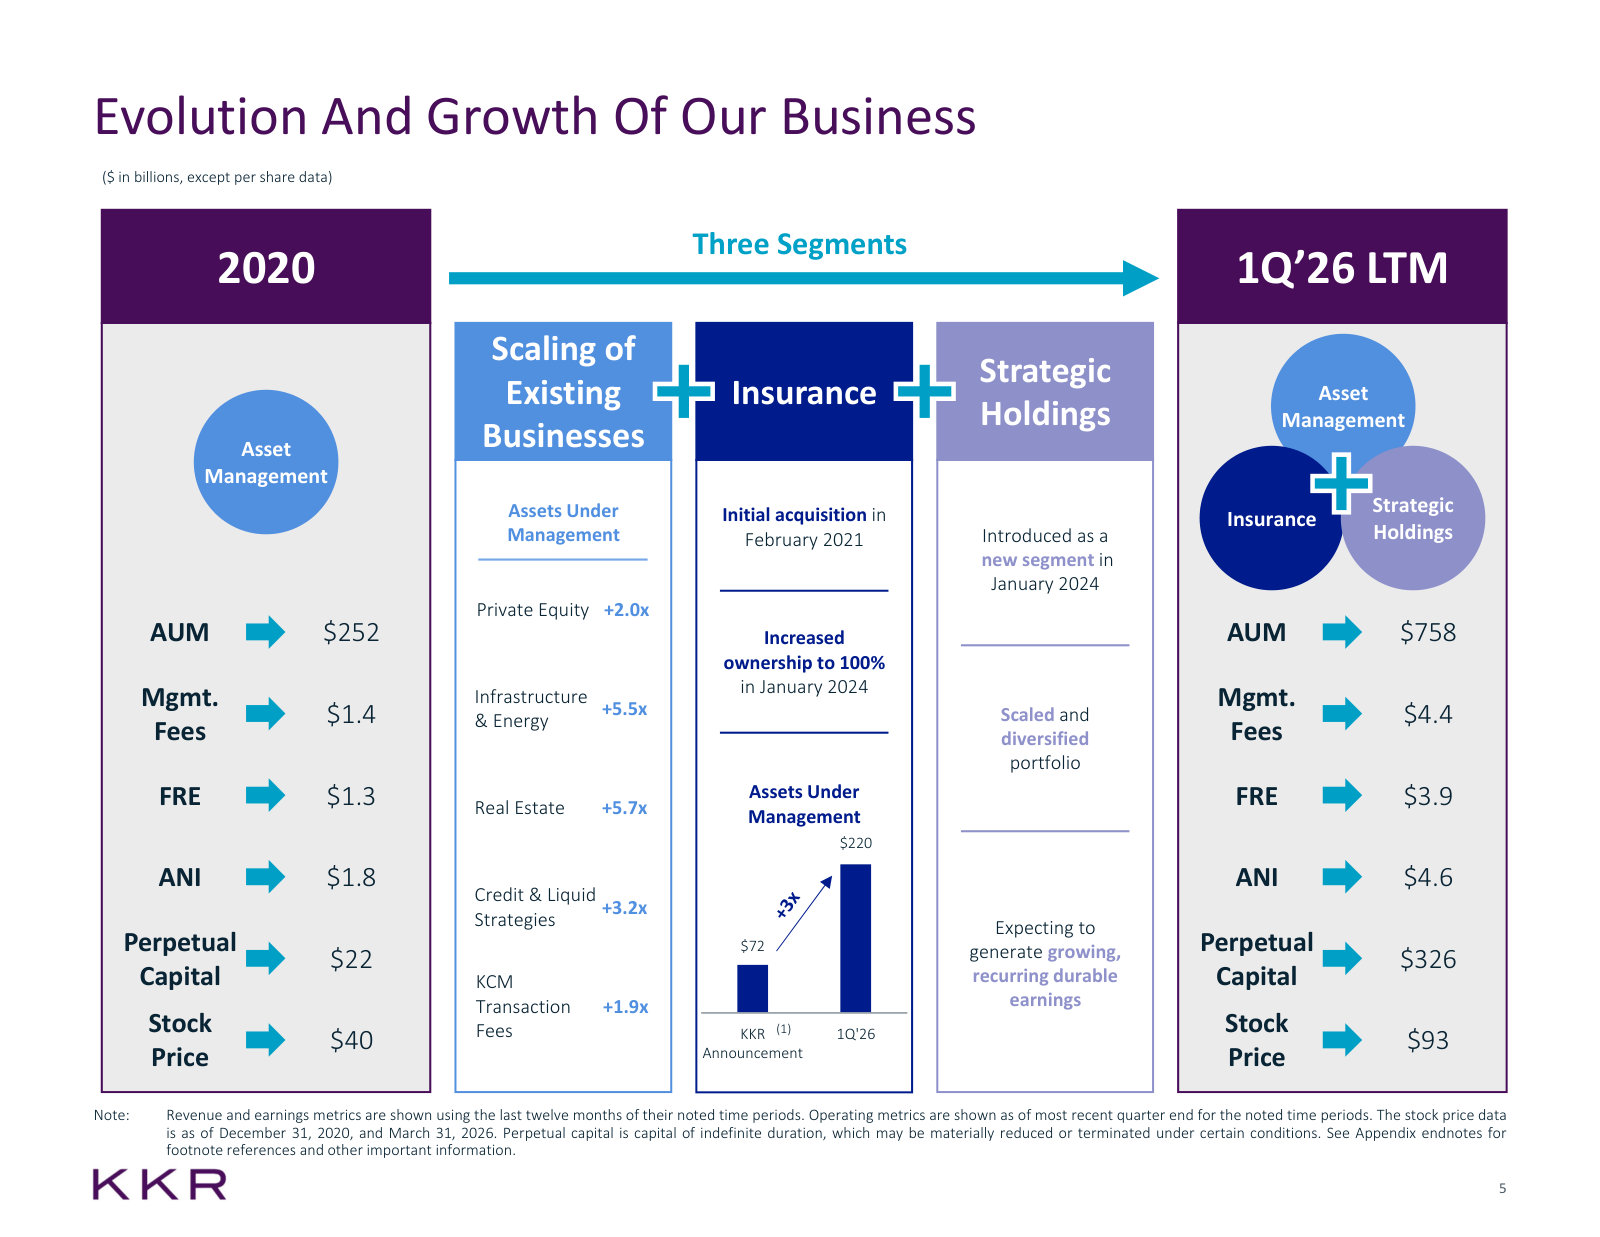
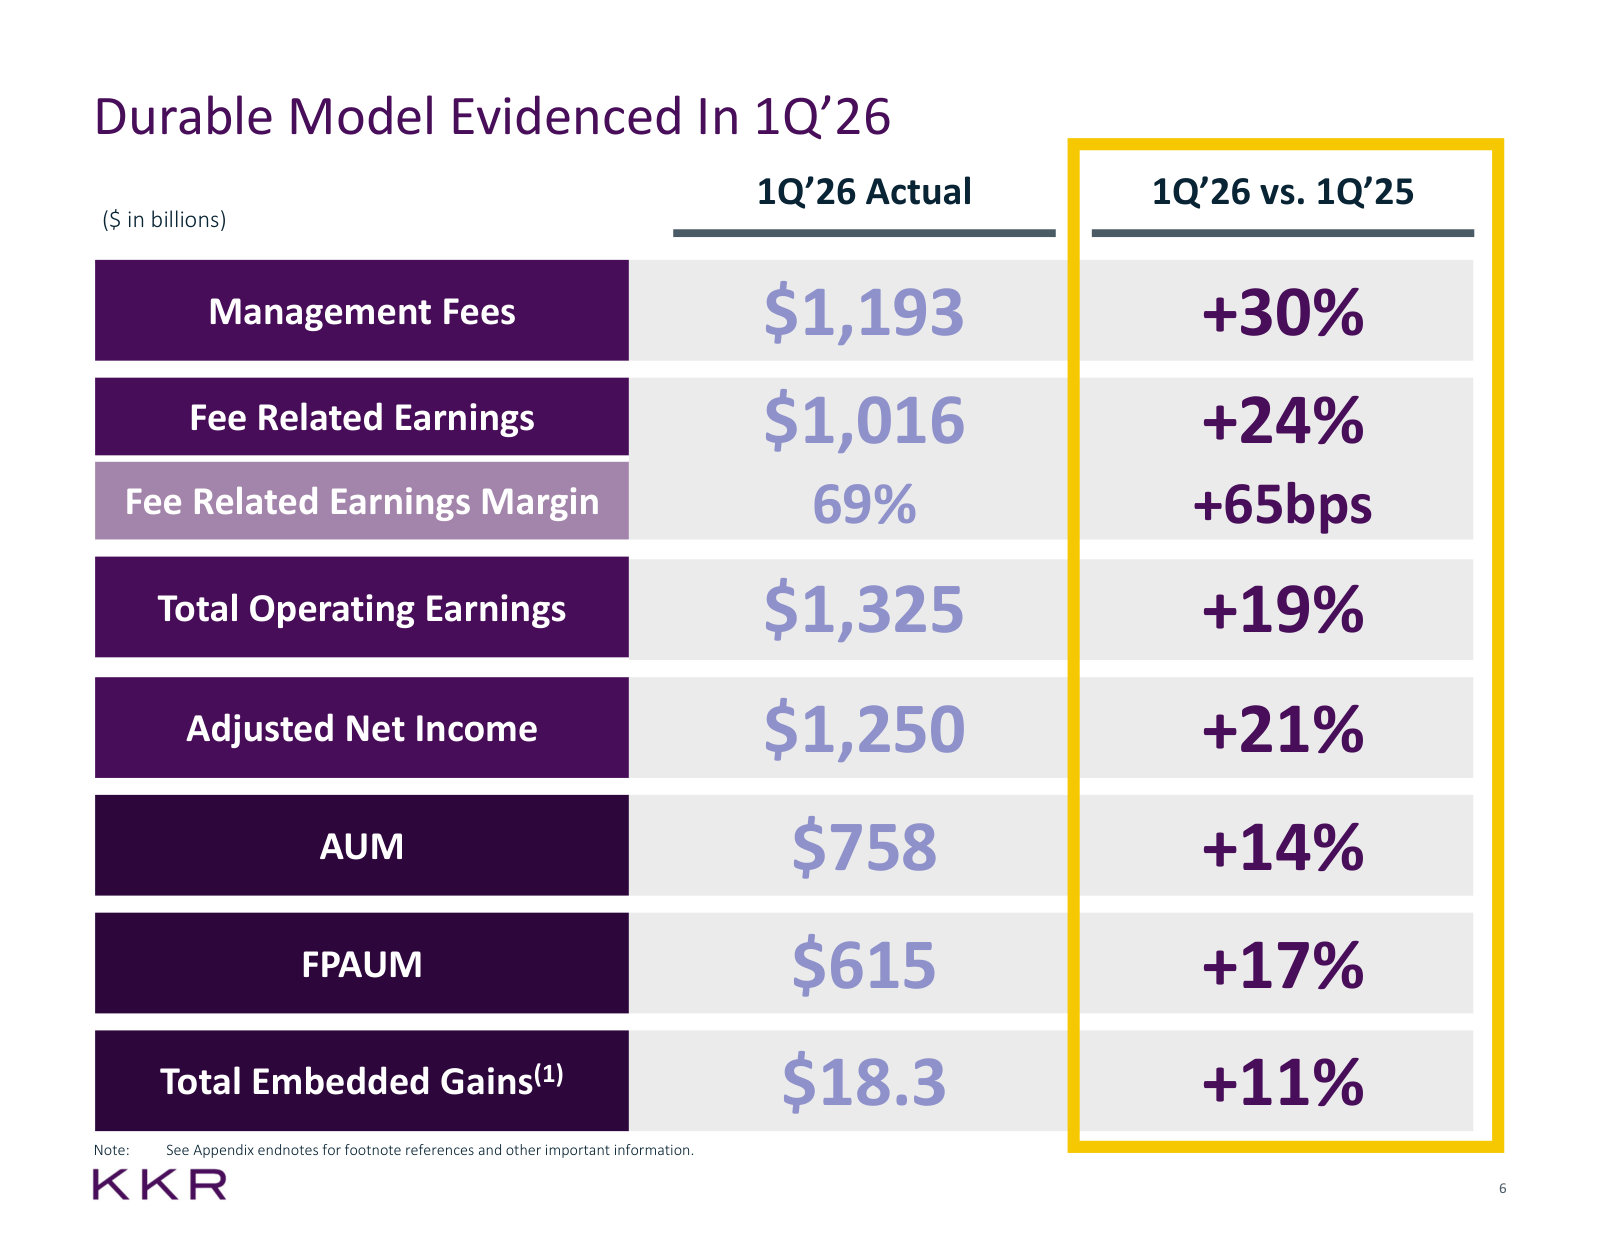
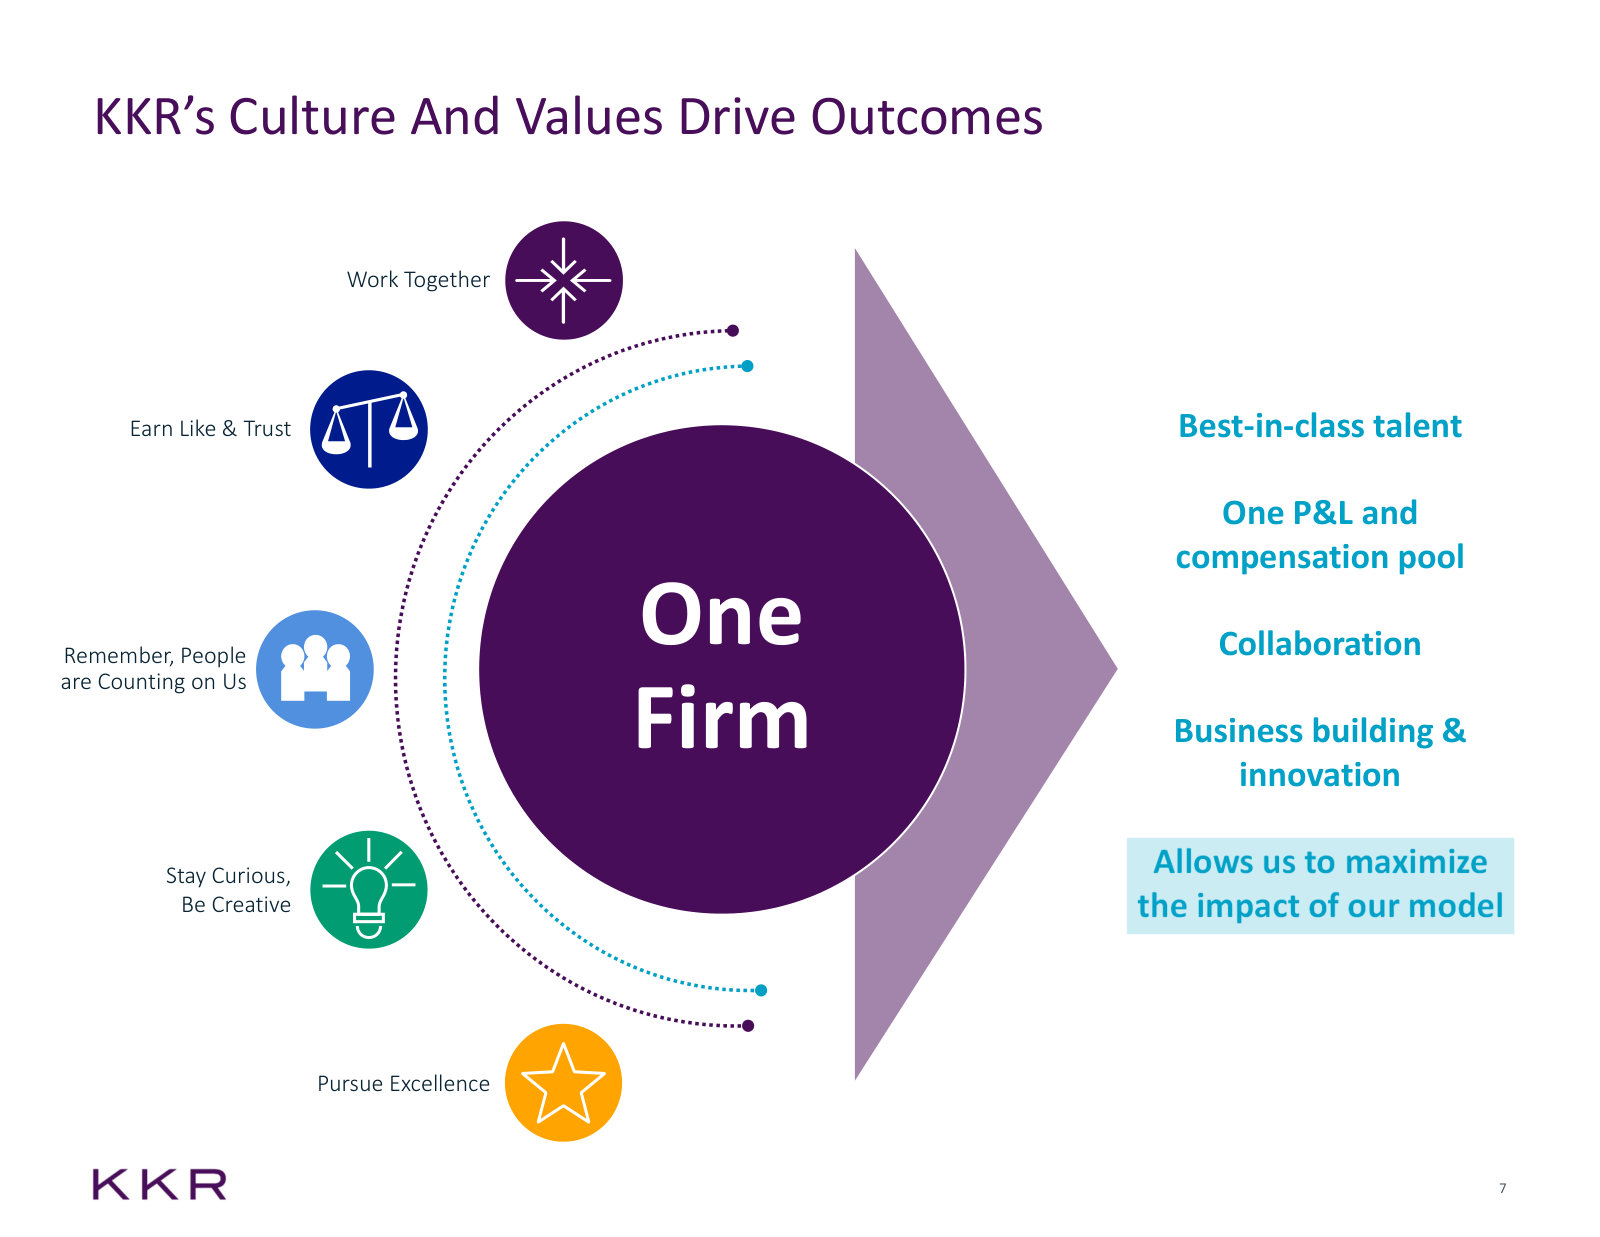
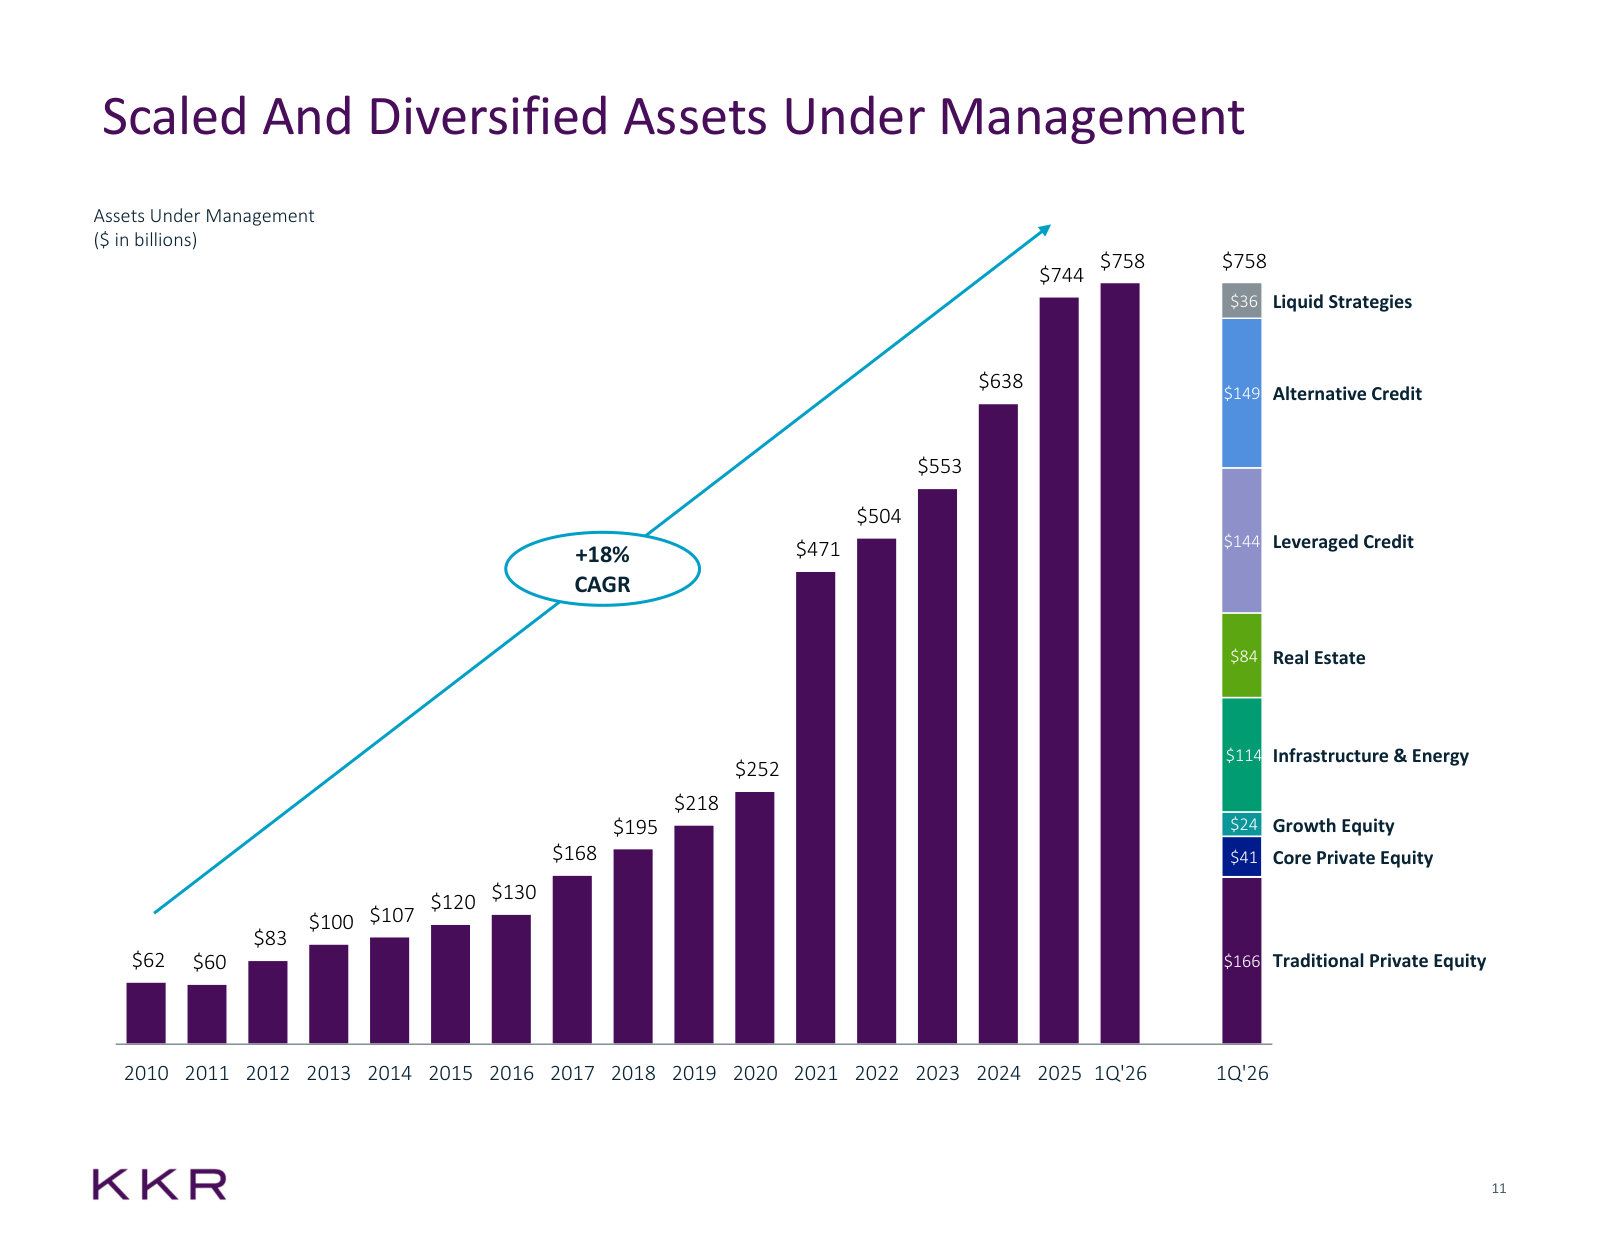
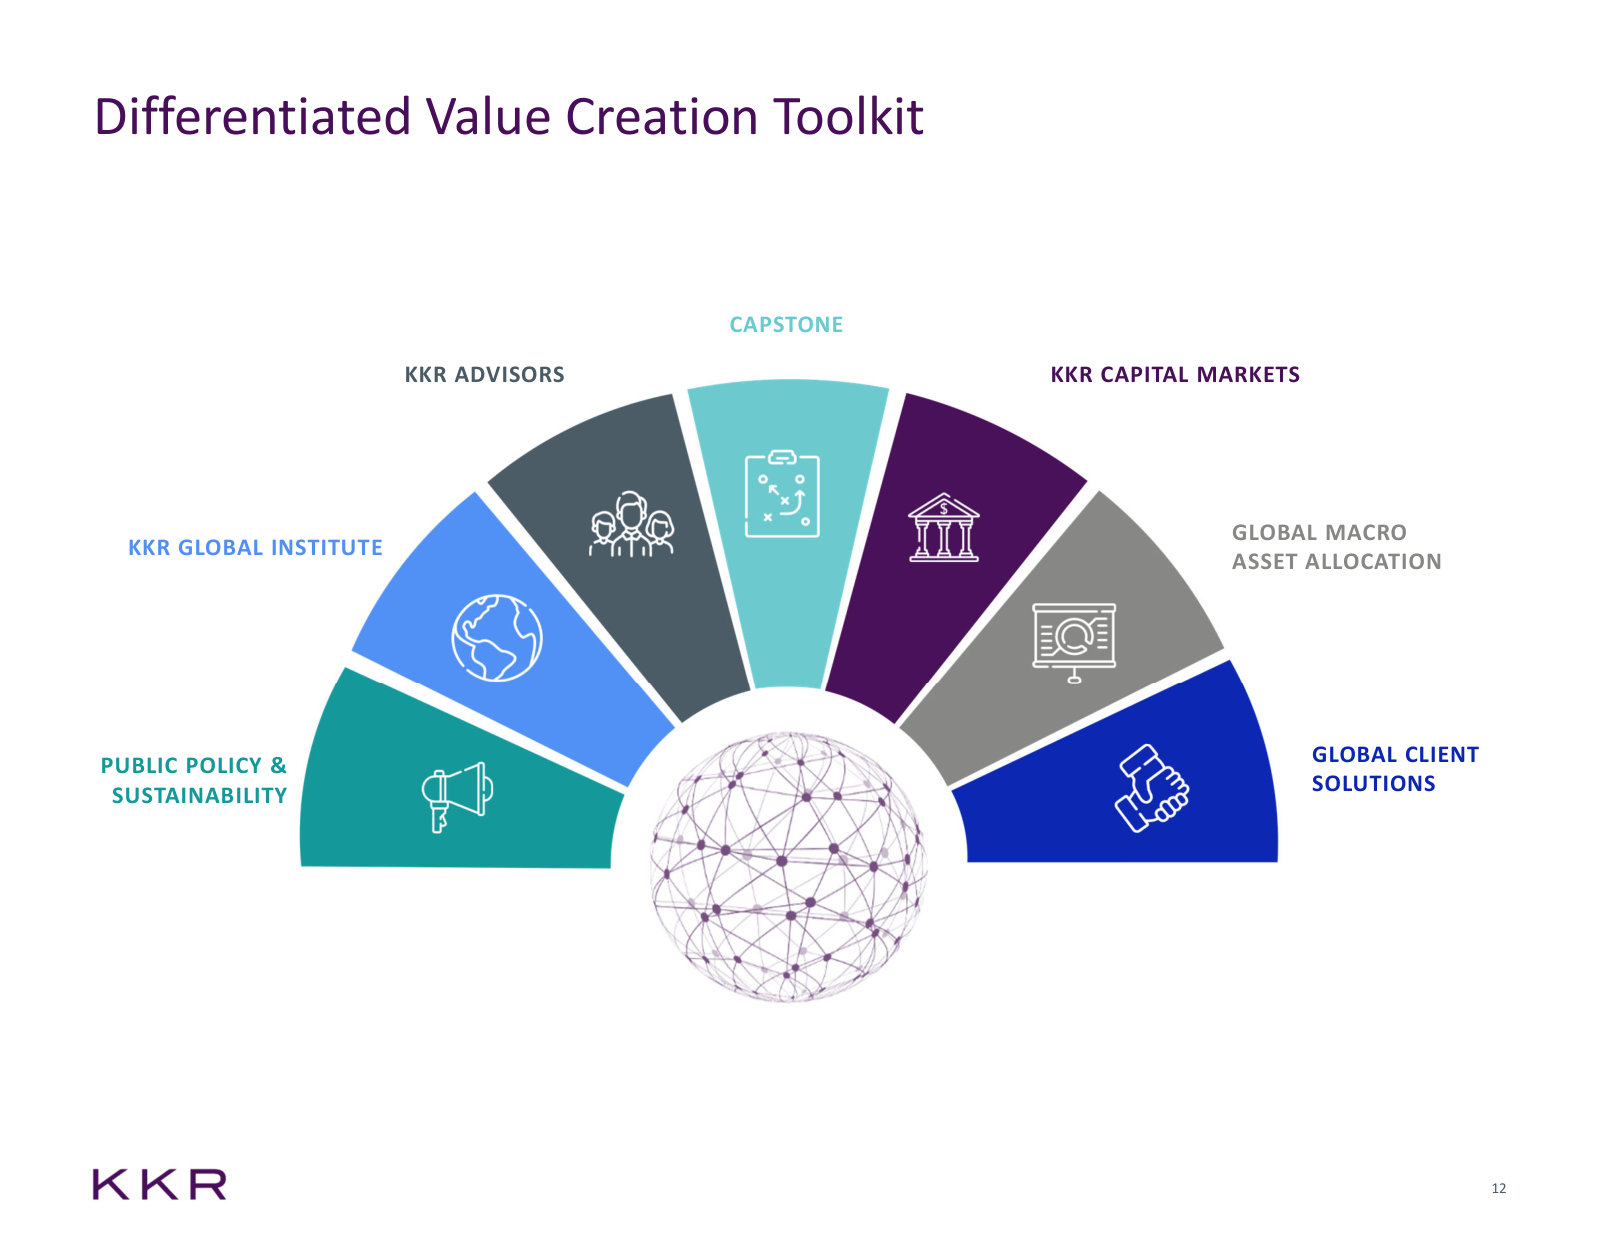
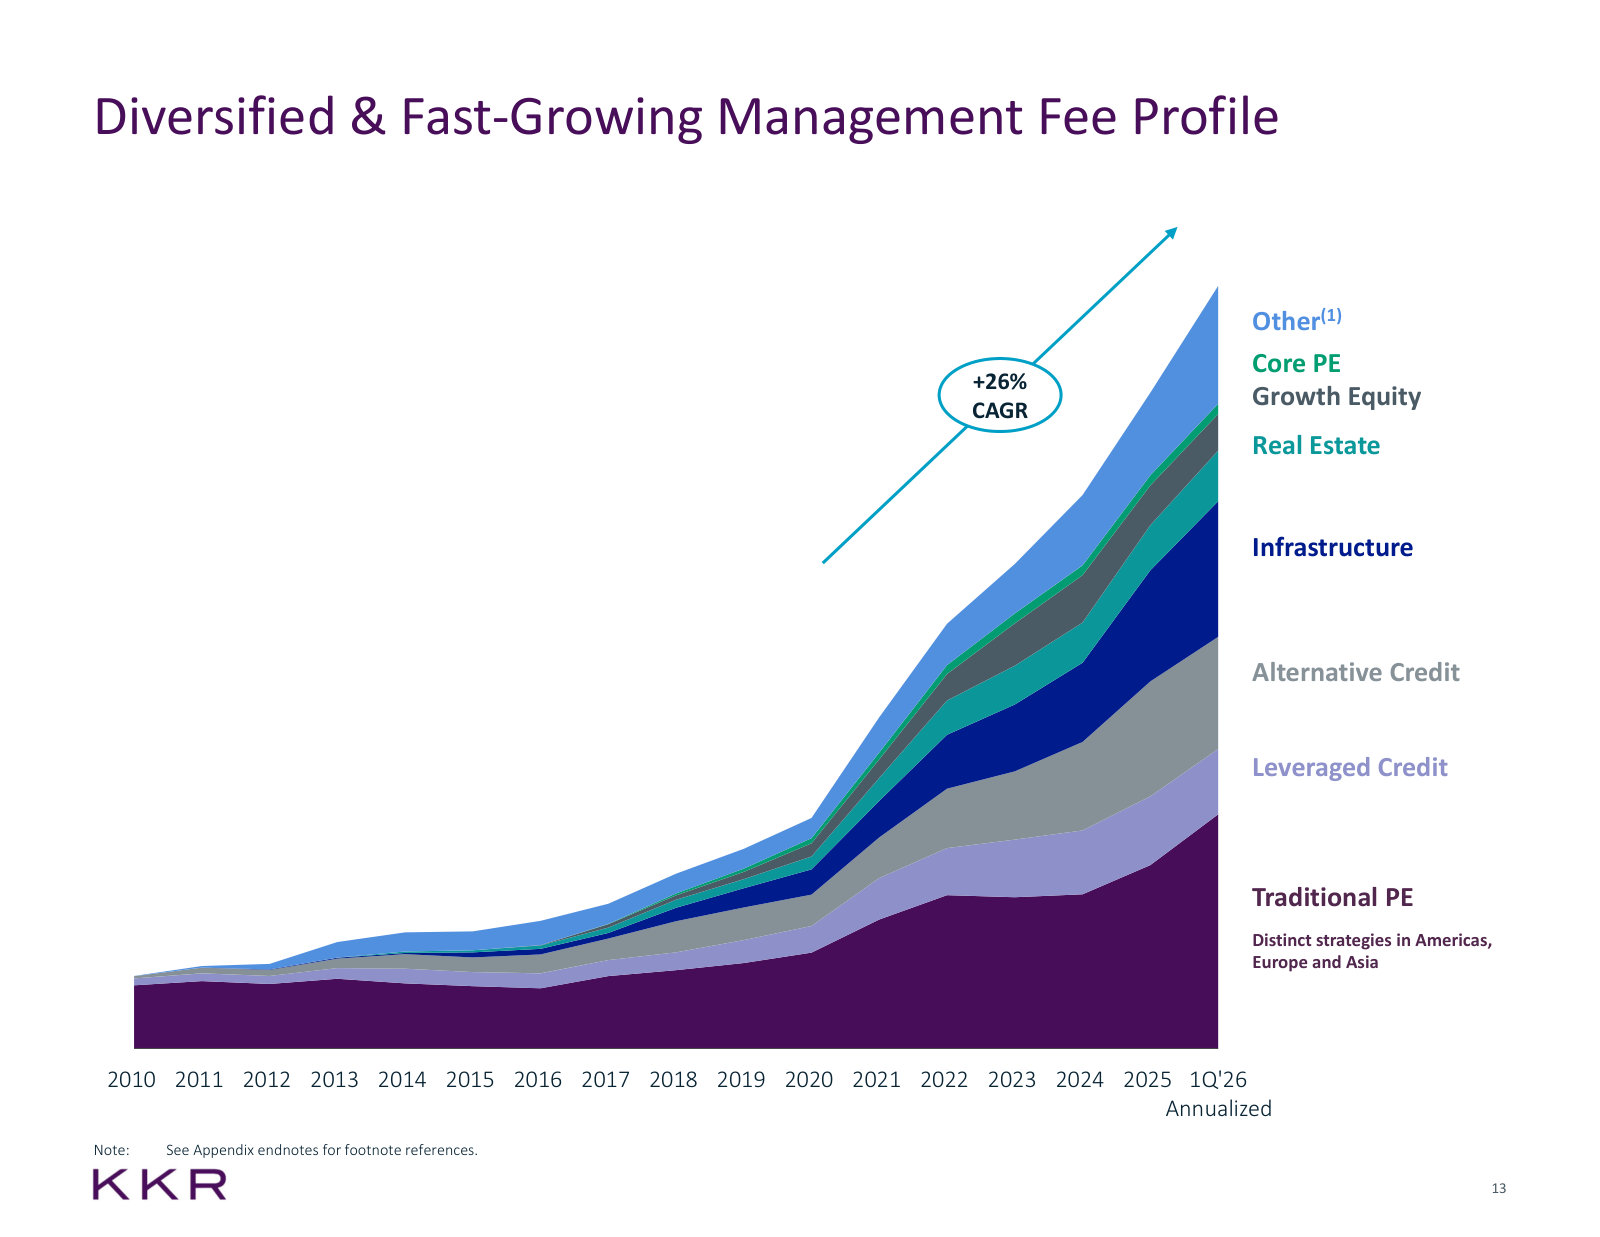
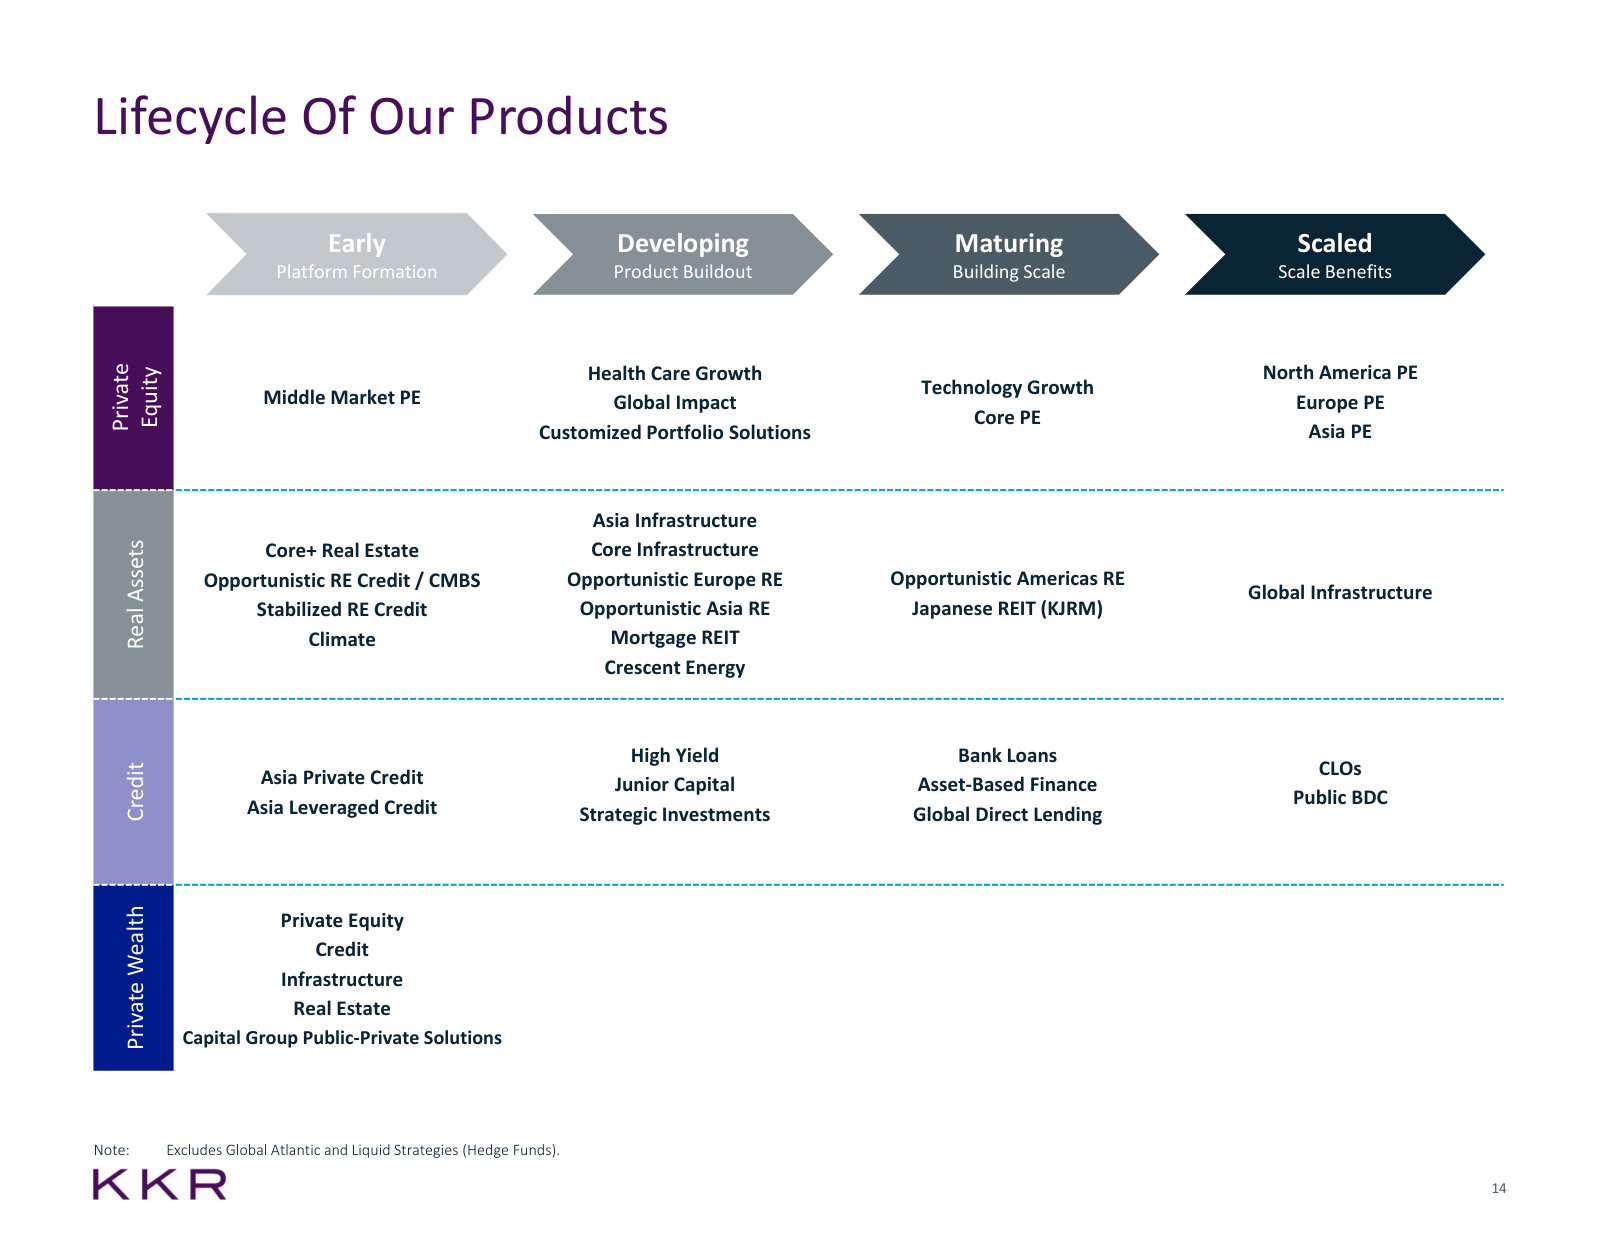
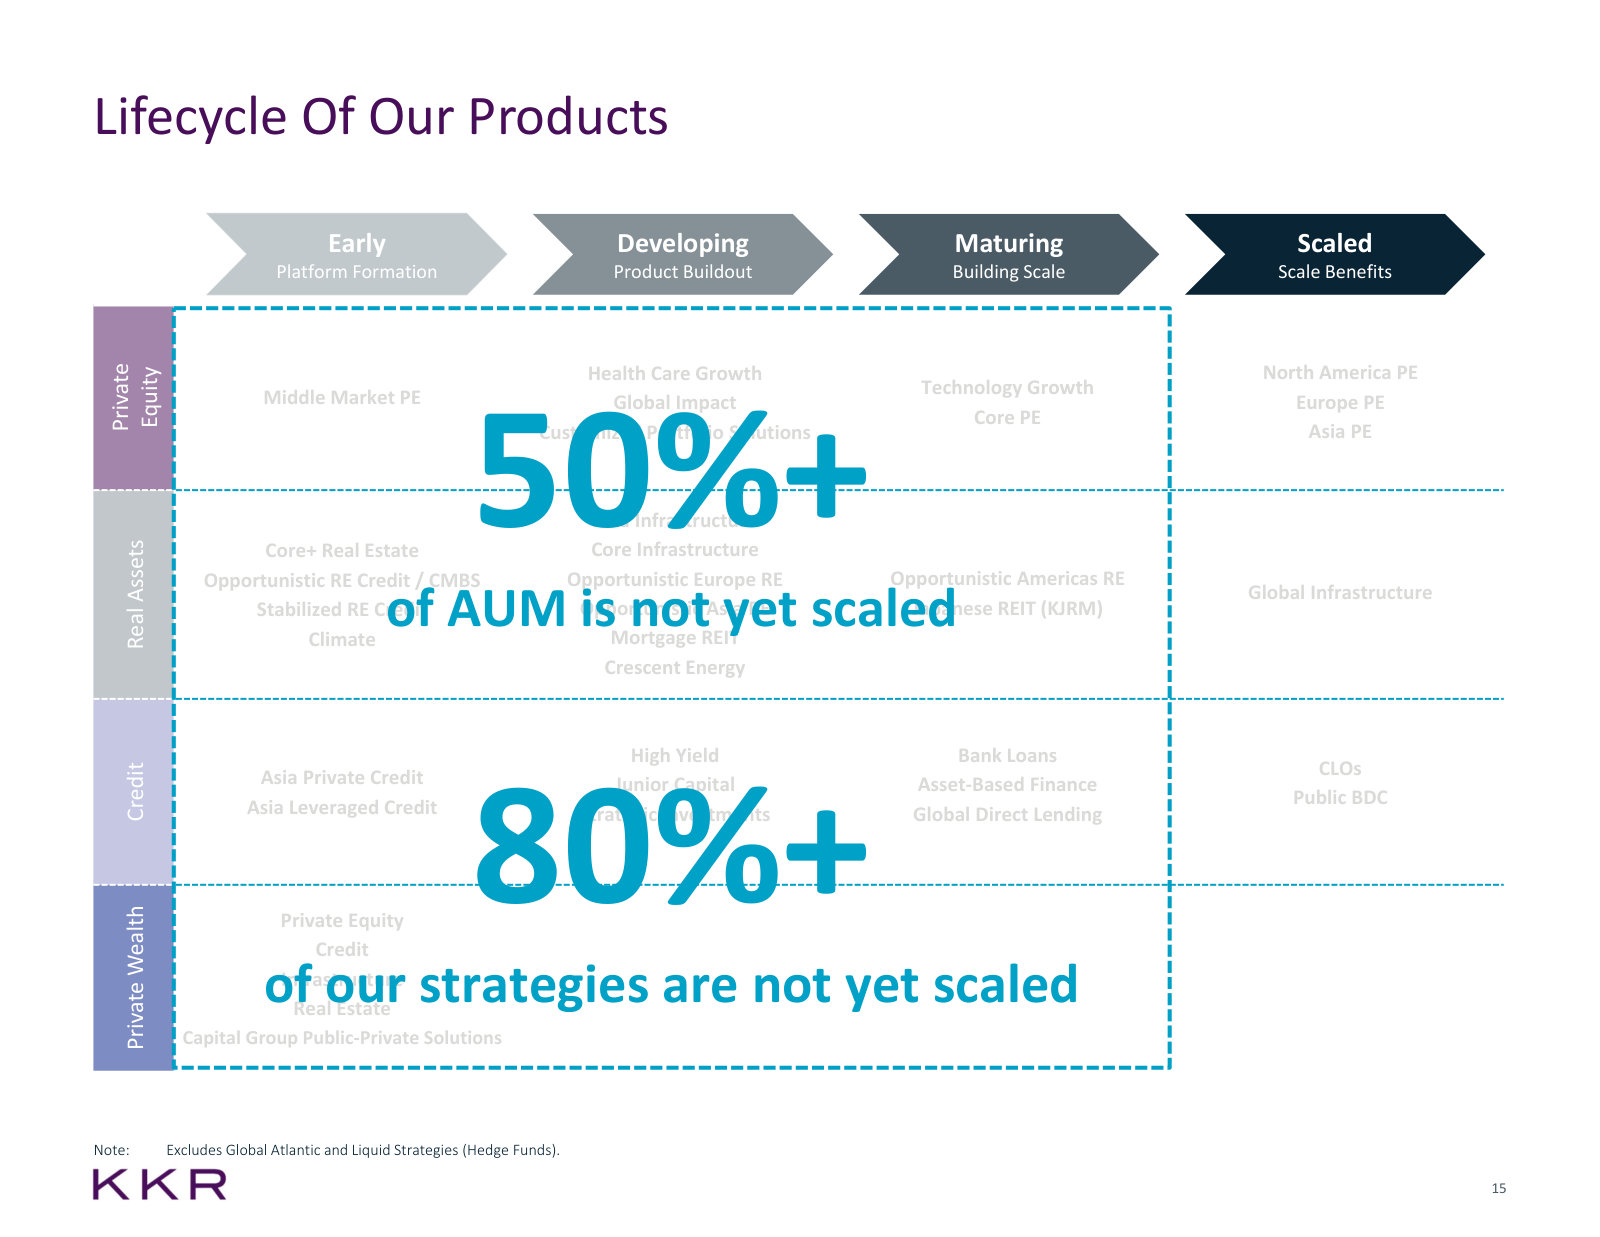
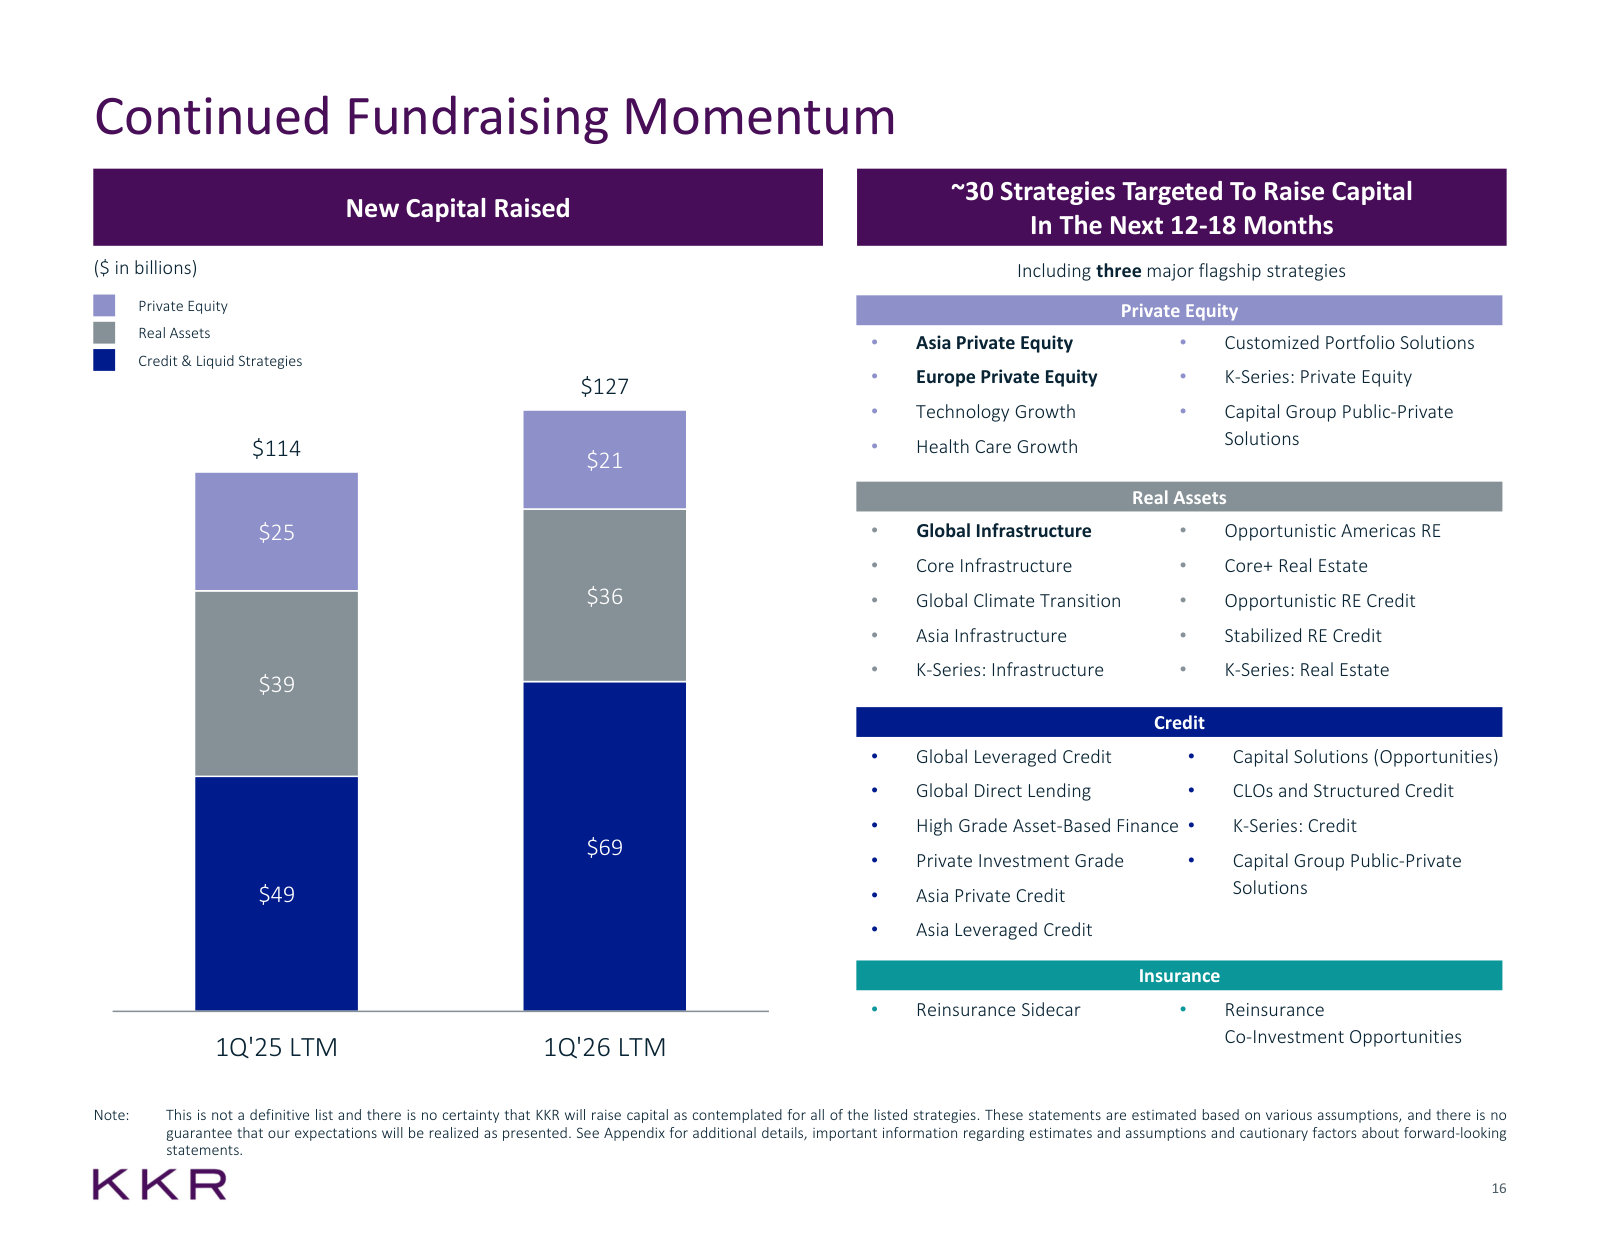
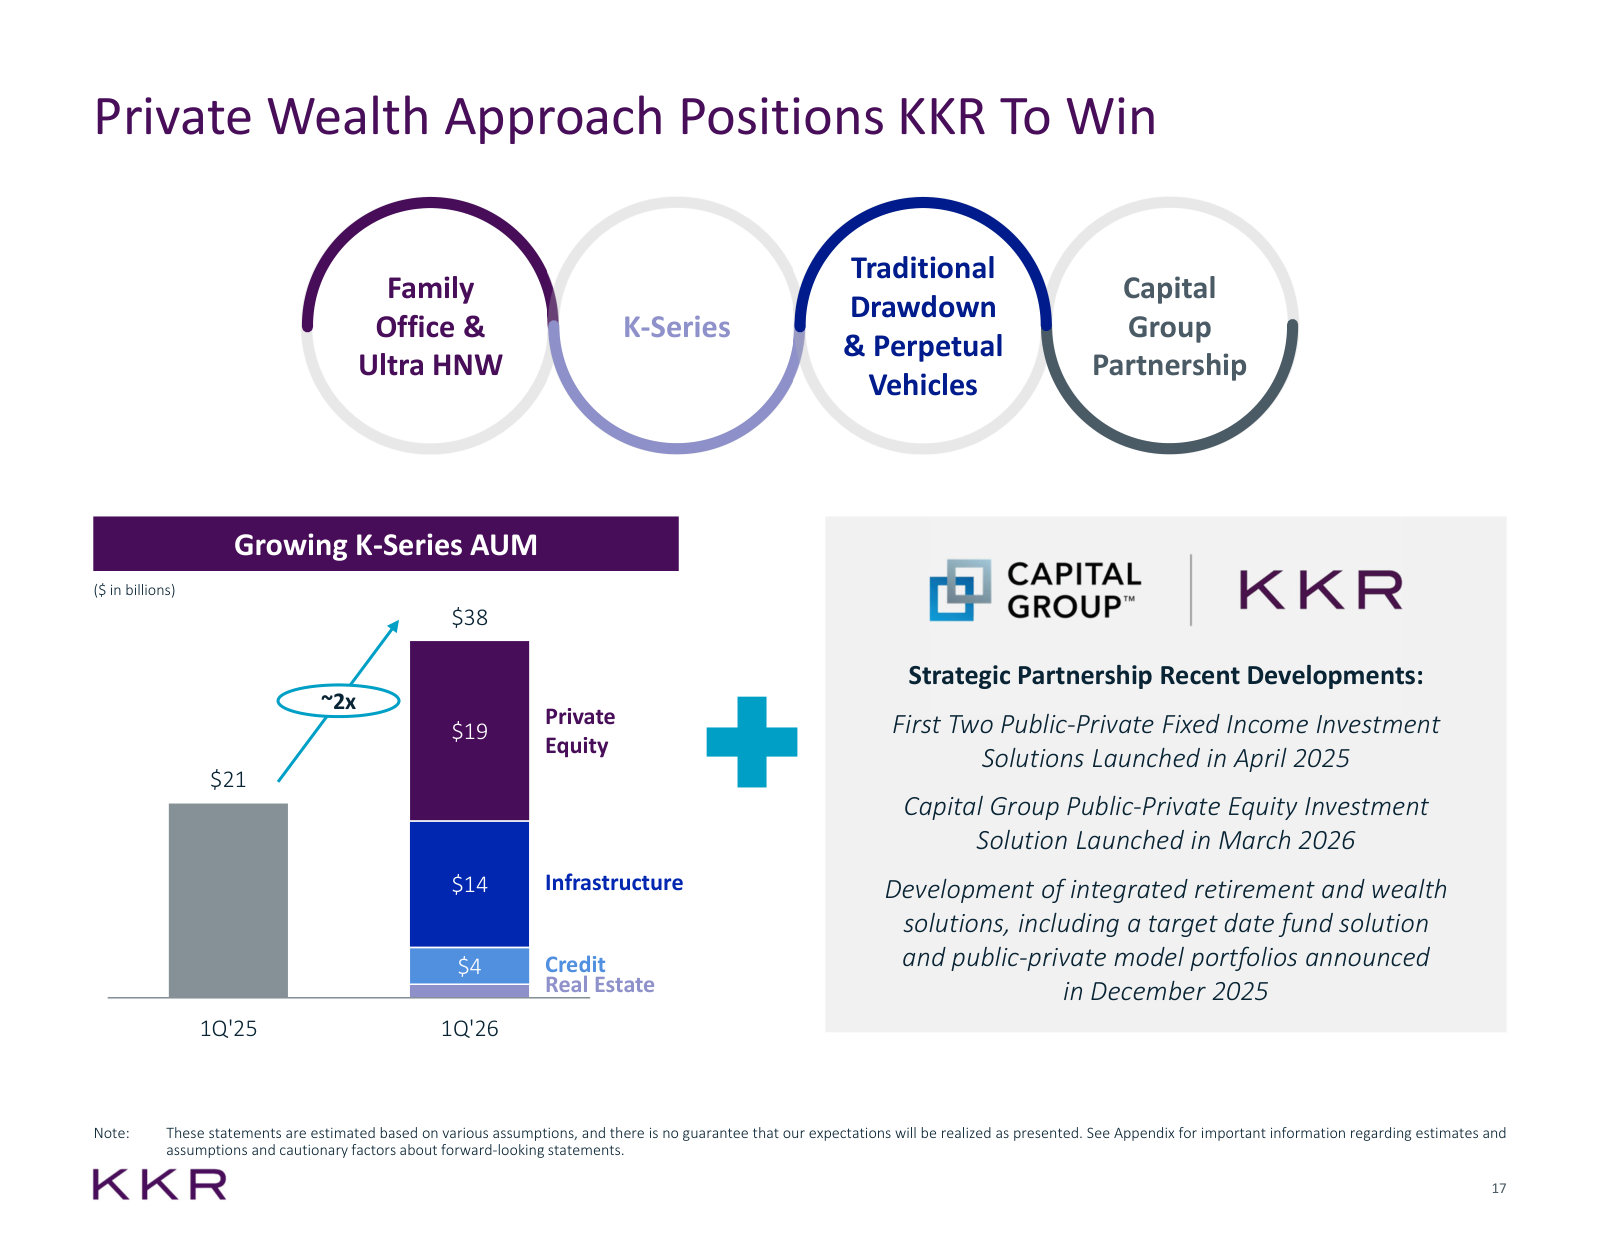
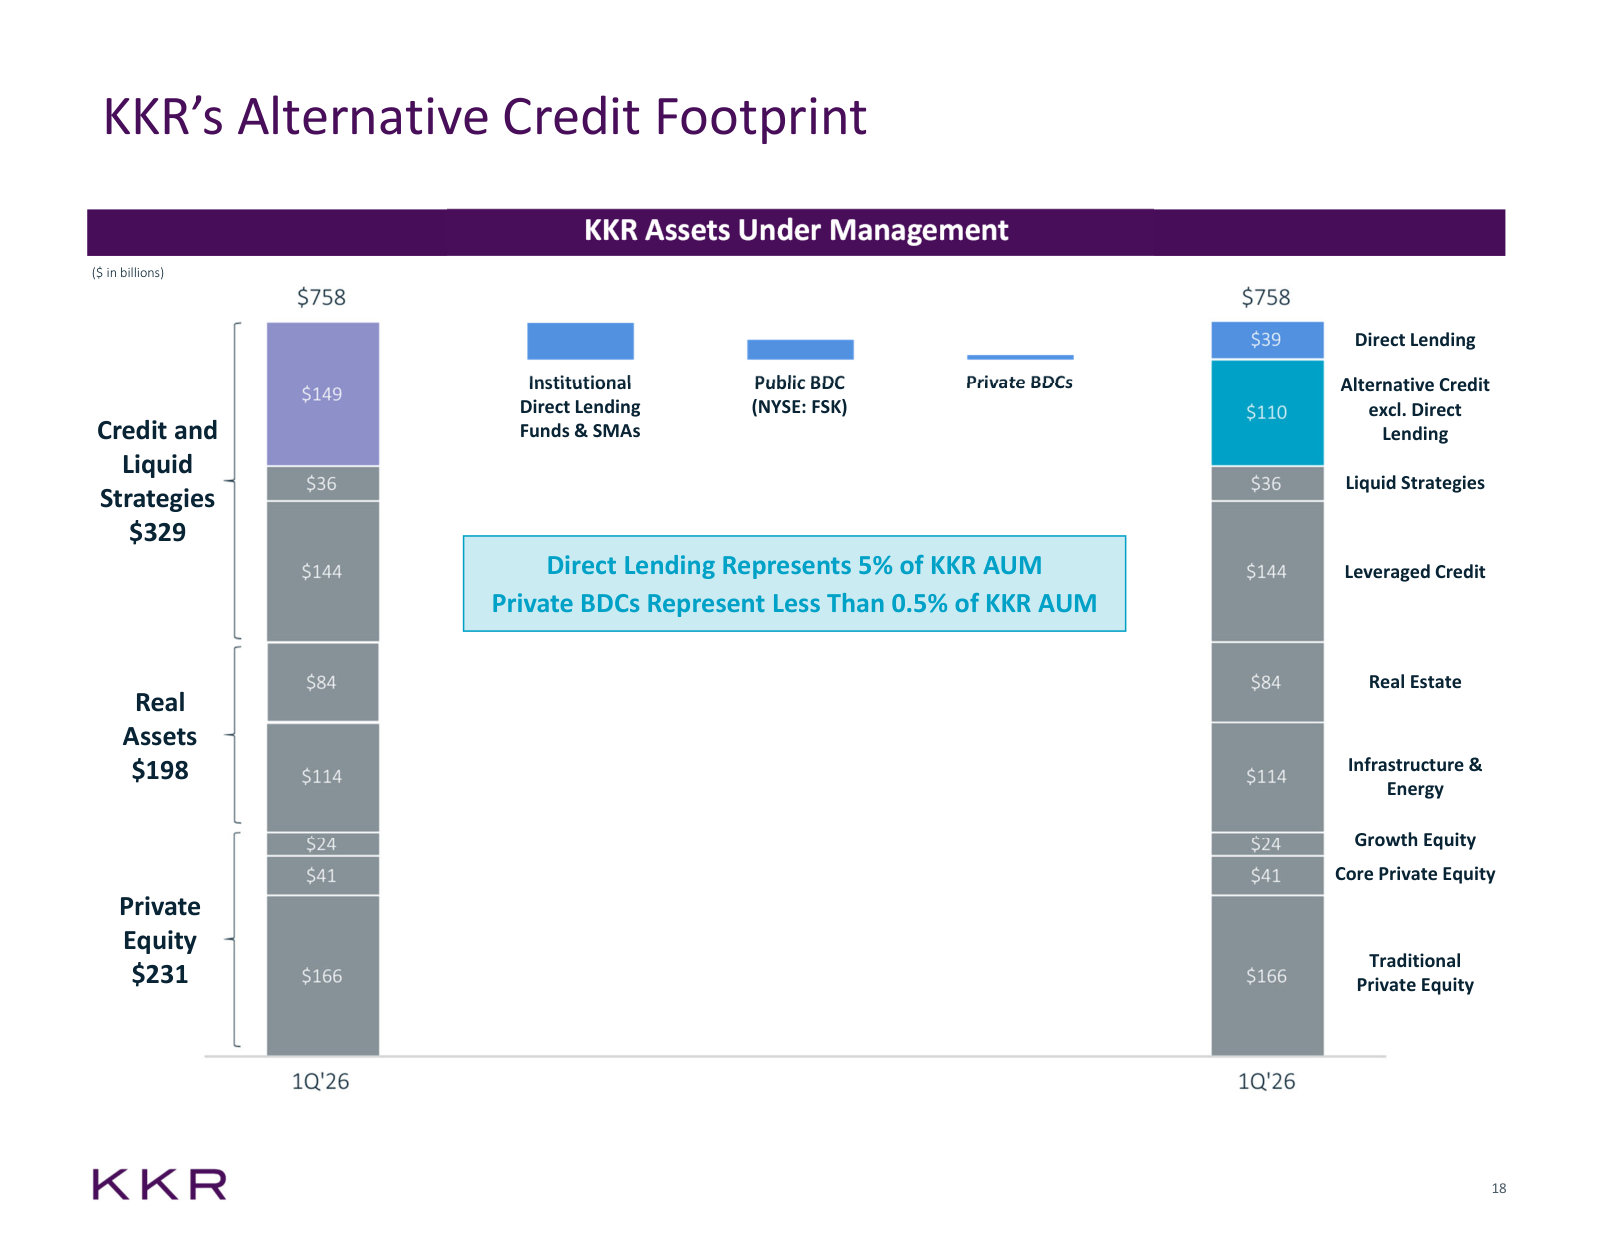
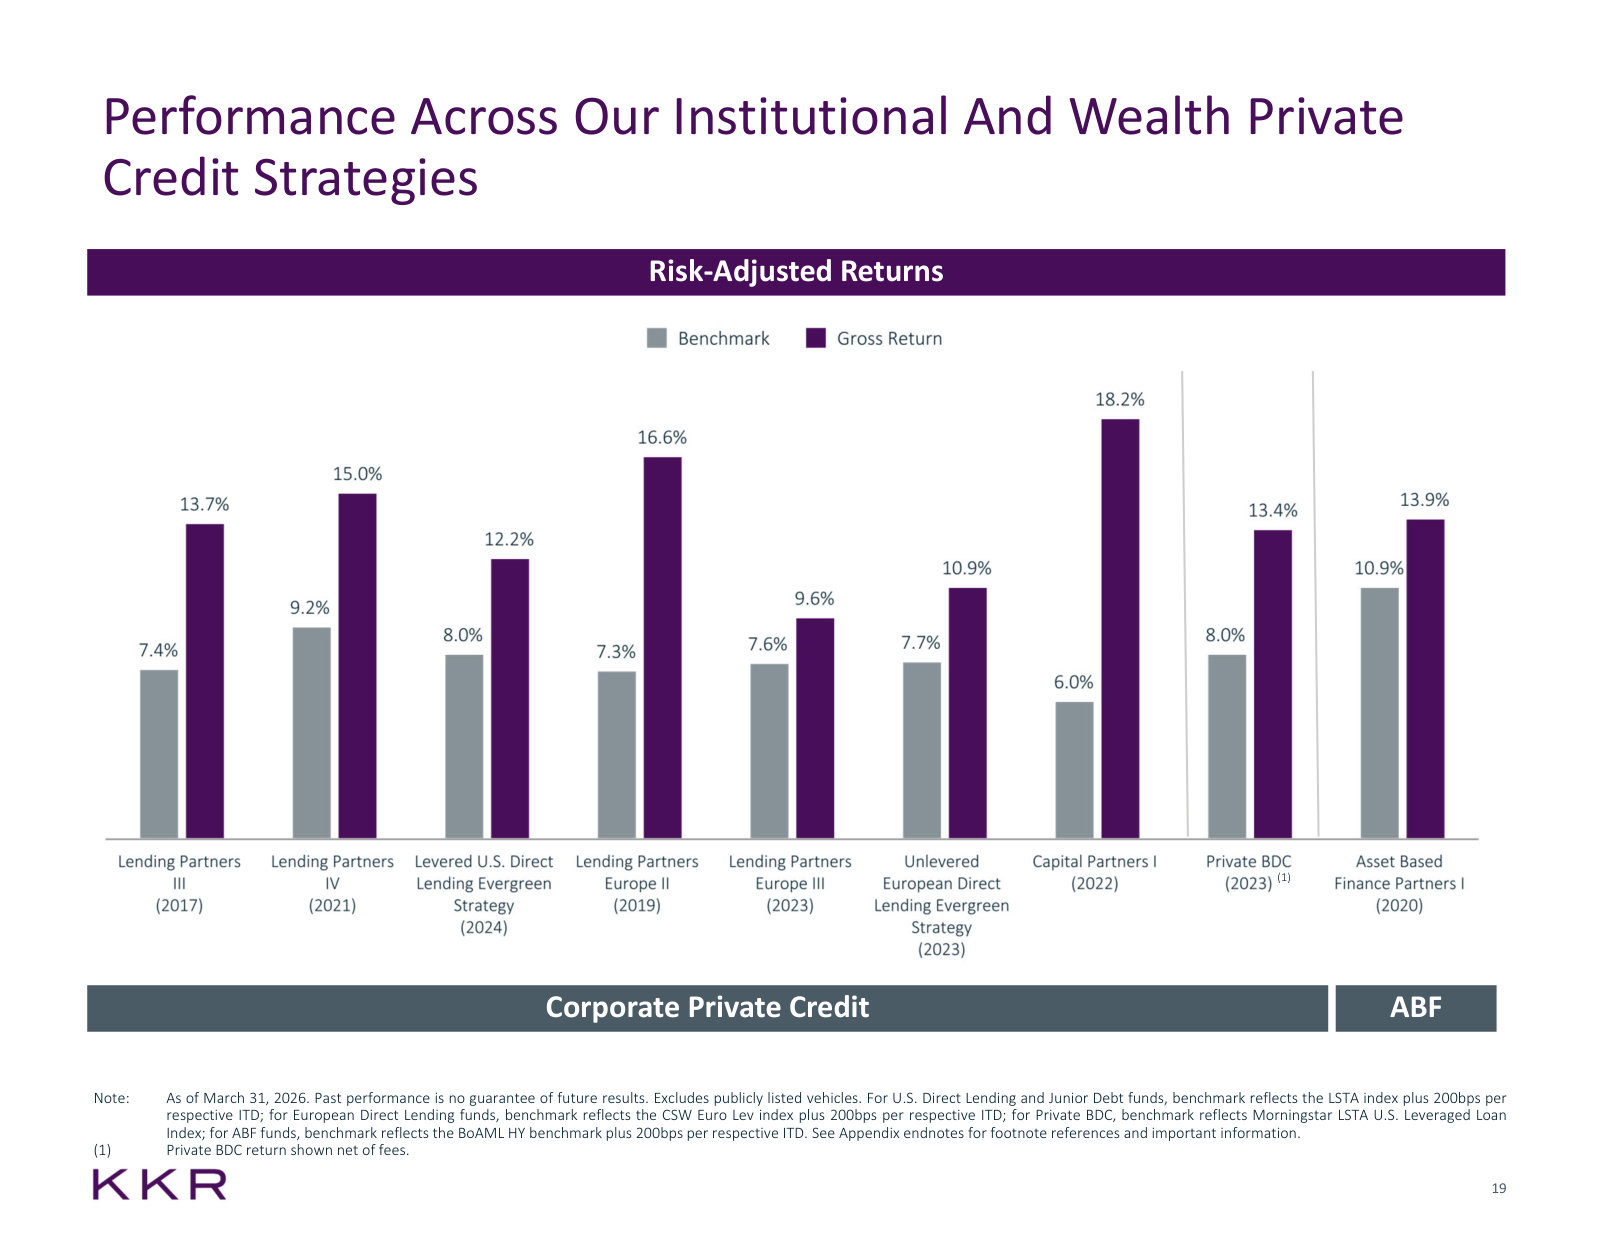
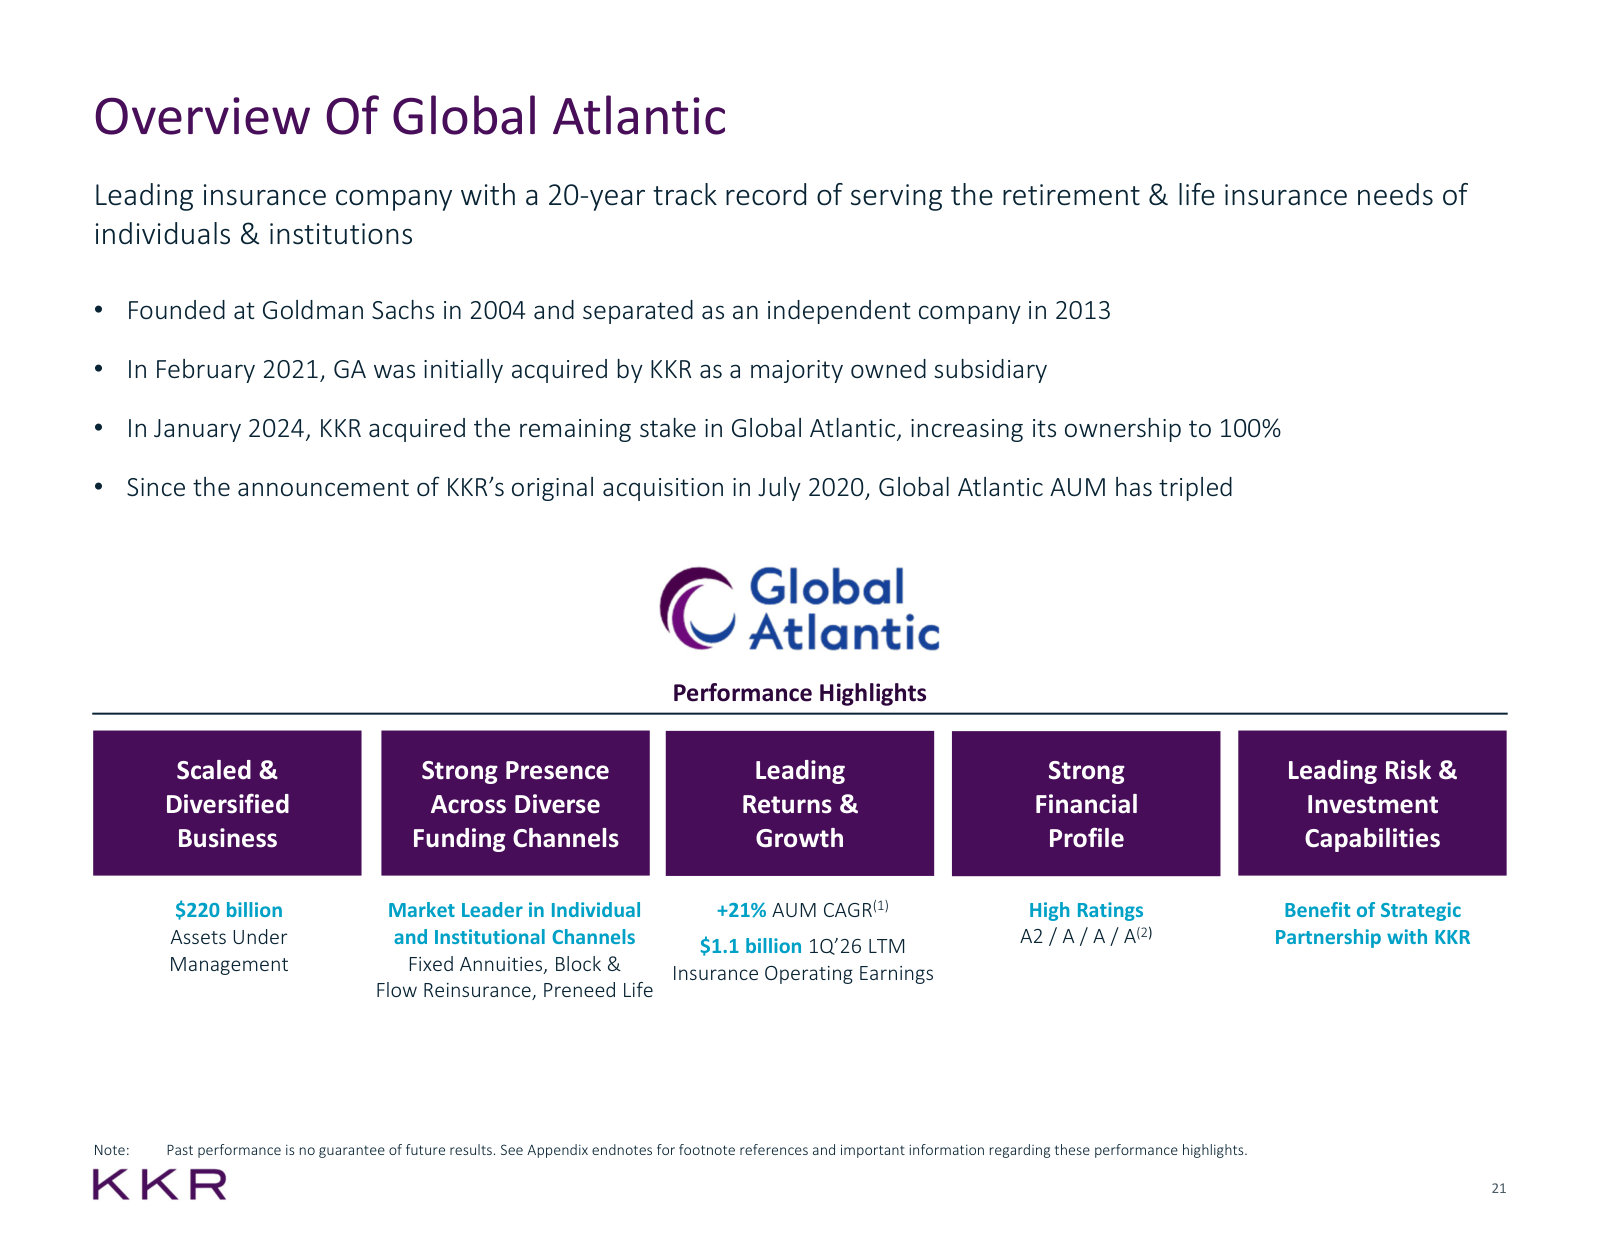
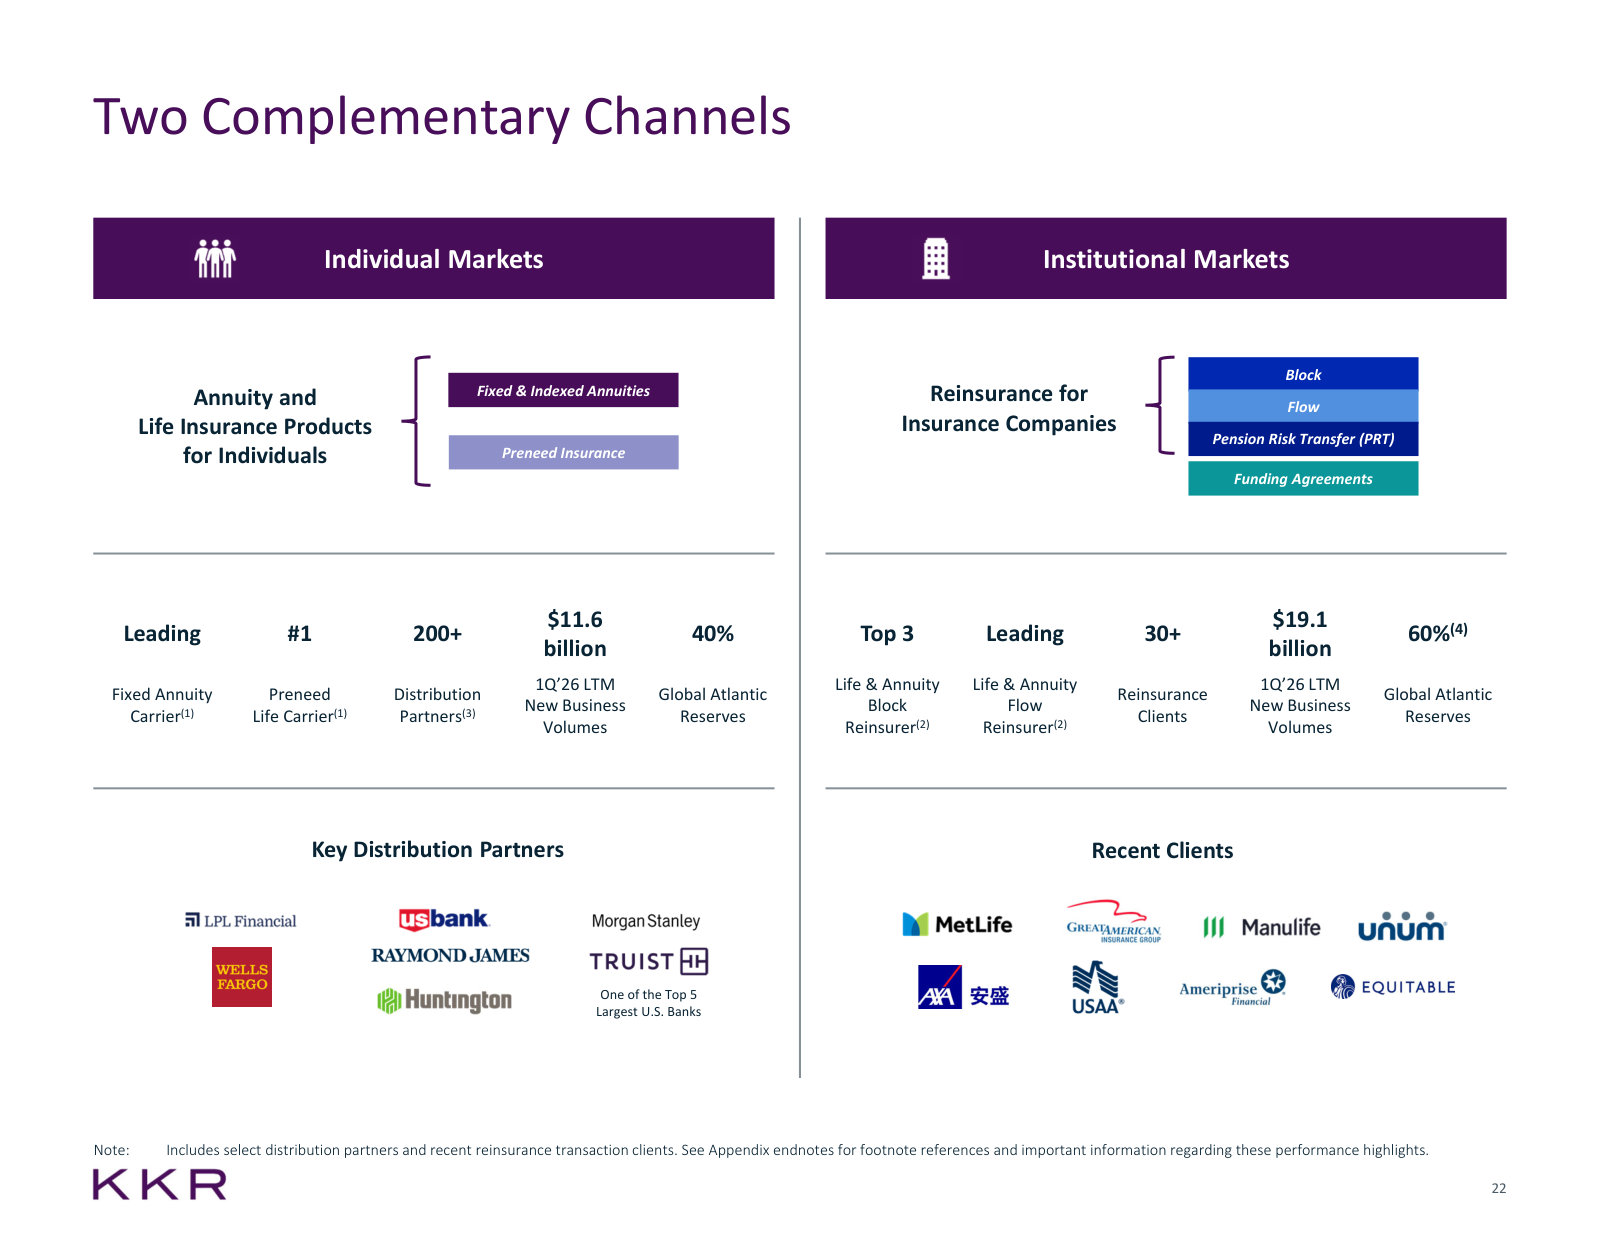
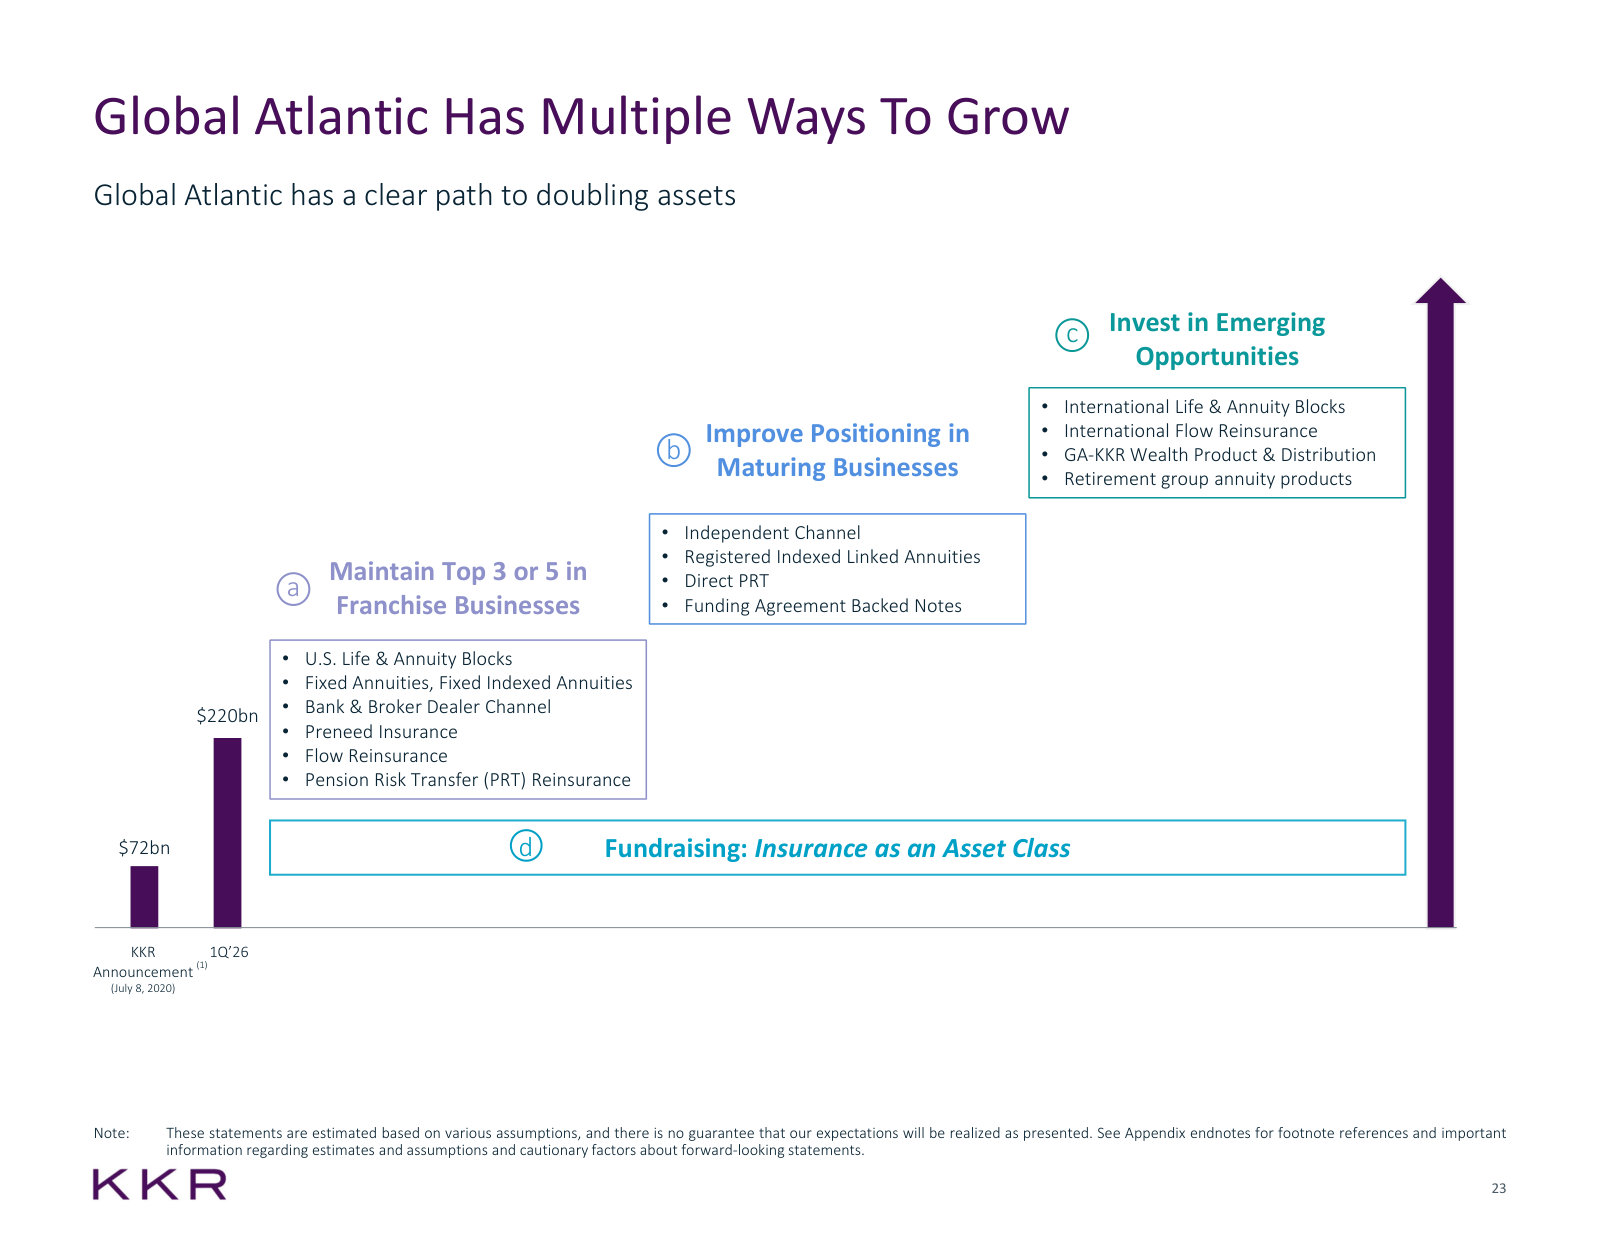
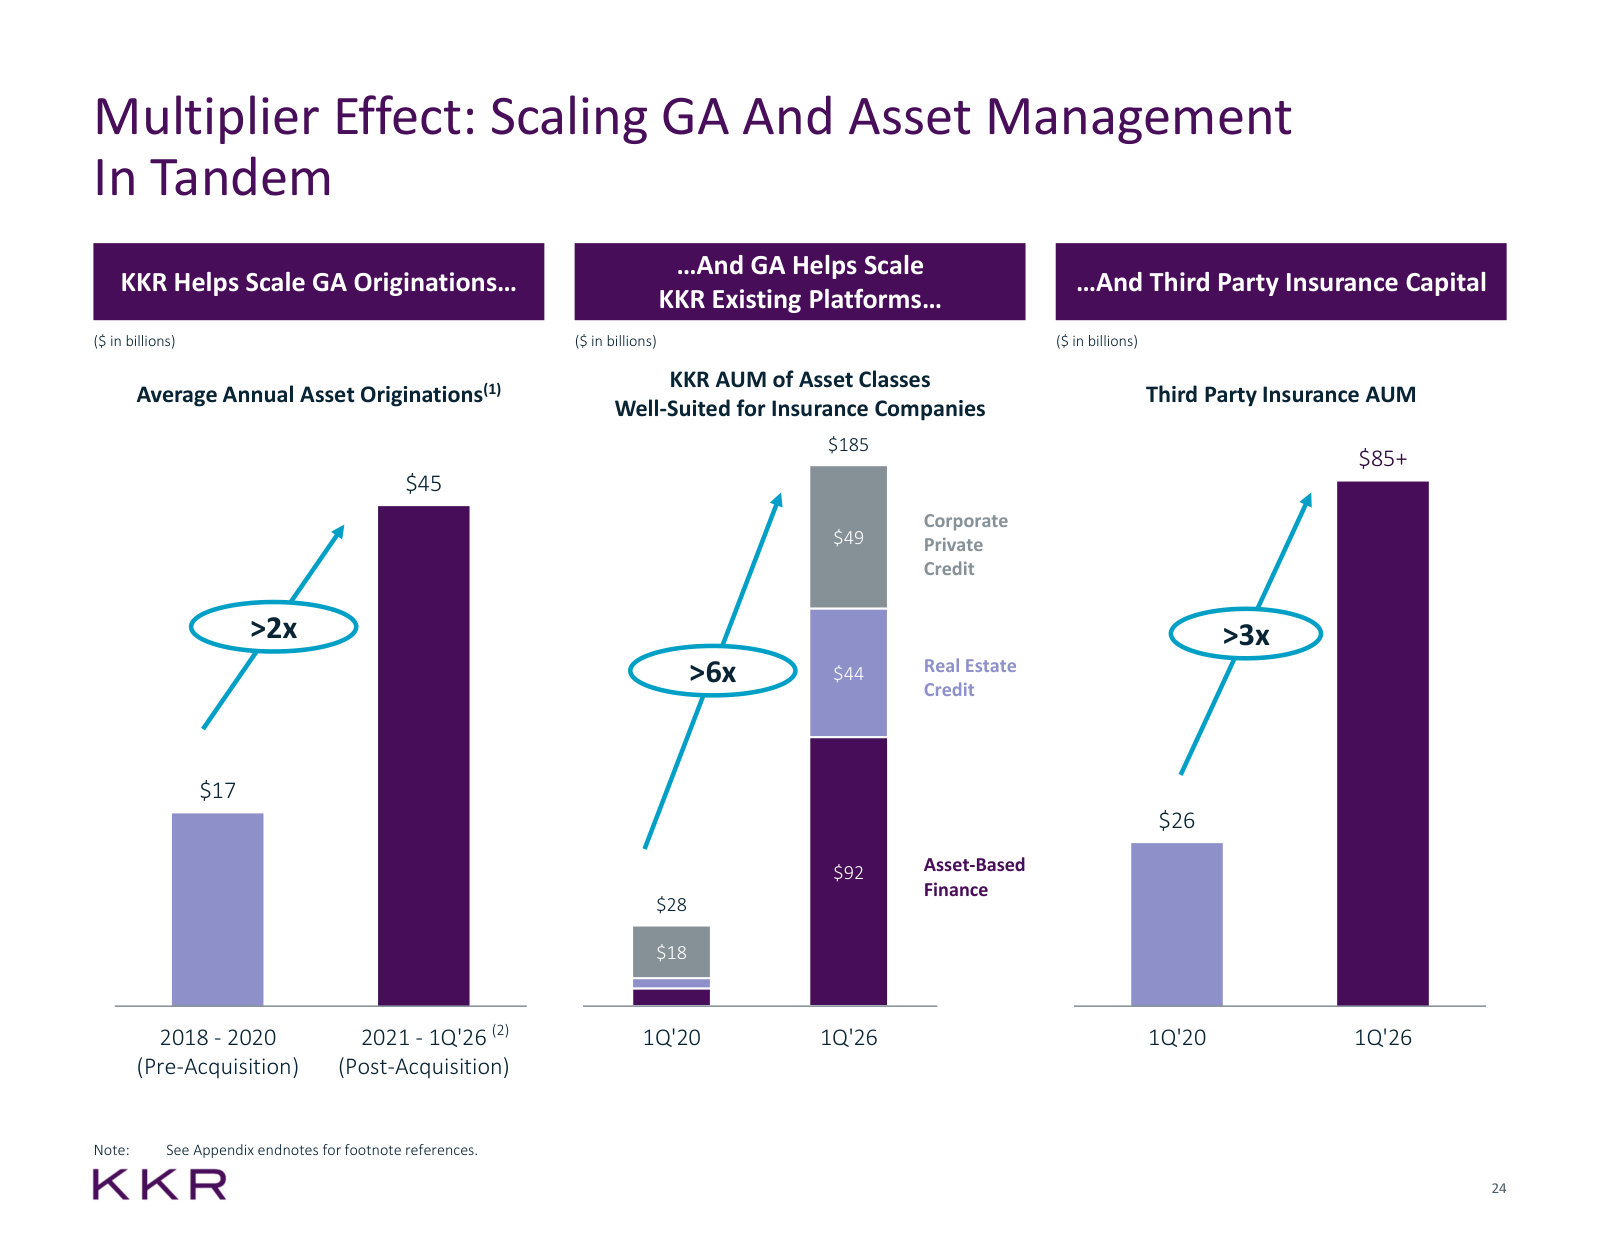
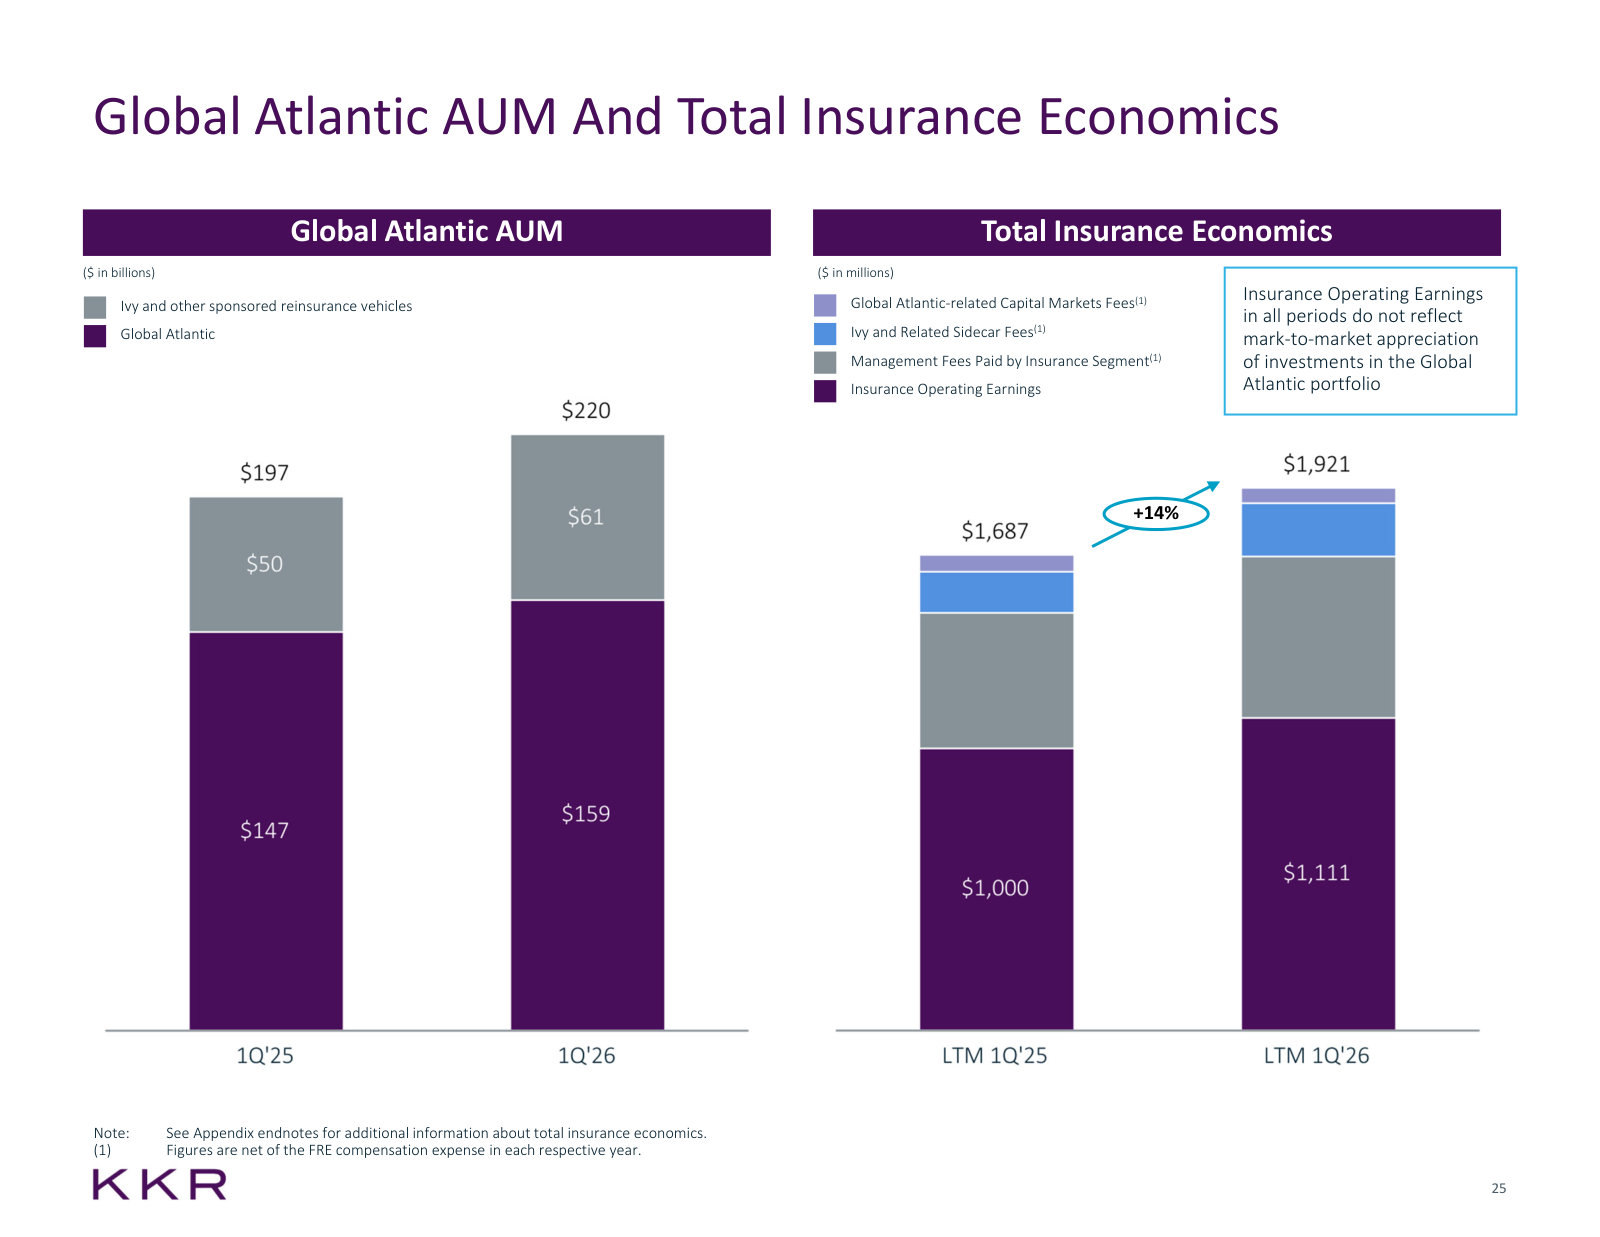
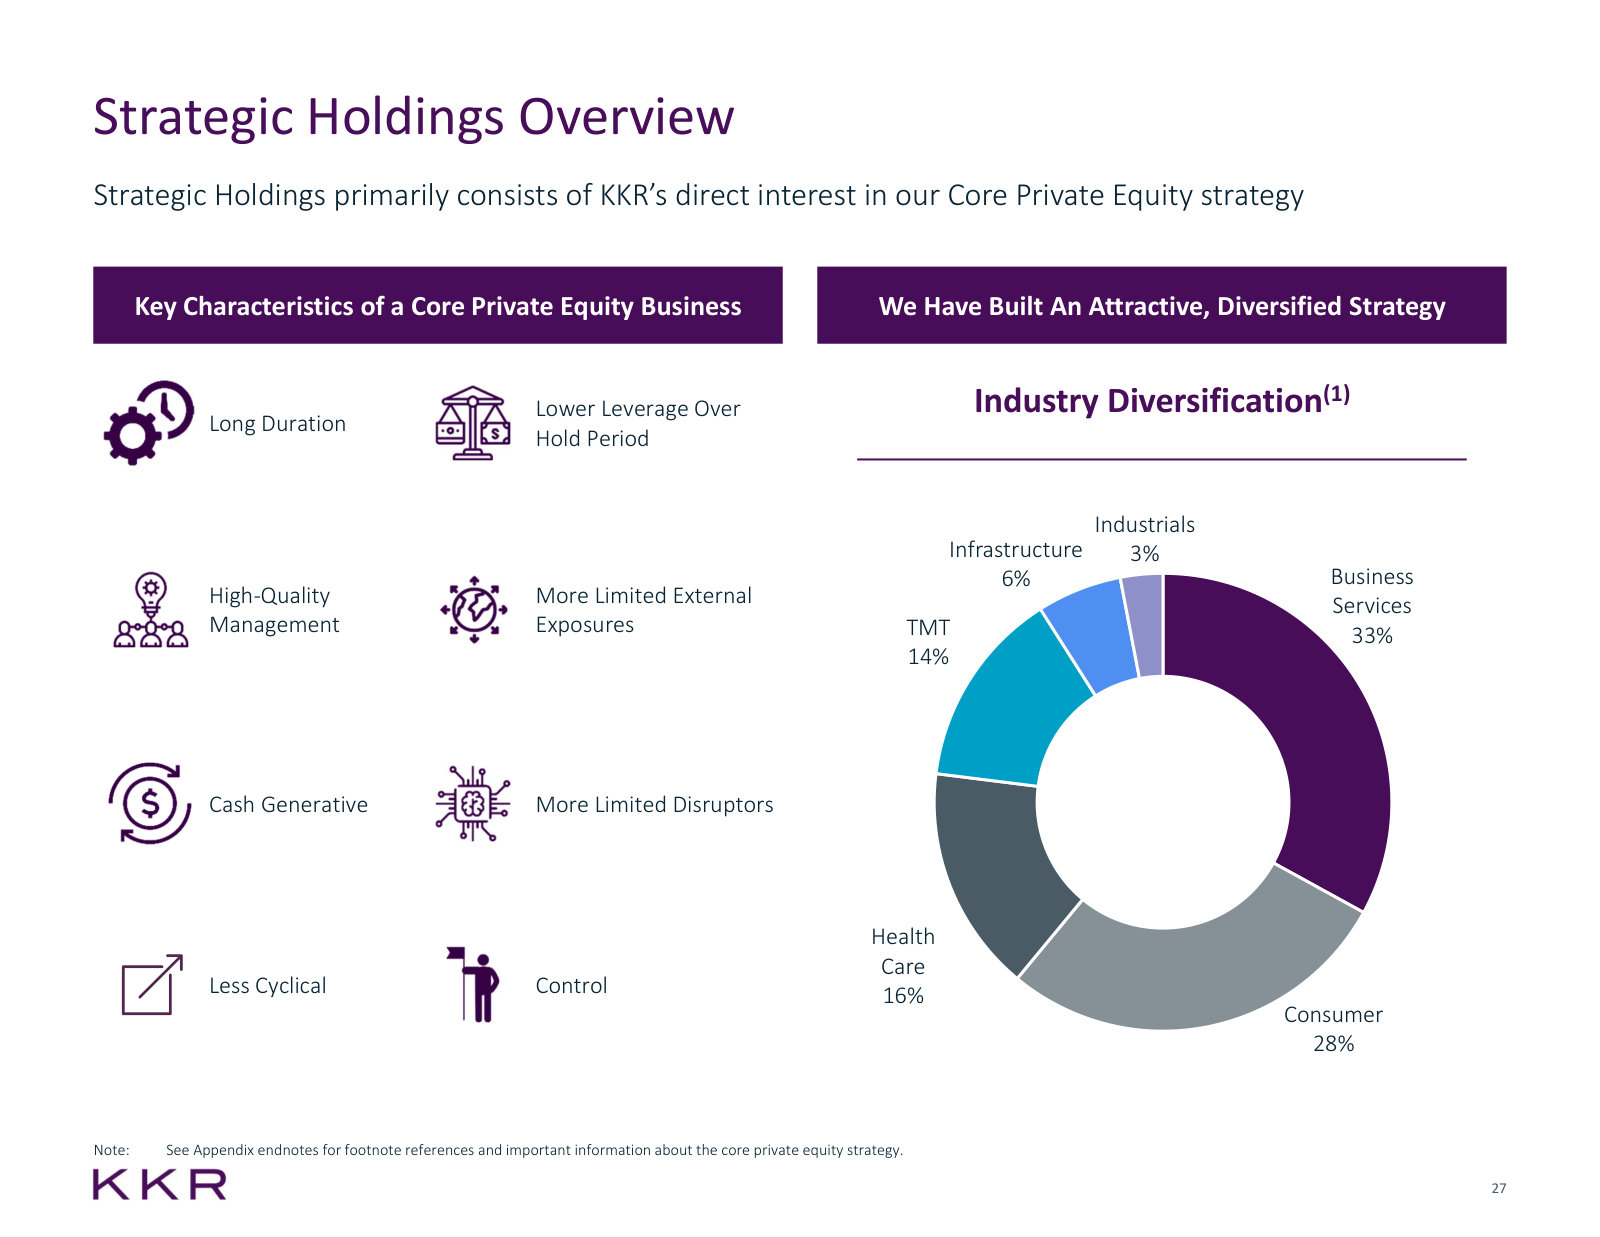
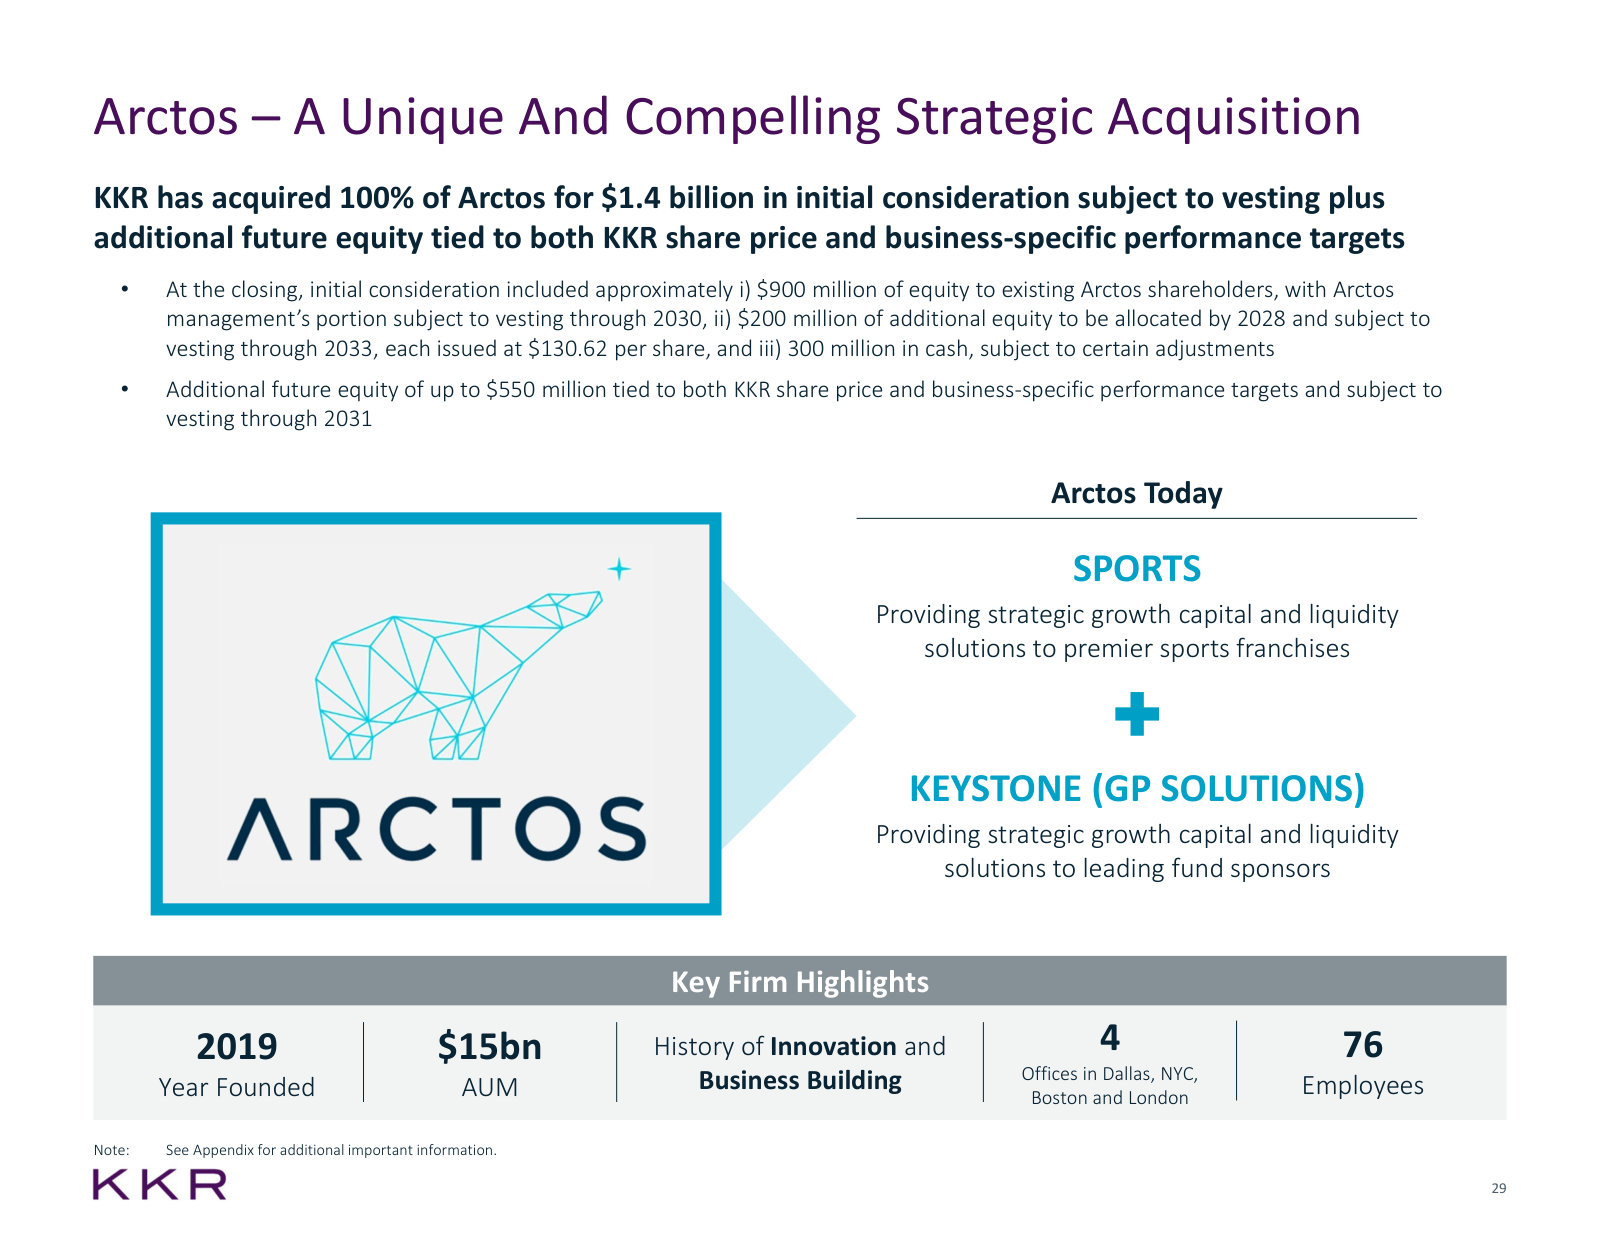
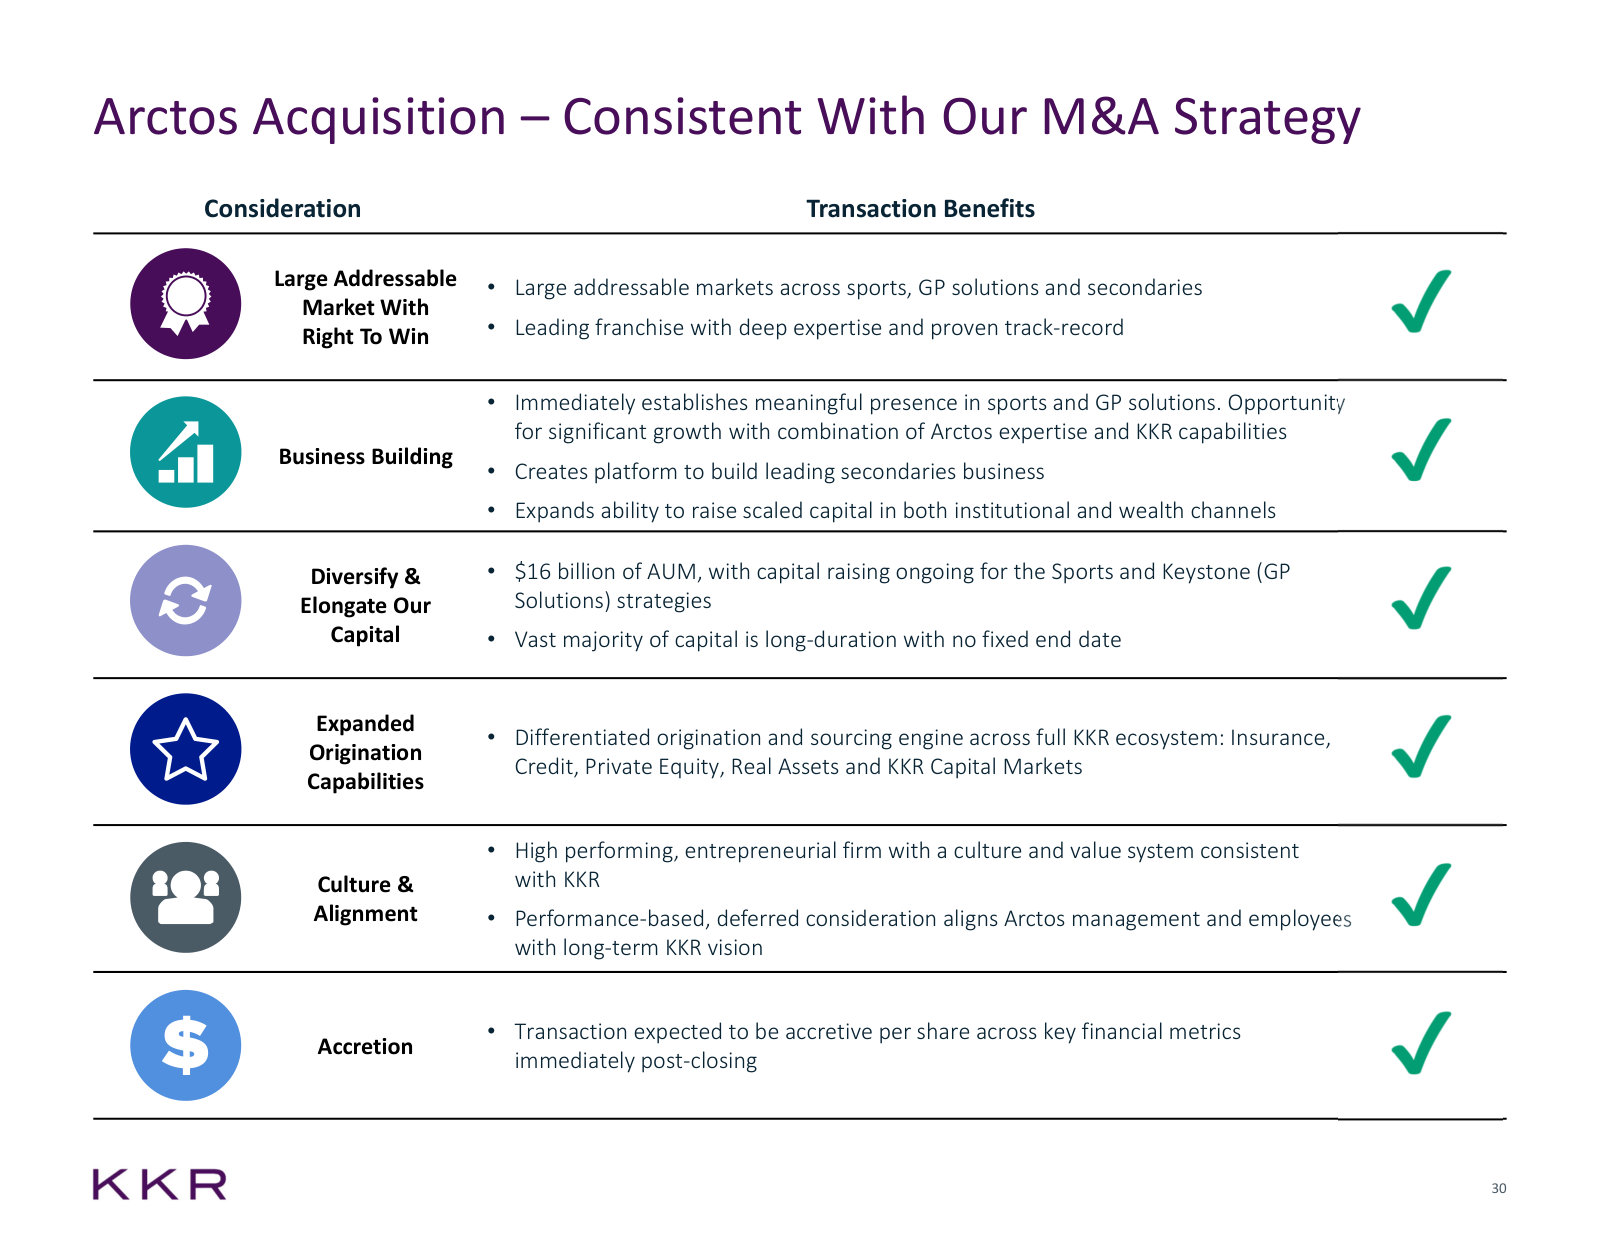
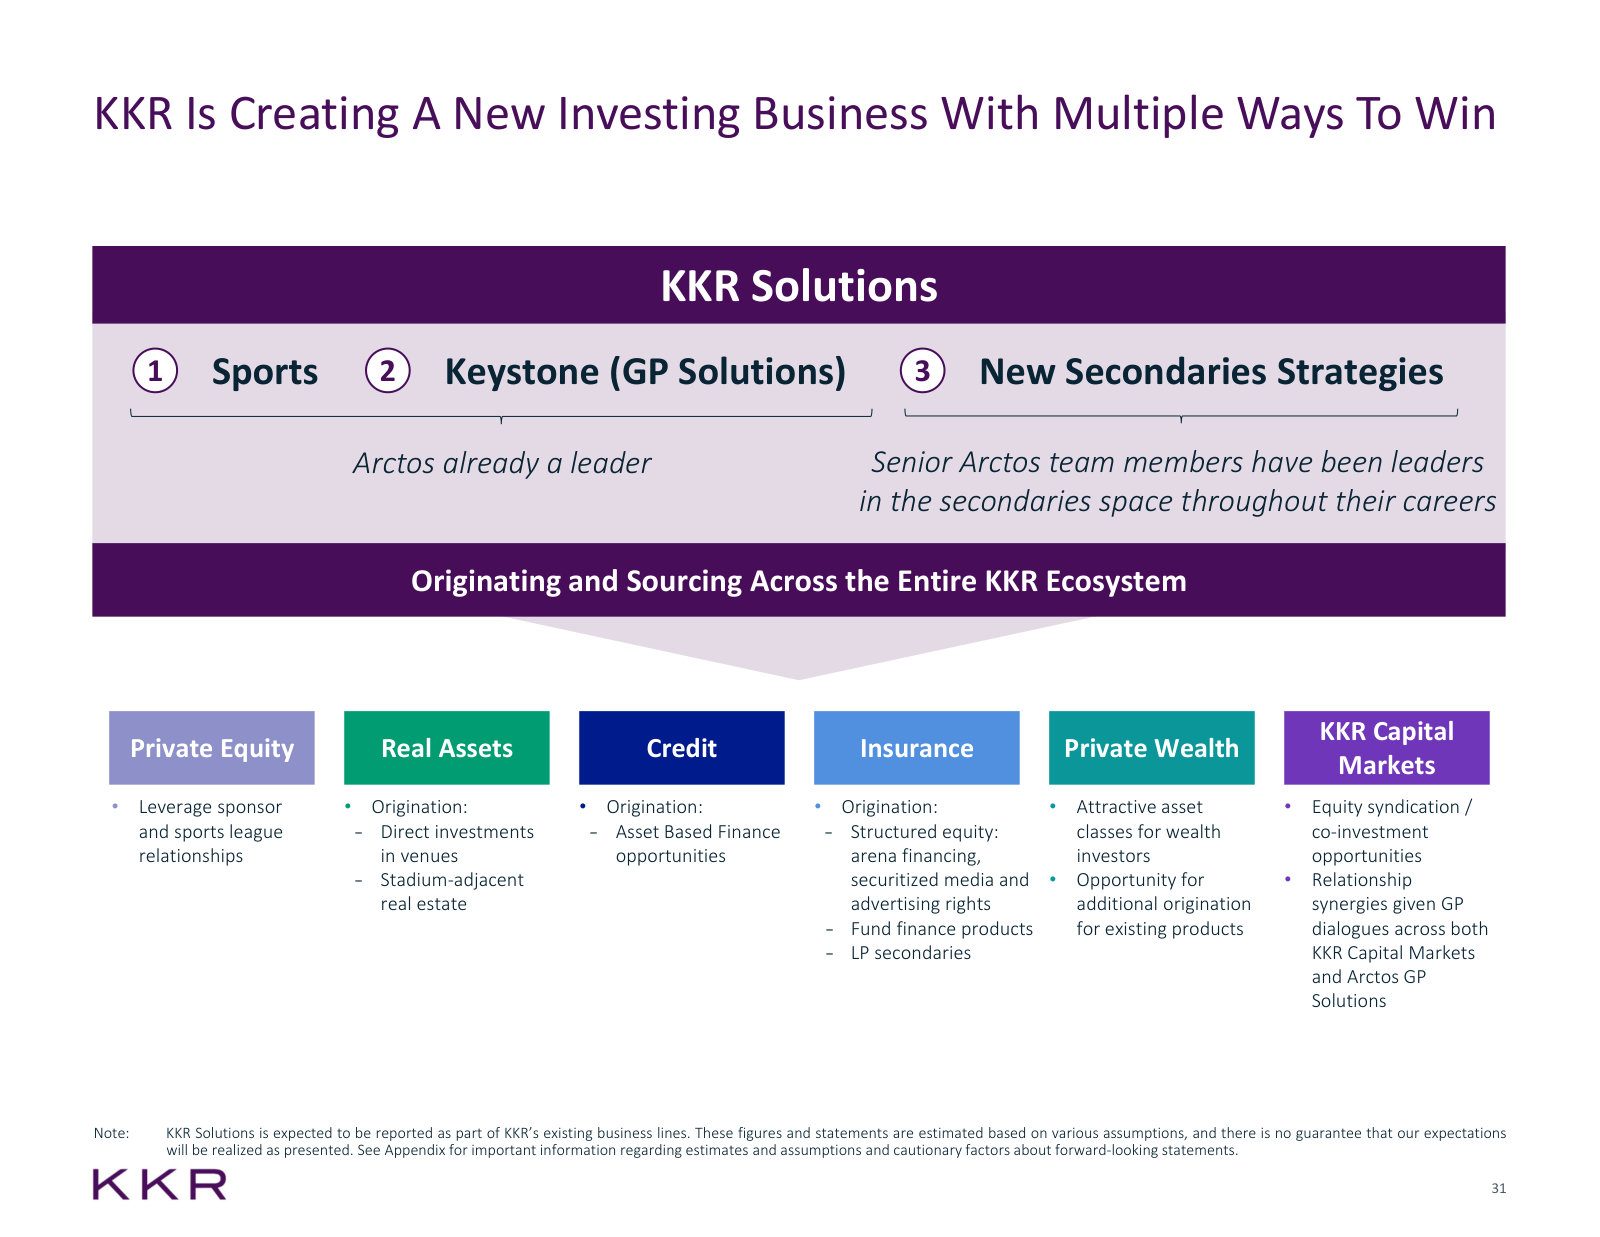
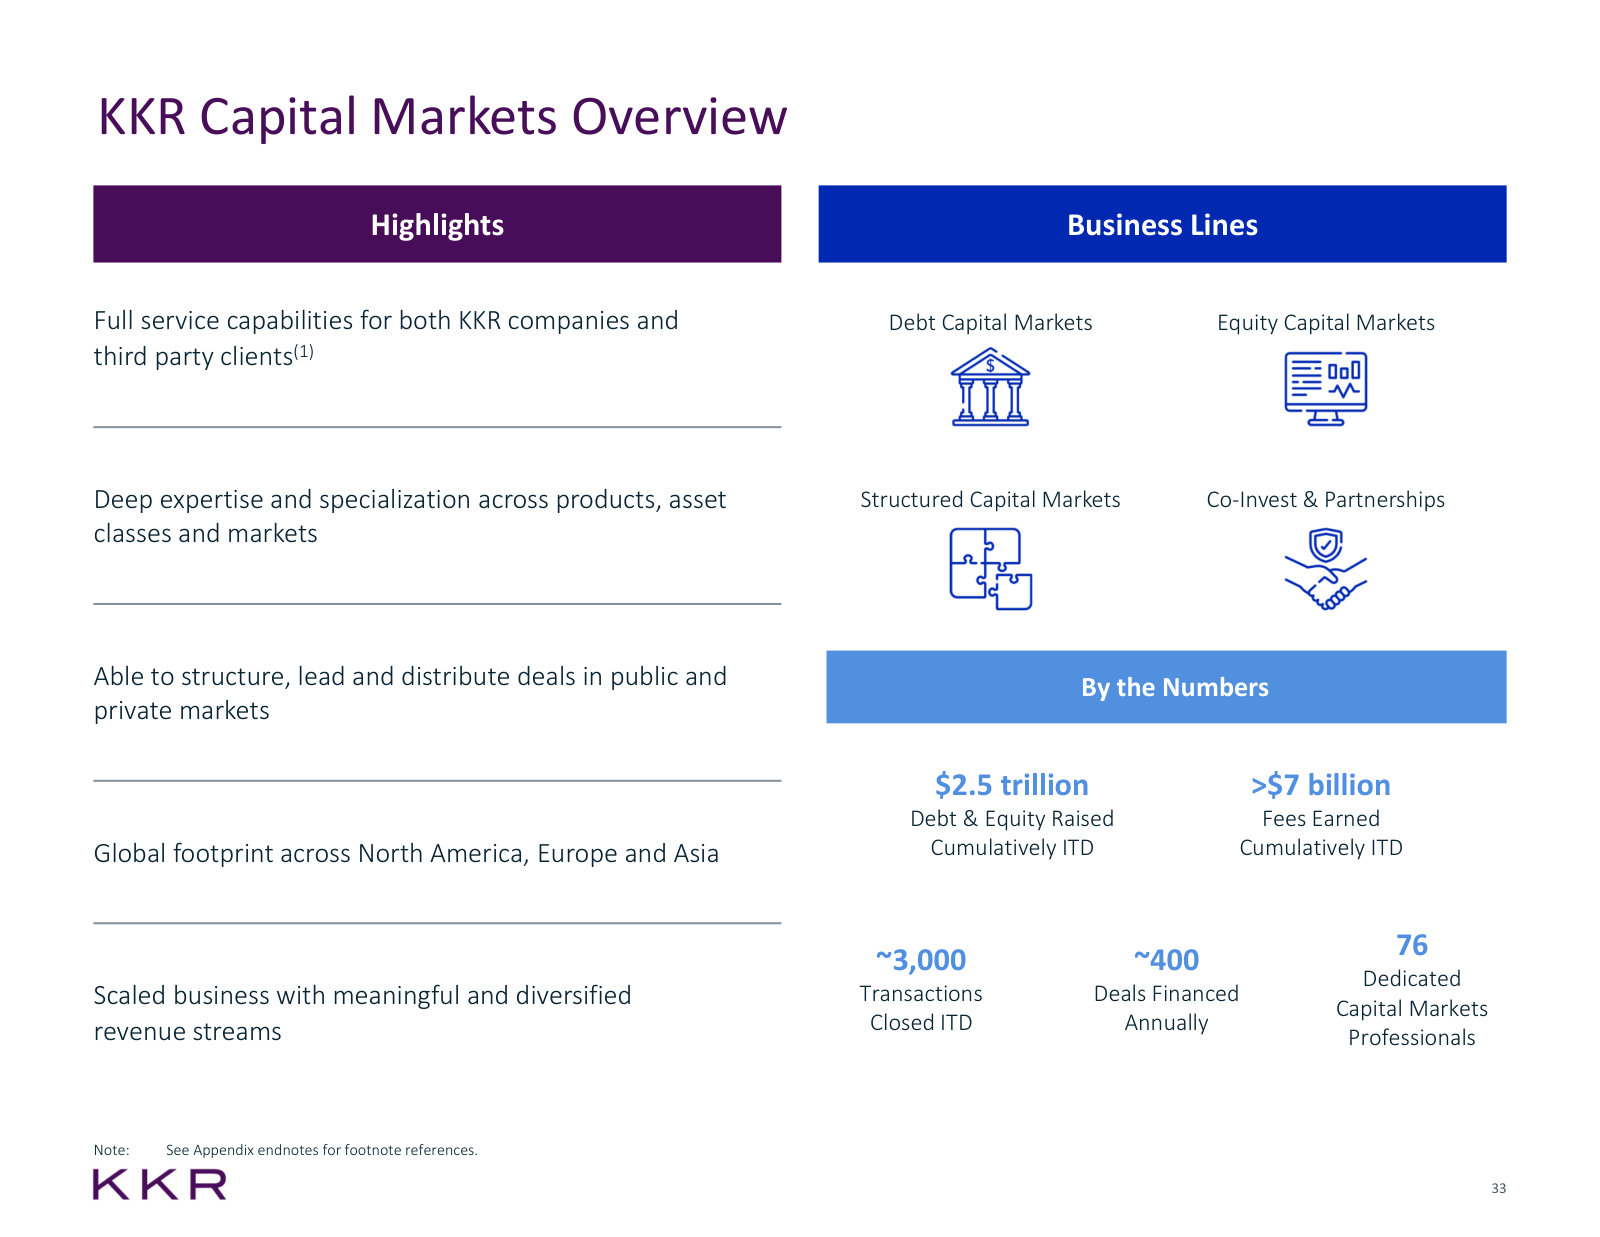
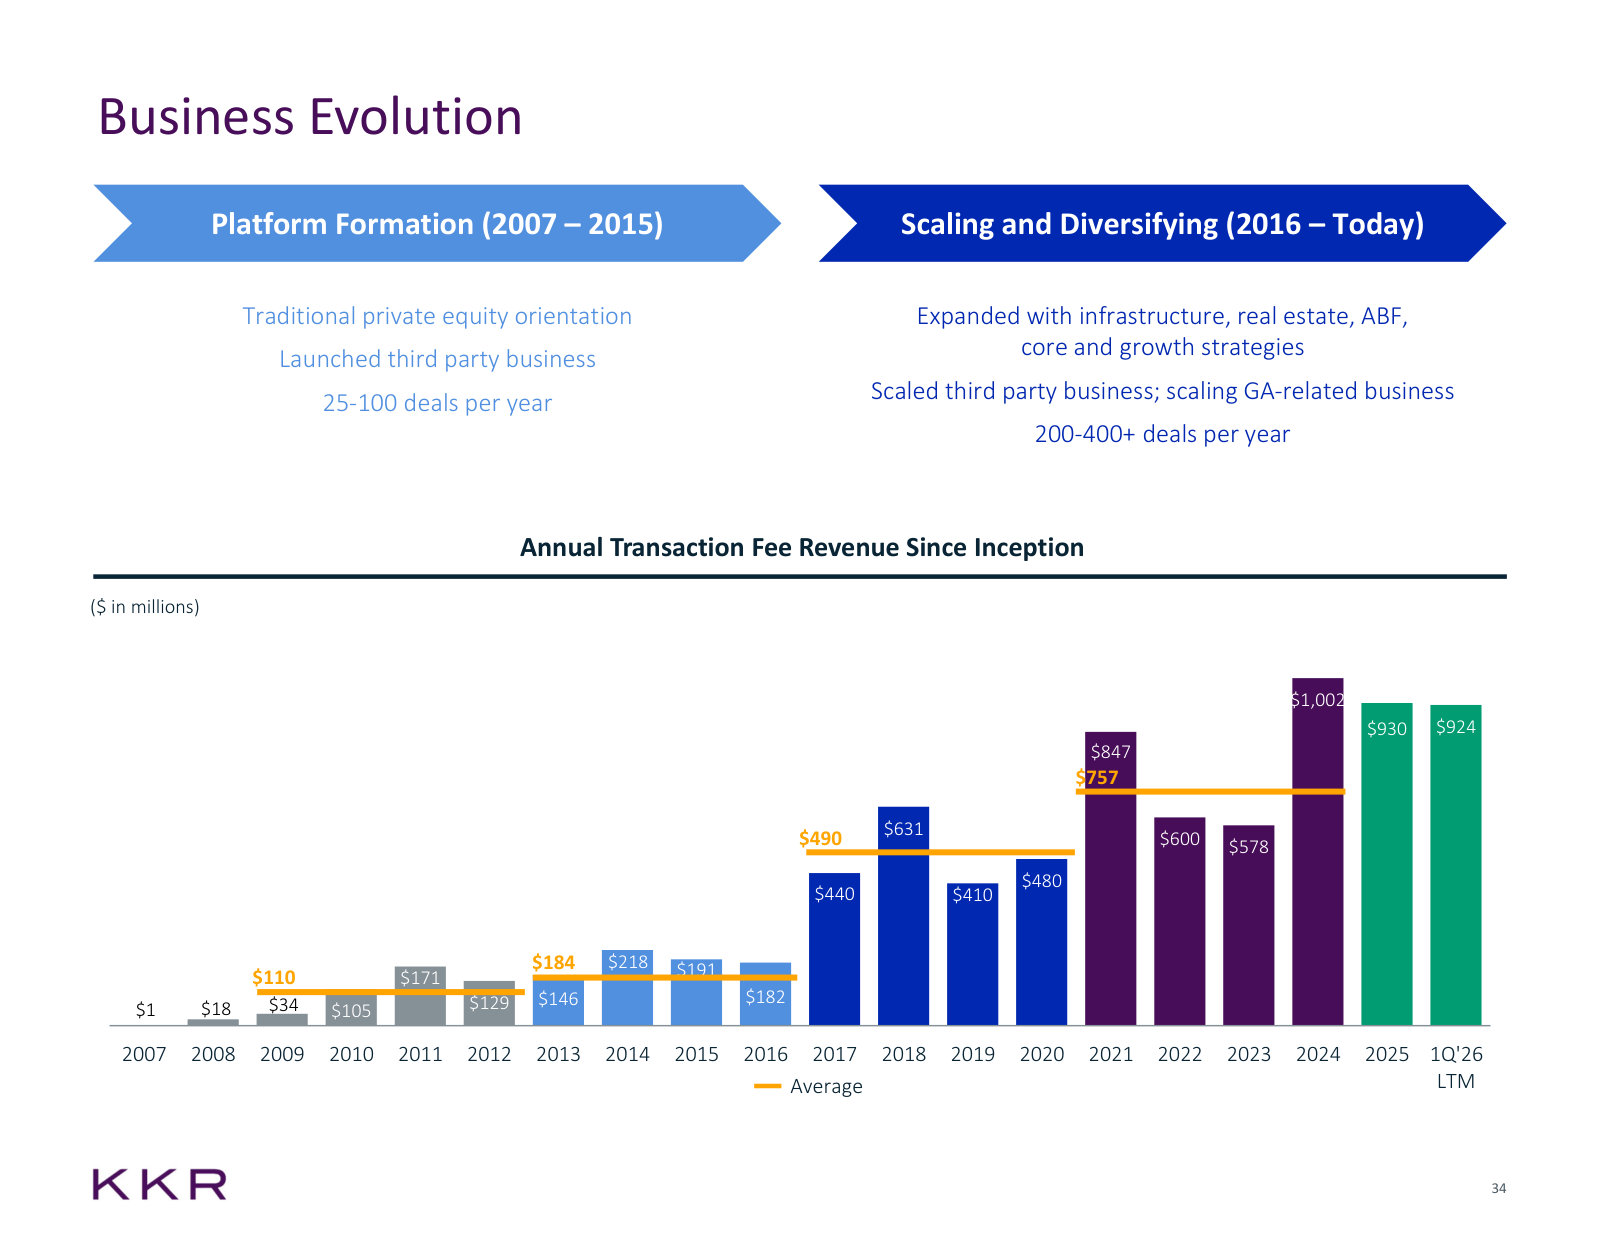
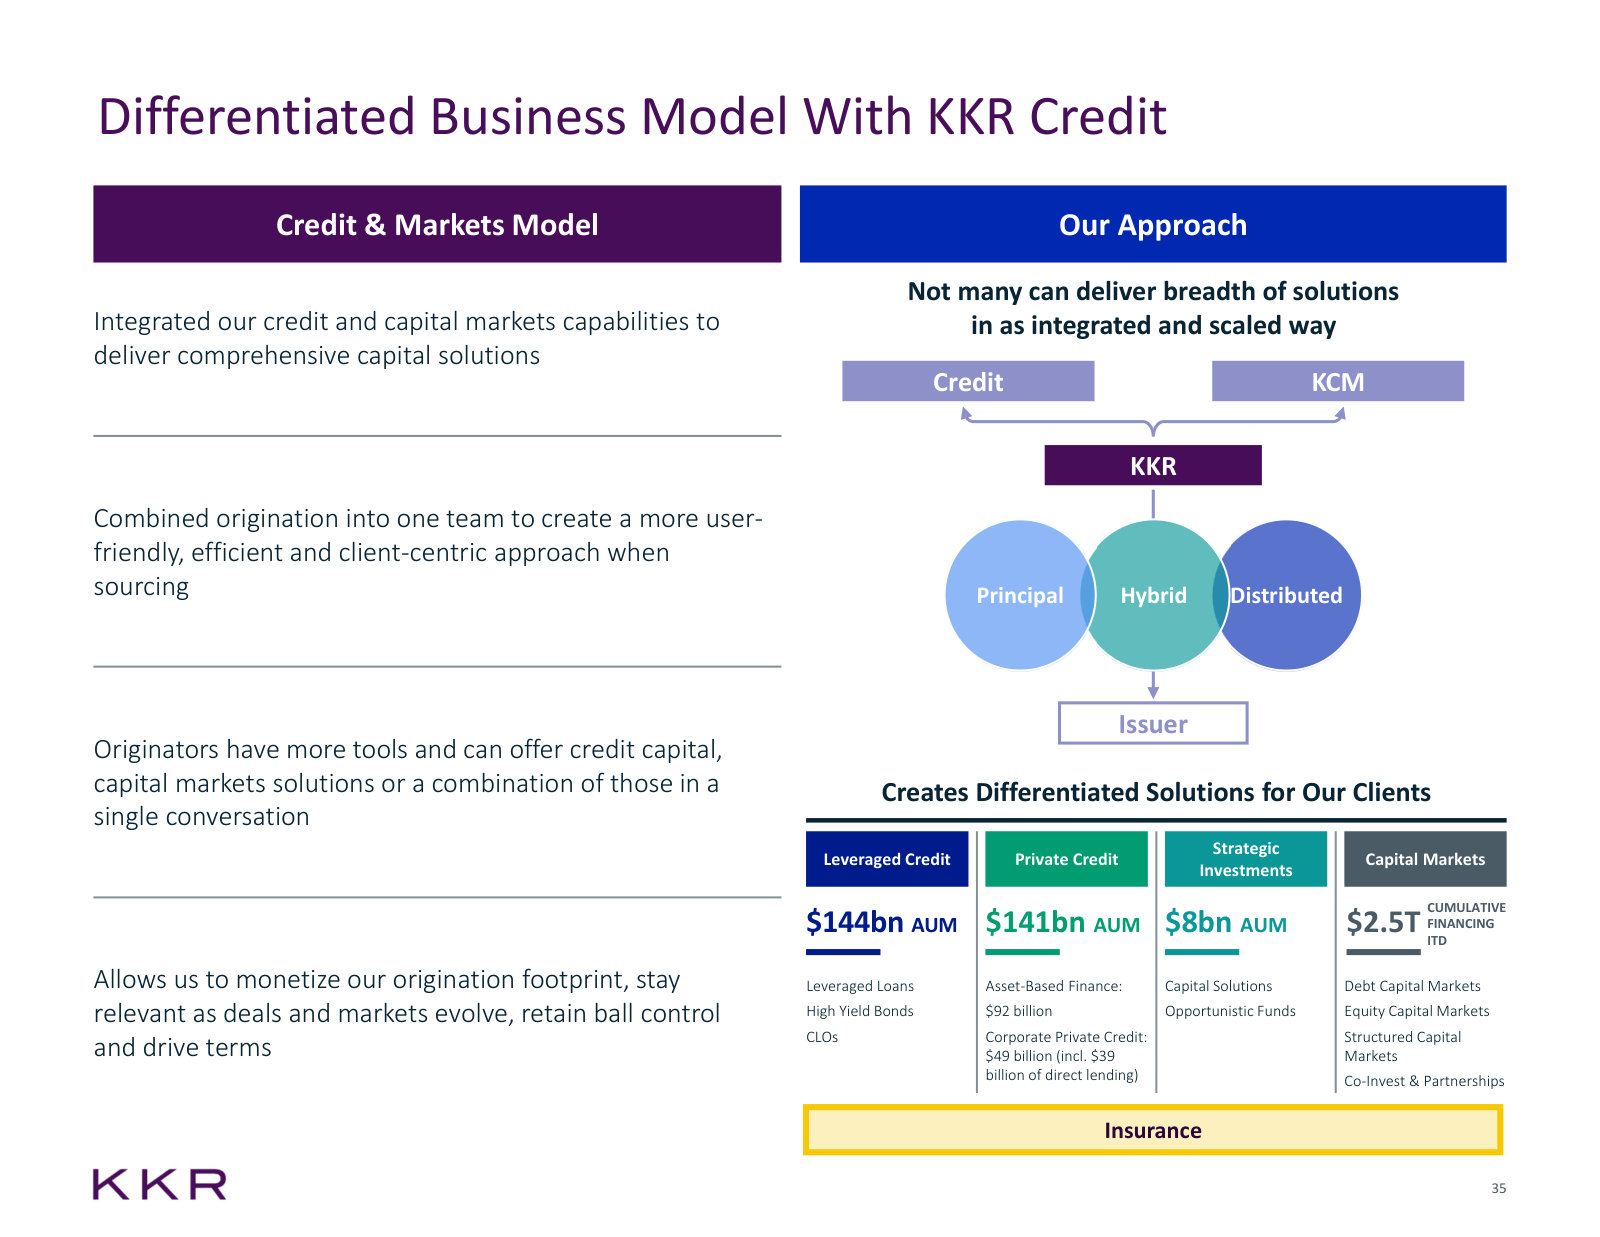
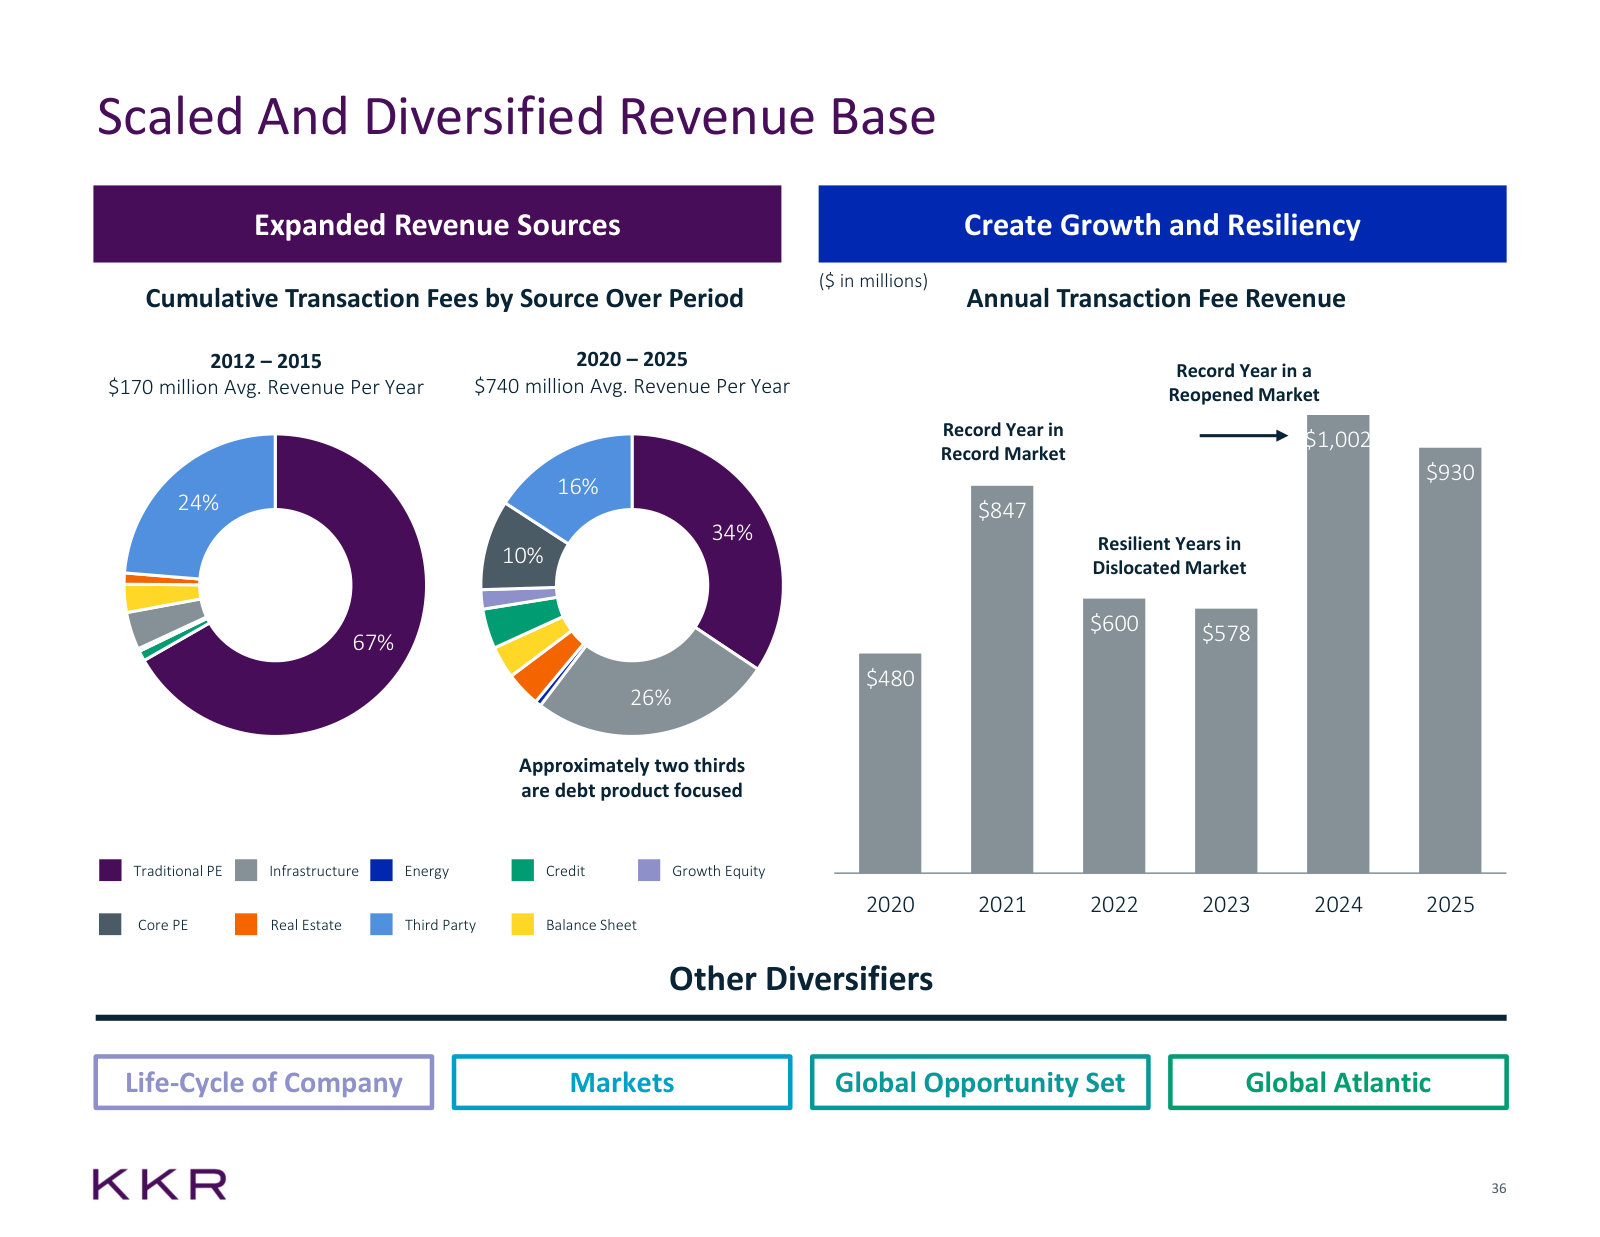
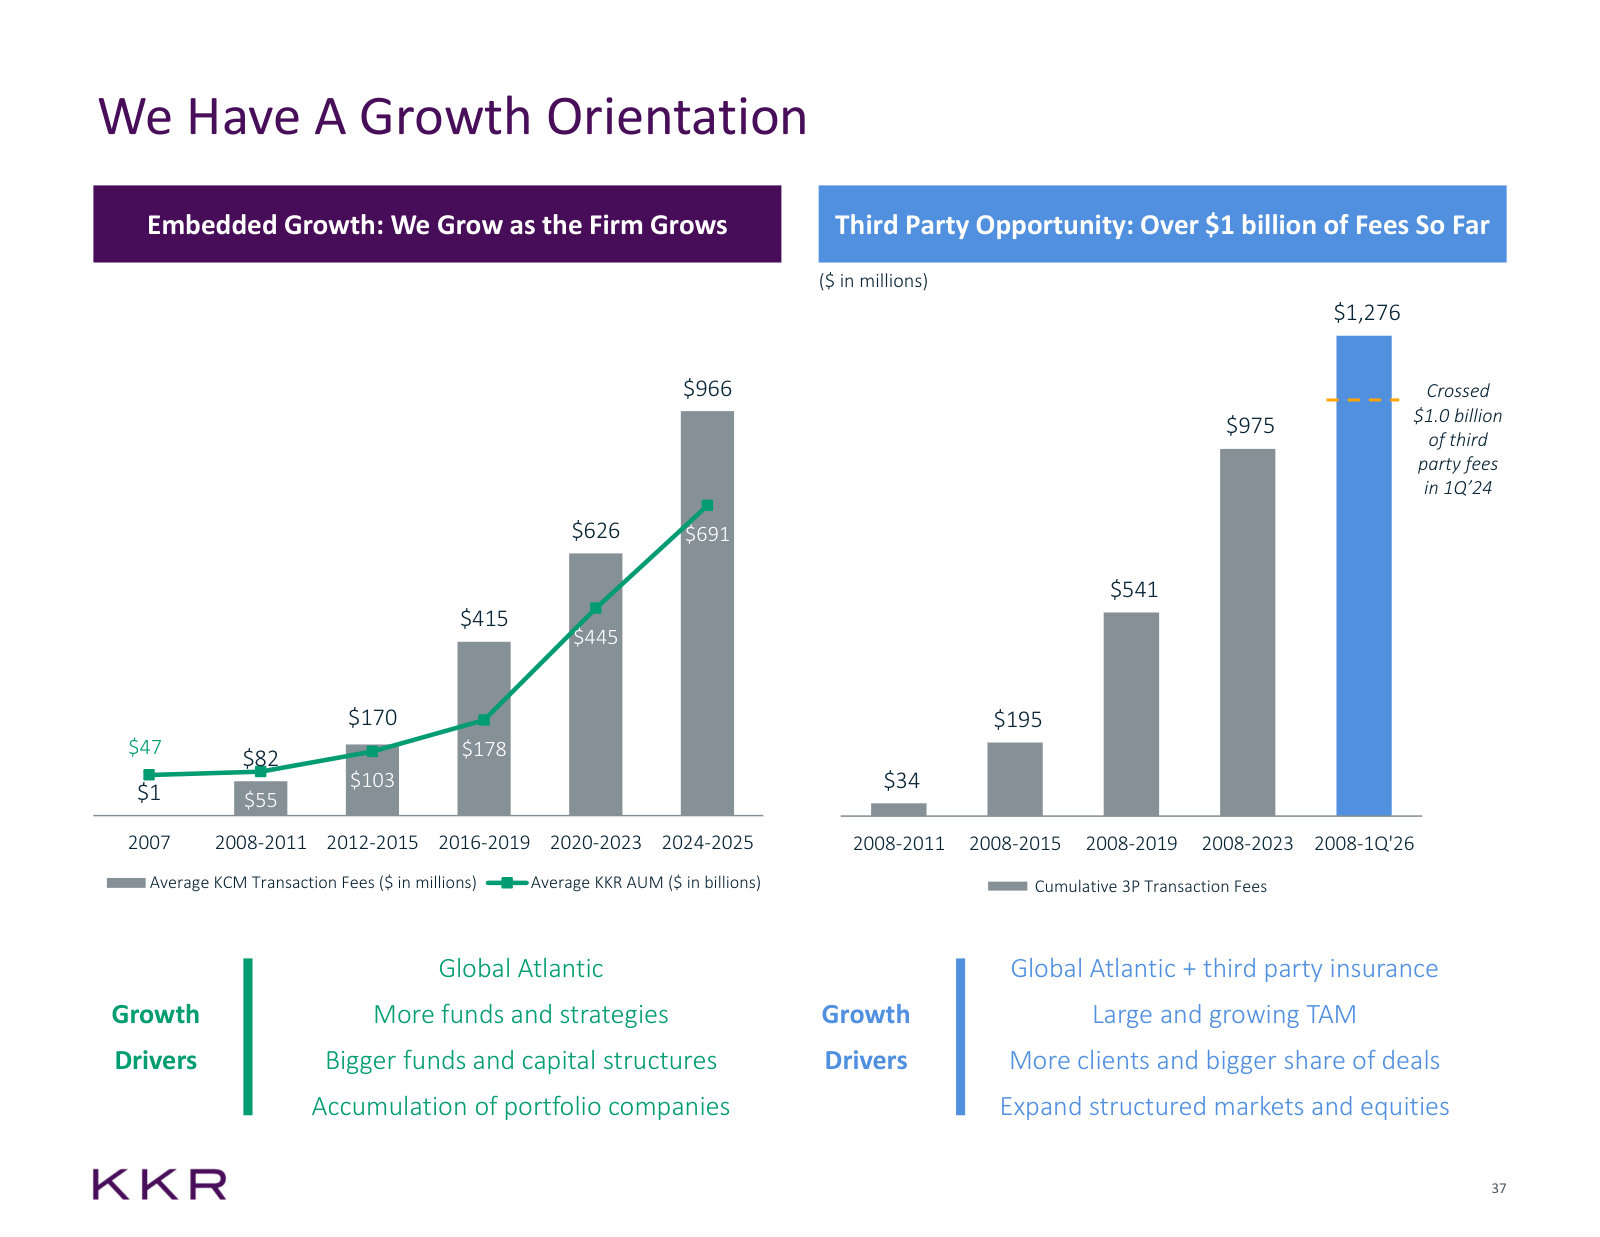
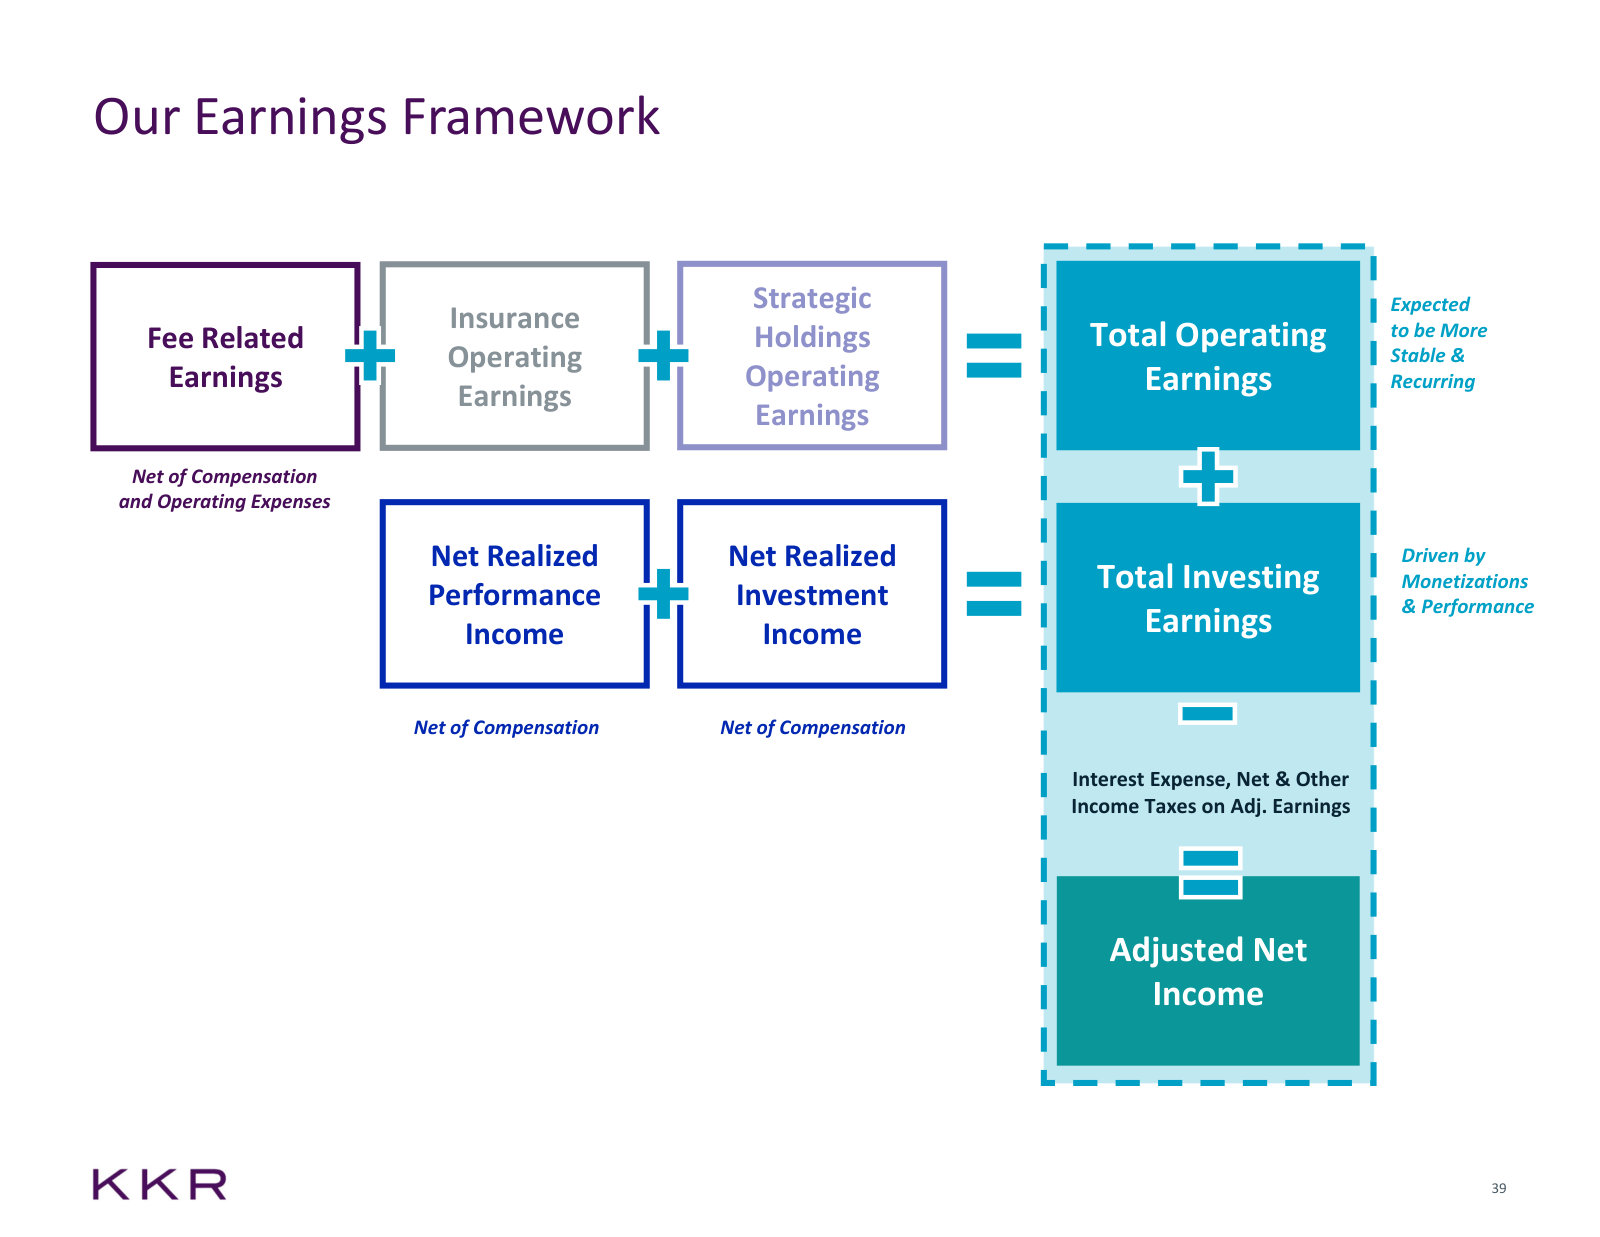
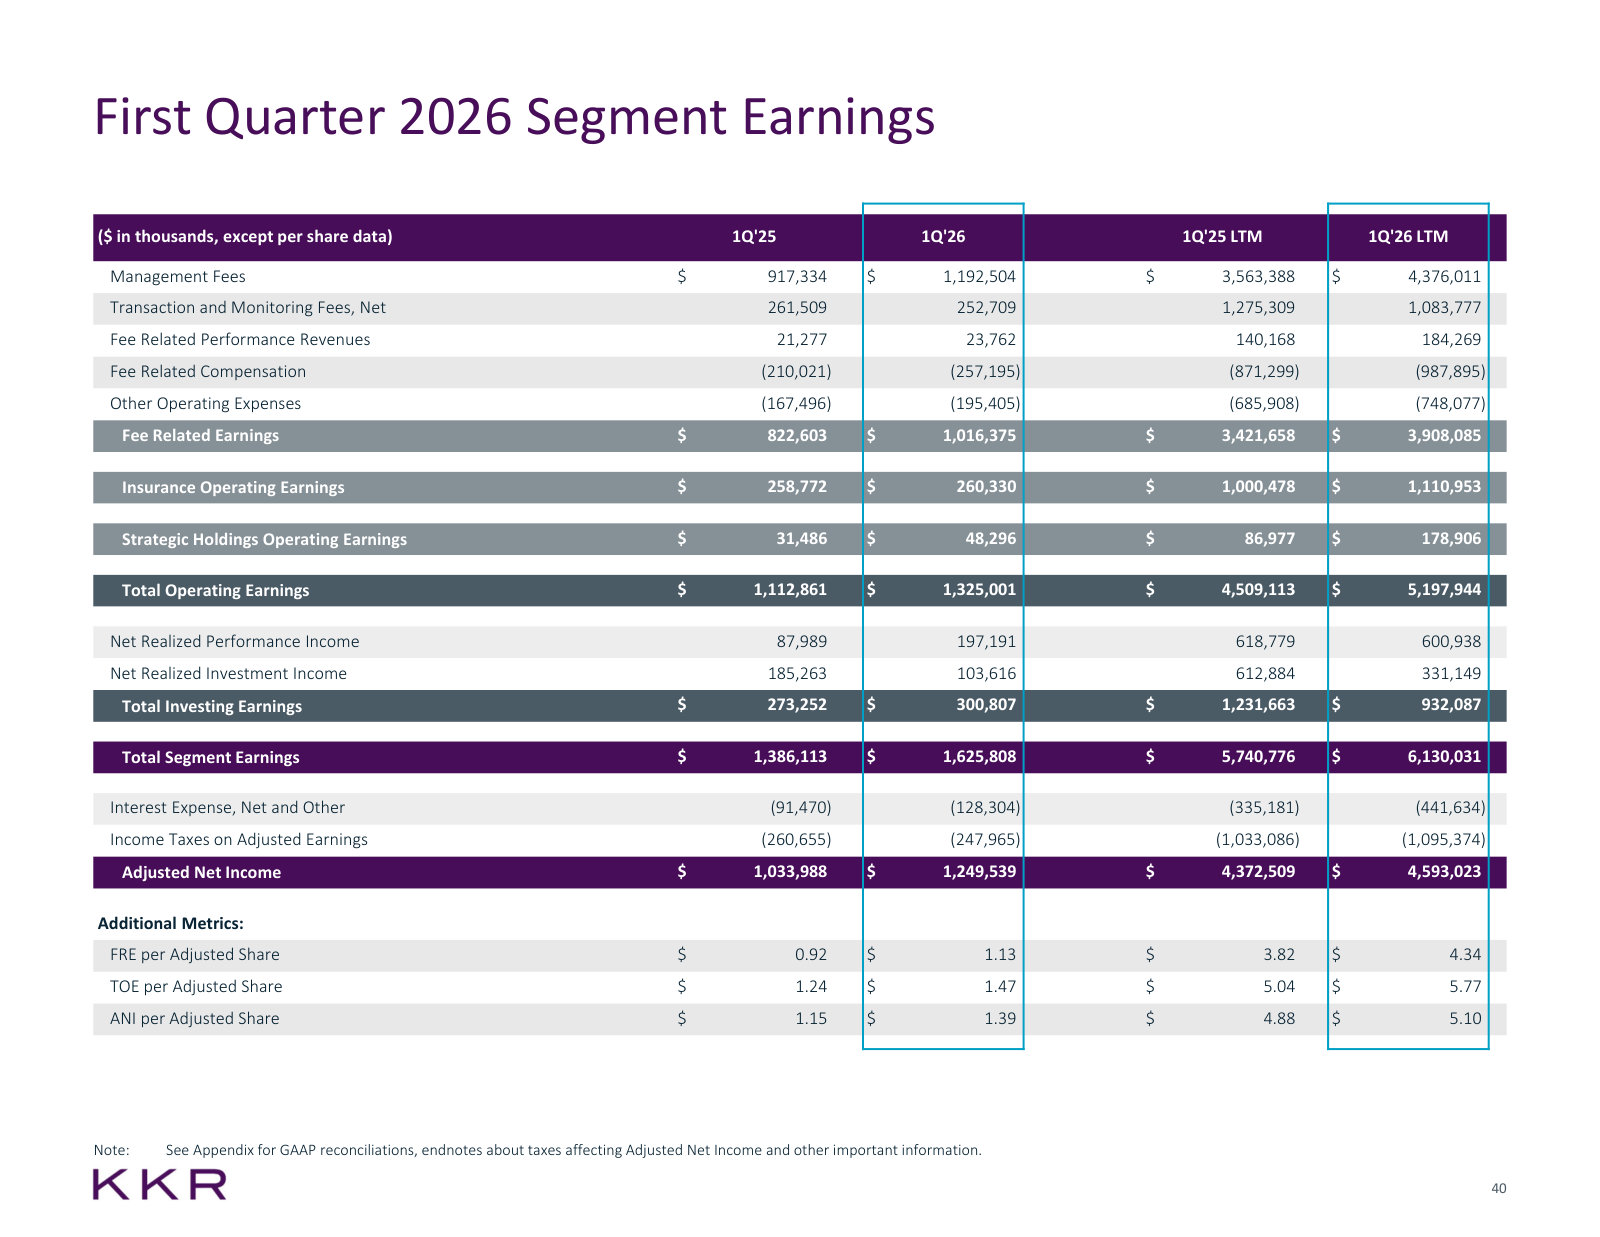
p. 3 — The firm on one page — $758bn of AUM across credit, private equity and real assets, 4,200 employees, 35 offices. · Open the full presentation →p. 4 — The equity story as management frames it: three growth engines, the markets behind each, and ~30% employee ownership. · Open the full presentation →p. 5 — Where the model came from — 2020 versus today on AUM, fees, FRE and share price, with the two segments added since. · Open the full presentation →p. 6 — The latest quarter against the prior year: management fees, FRE margin, operating earnings, AUM and embedded gains. · Open the full presentation →p. 7 — One P&L and one compensation pool — the operating structure KKR credits for cross-business collaboration. · Open the full presentation →p. 11 — AUM from $62bn in 2010 to $758bn at an 18% compound rate, with the current mix by strategy set out beside it. · Open the full presentation →p. 12 — The in-house capabilities KKR brings to deals beyond capital: capital markets, Capstone, macro, policy, client solutions. · Open the full presentation →p. 13 — Management fees by strategy since 2010. Traditional private equity is now a minority of a 26%-CAGR fee base. · Open the full presentation →p. 14 — Every strategy placed on a maturity scale from early platform to scaled — the clearest map of the product shelf. · Open the full presentation →p. 15 — The same map with the point made: over half of AUM and 80%+ of strategies have not yet reached scale. · Open the full presentation →p. 16 — Capital raised over the last twelve months, and the ~30 strategies in market including three flagships. · Open the full presentation →p. 17 — The four routes into private wealth, K-Series AUM roughly doubling year on year, and the Capital Group partnership. · Open the full presentation →p. 18 — How much of KKR is actually direct lending — $39bn of $758bn, with the whole credit stack broken out alongside. · Open the full presentation →p. 19 — Gross return versus benchmark for each private credit and ABF vintage: the record behind the credit franchise. · Open the full presentation →p. 21 — Global Atlantic in summary — $220bn of AUM, ratings, earnings, and how KKR came to own all of it. · Open the full presentation →p. 22 — The two sides of the insurance business: retail annuities through 200+ distributors, and reinsurance for other carriers. · Open the full presentation →p. 23 — Management's stated path to doubling Global Atlantic's assets, set out in four labelled steps. · Open the full presentation →p. 24 — The insurance flywheel quantified — KKR doubles GA originations, GA multiplies KKR credit AUM, third-party capital follows. · Open the full presentation →p. 25 — What insurance actually earns: Global Atlantic AUM alongside the four components of total insurance economics. · Open the full presentation →p. 27 — What sits in Strategic Holdings — the traits of a Core PE business and the industry mix of the portfolio. · Open the full presentation →p. 29 — The Arctos deal: $1.4bn initial consideration for a sports and GP-solutions manager, with the structure spelled out. · Open the full presentation →p. 30 — The six tests KKR applies to acquisitions and how Arctos scores on each — a window into its M&A discipline. · Open the full presentation →p. 31 — How Arctos plugs into the rest of KKR: sports, GP solutions and secondaries sourced across the whole platform. · Open the full presentation →p. 33 — KKR Capital Markets by the numbers — $2.5tn raised, ~400 deals a year, 76 people in the in-house underwriting arm. · Open the full presentation →p. 34 — Capital markets transaction fees every year since 2007, and the two phases management uses to explain the ramp. · Open the full presentation →p. 35 — How credit and capital markets were merged into a single origination team, and what each piece contributes. · Open the full presentation →p. 36 — Transaction fee mix then and now, plus the annual revenue line through a dislocated and then reopened market. · Open the full presentation →p. 37 — Why capital markets fees grow as the firm grows, and the third-party business now past $1bn of cumulative fees. · Open the full presentation →p. 39 — The earnings framework — how FRE, insurance and Strategic Holdings roll into operating earnings and Adjusted Net Income. · Open the full presentation →p. 40 — The same framework filled in with actual quarterly and trailing-twelve-month numbers, including per-share figures. · Open the full presentation →
KKR's most recent investor day — 302 pages of segment-by-segment detail and the medium-term targets management set for itself. · Open the full document →
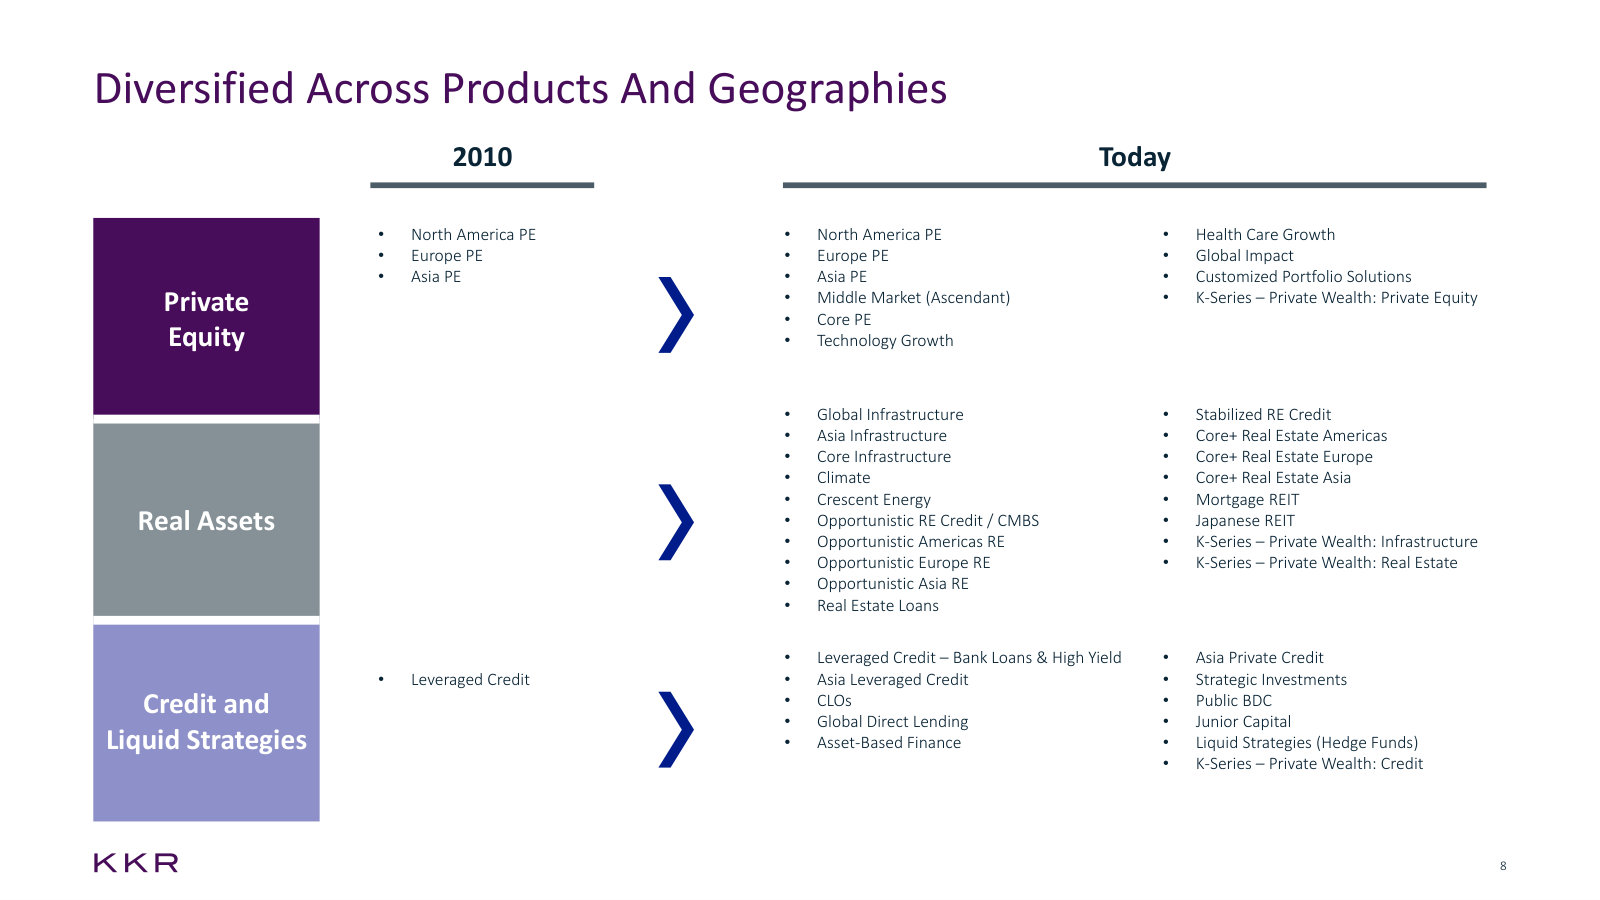
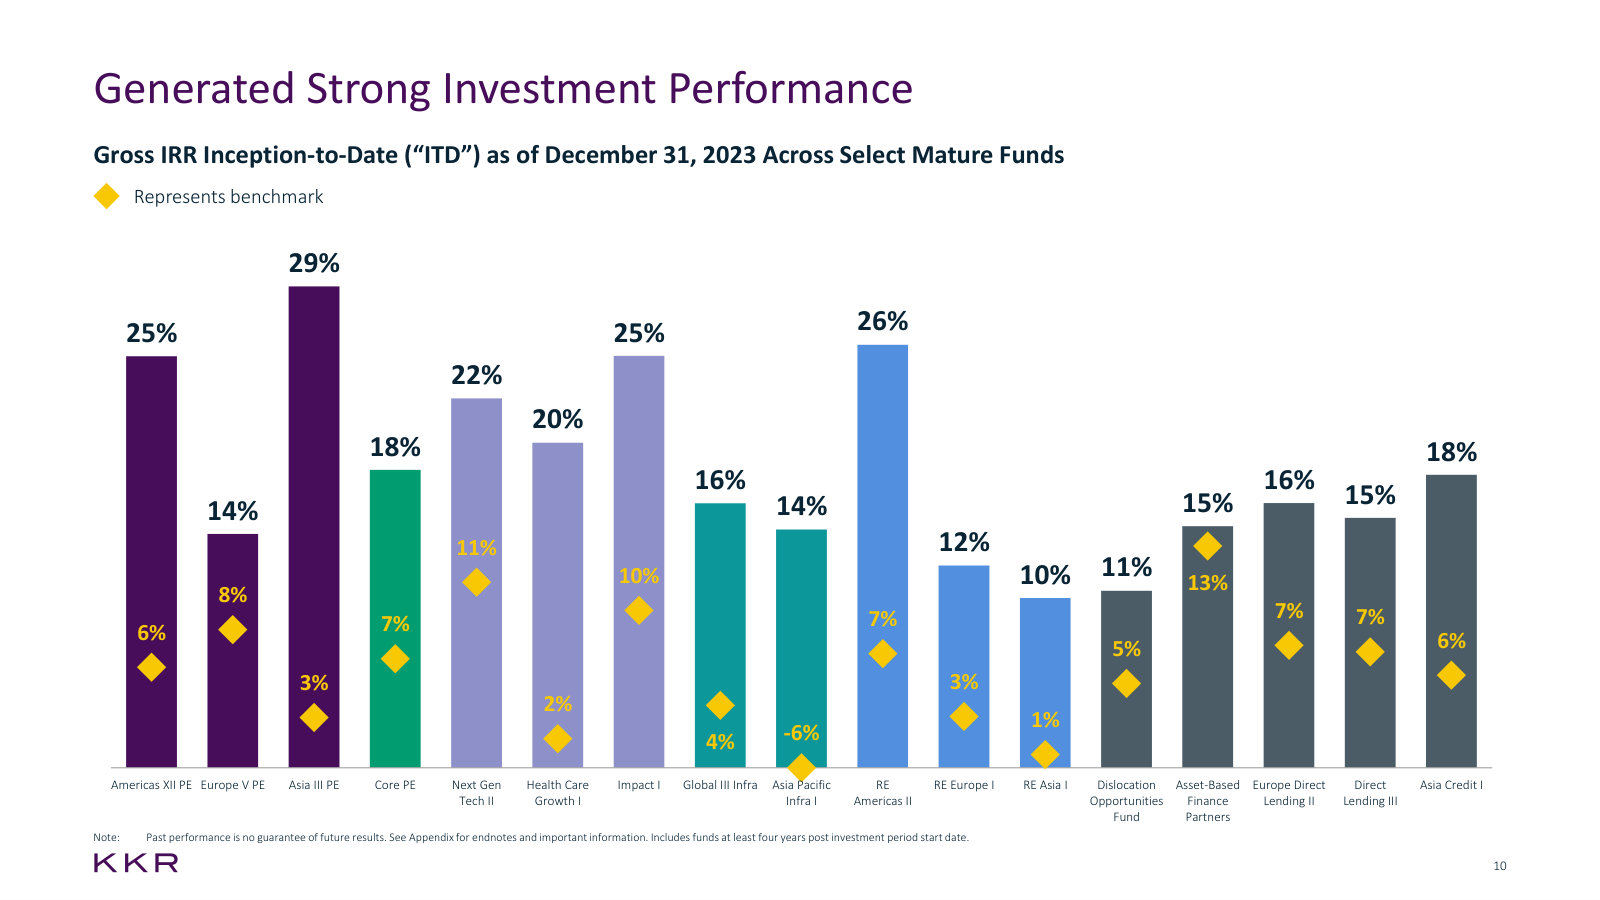
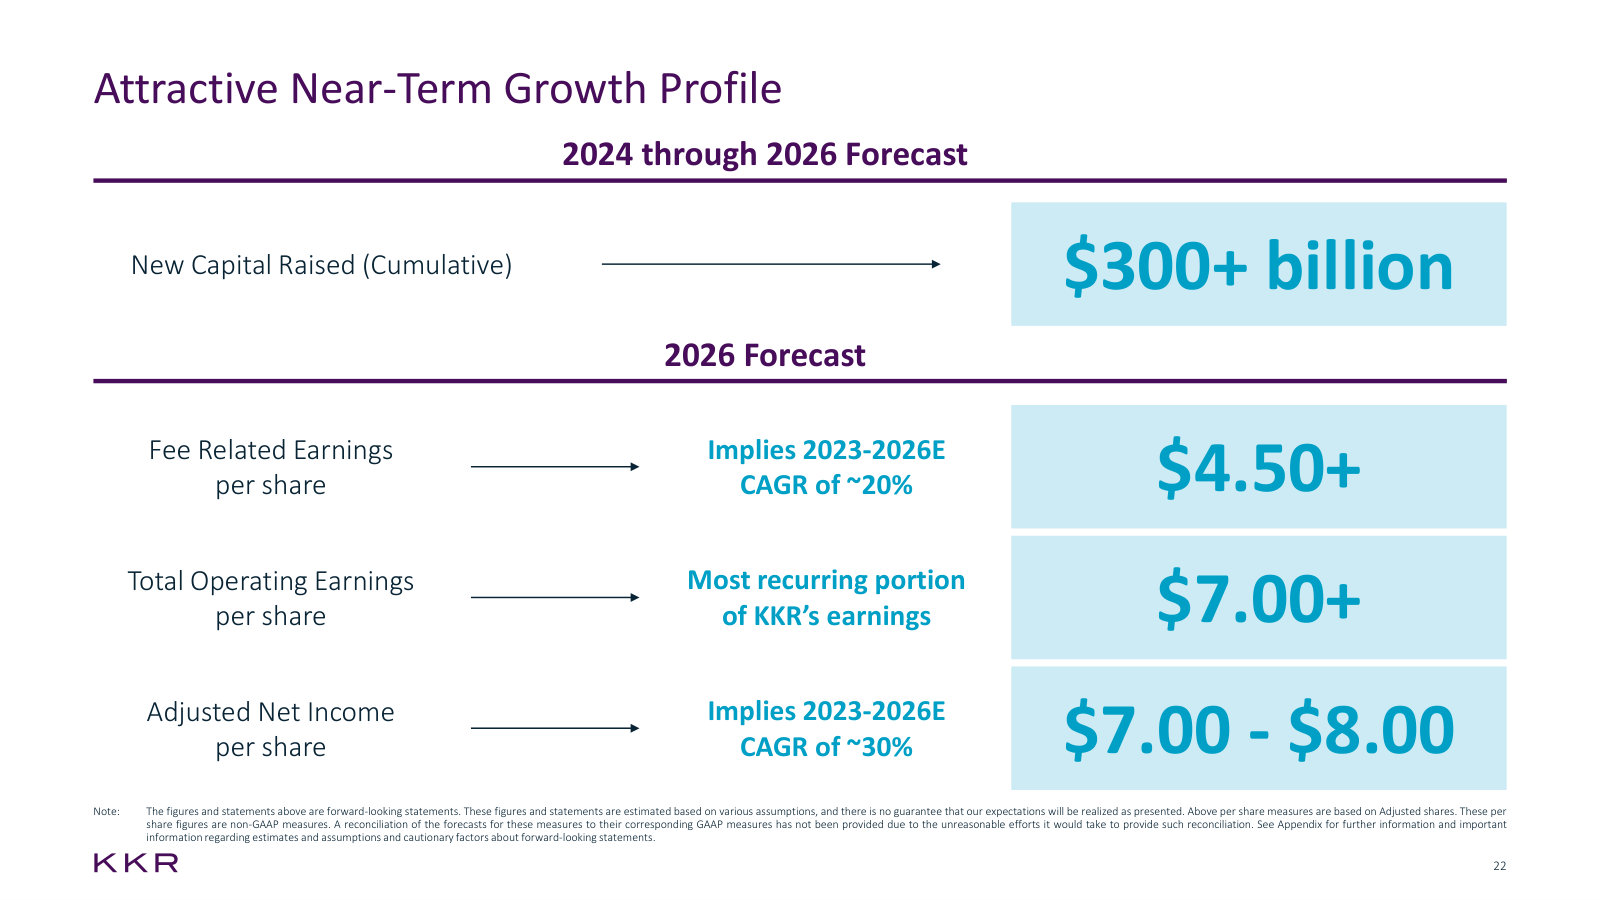
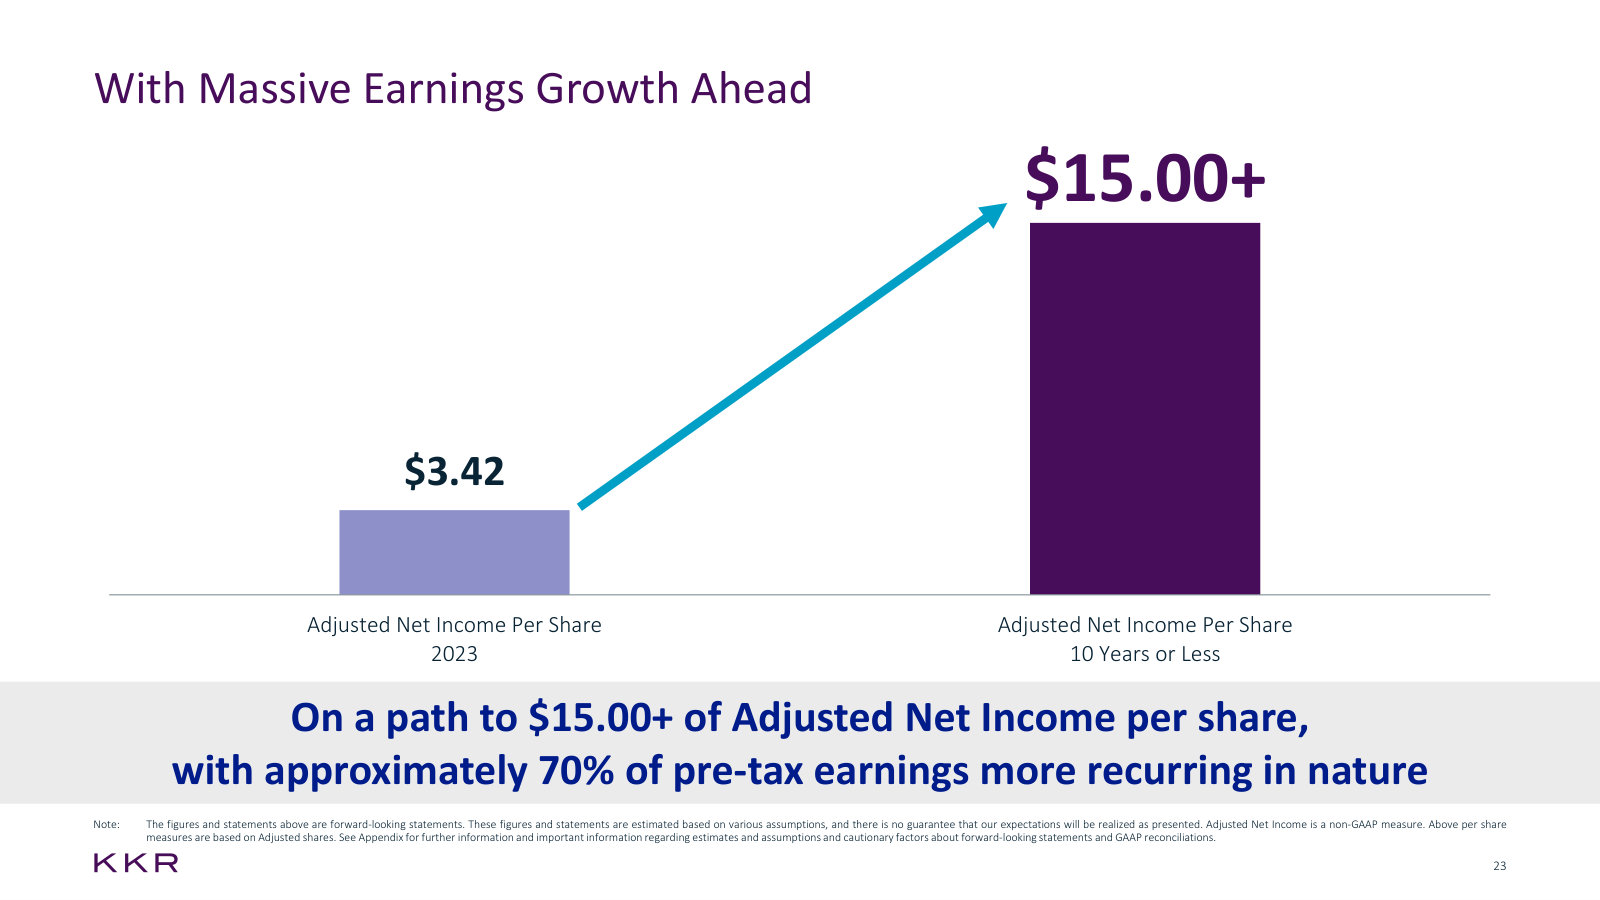
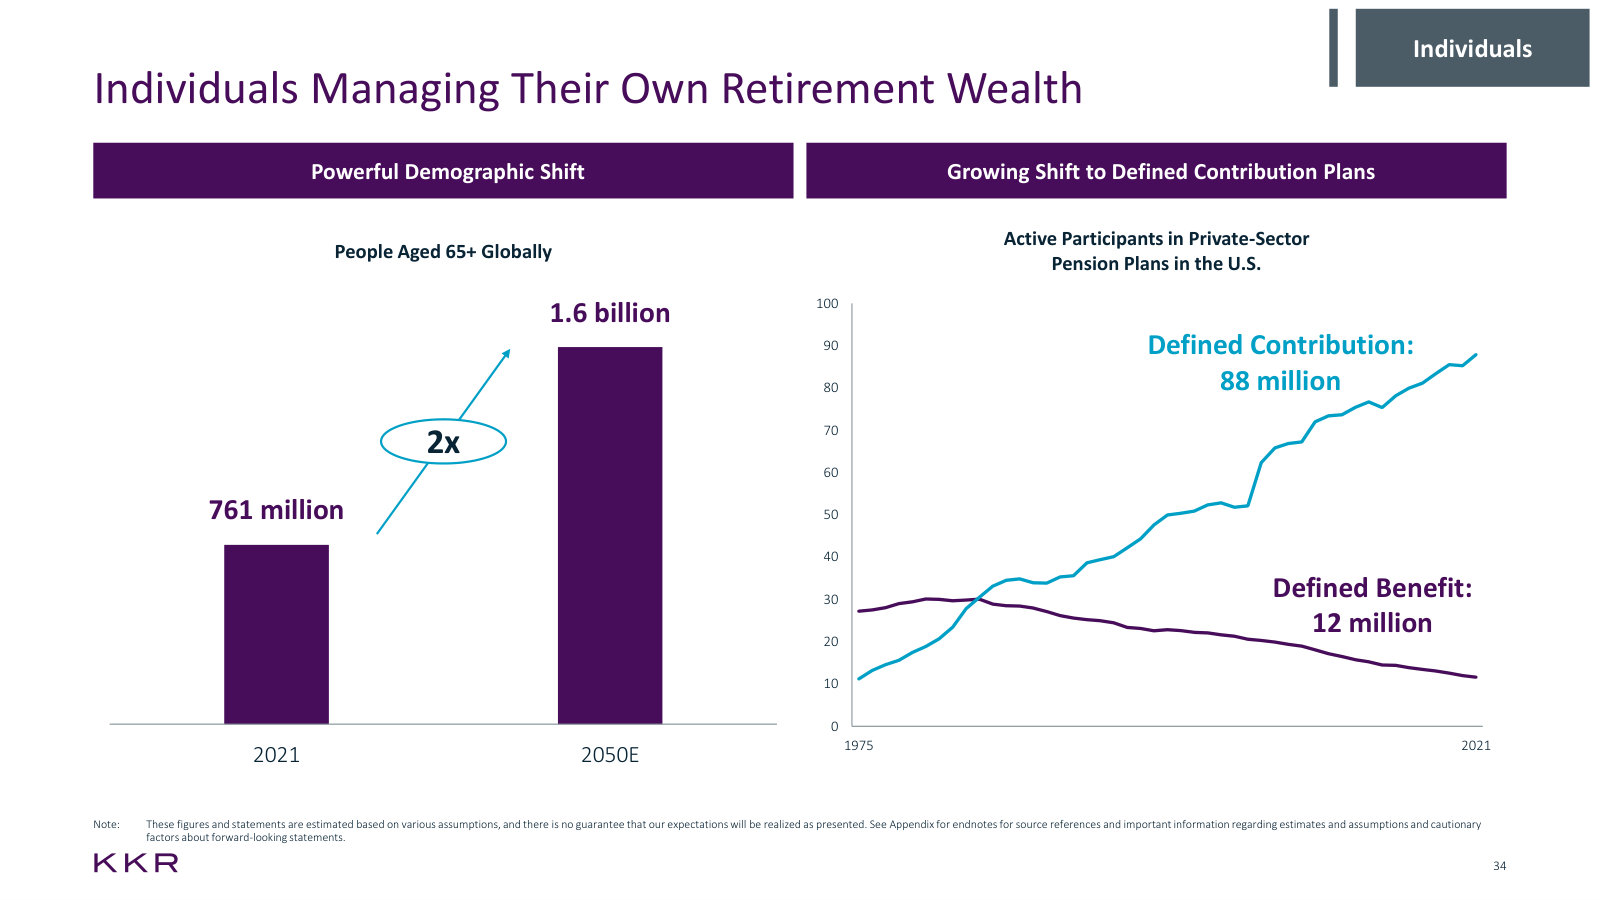
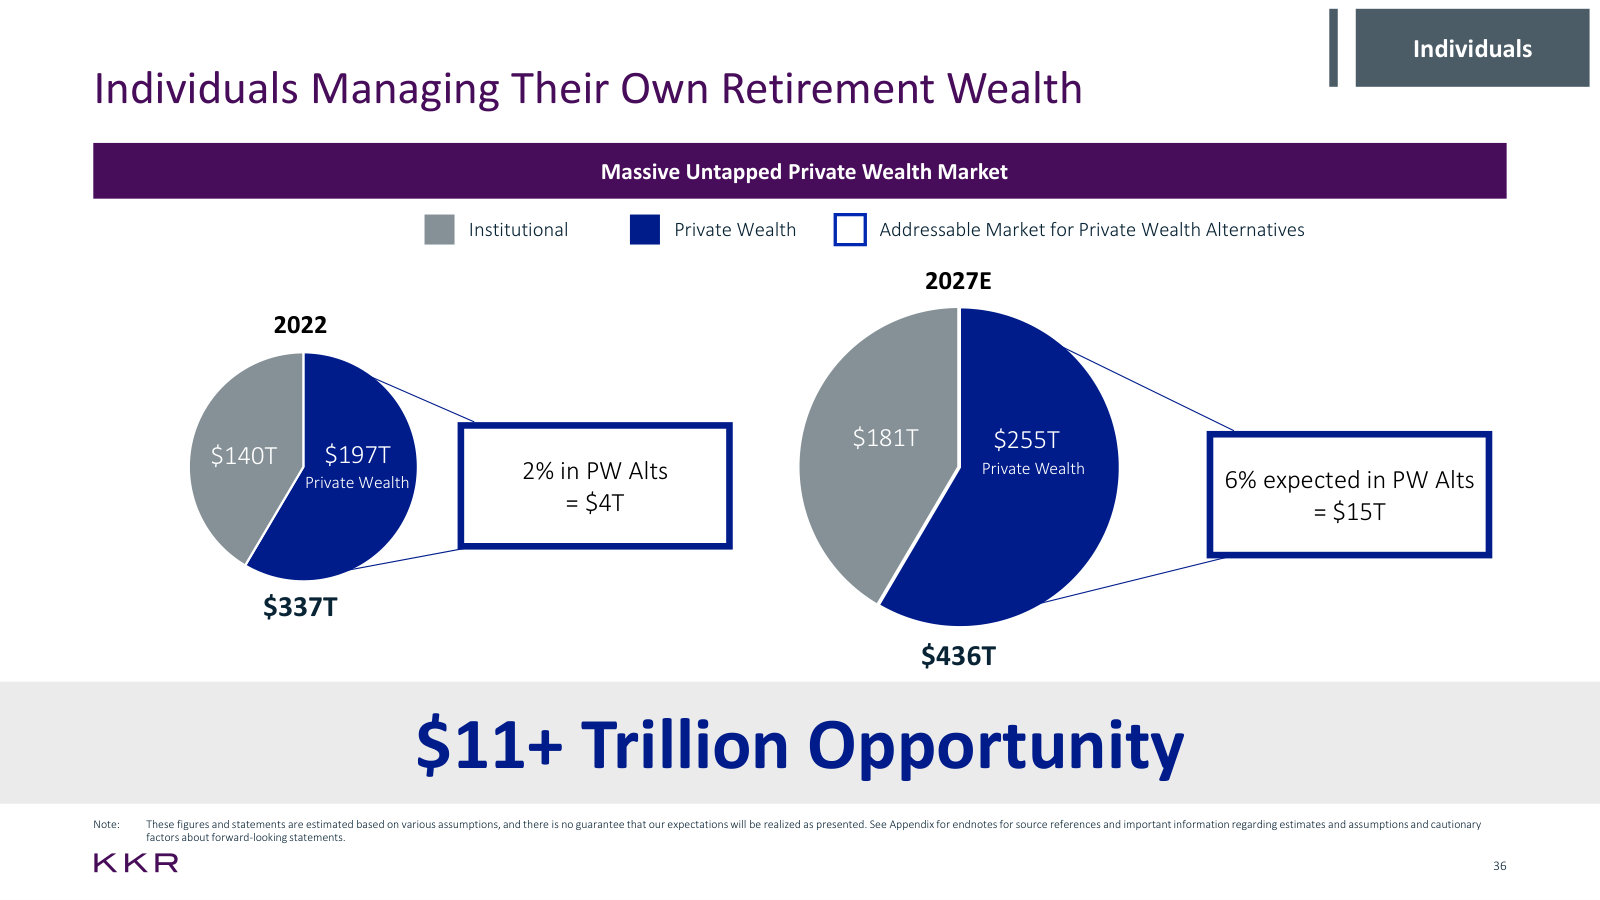
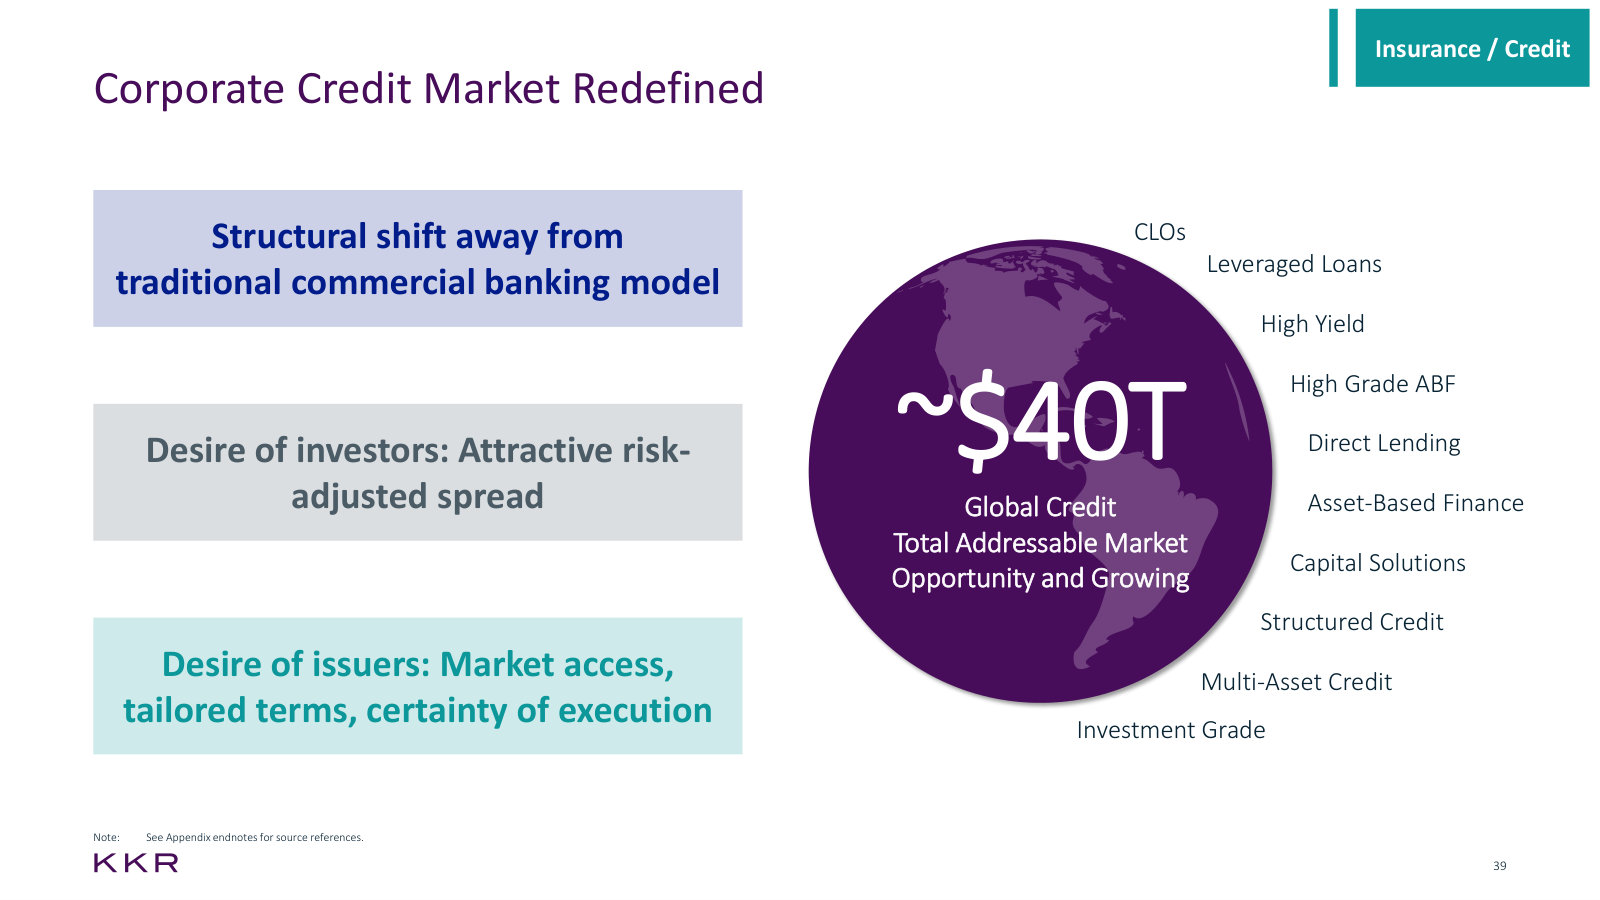
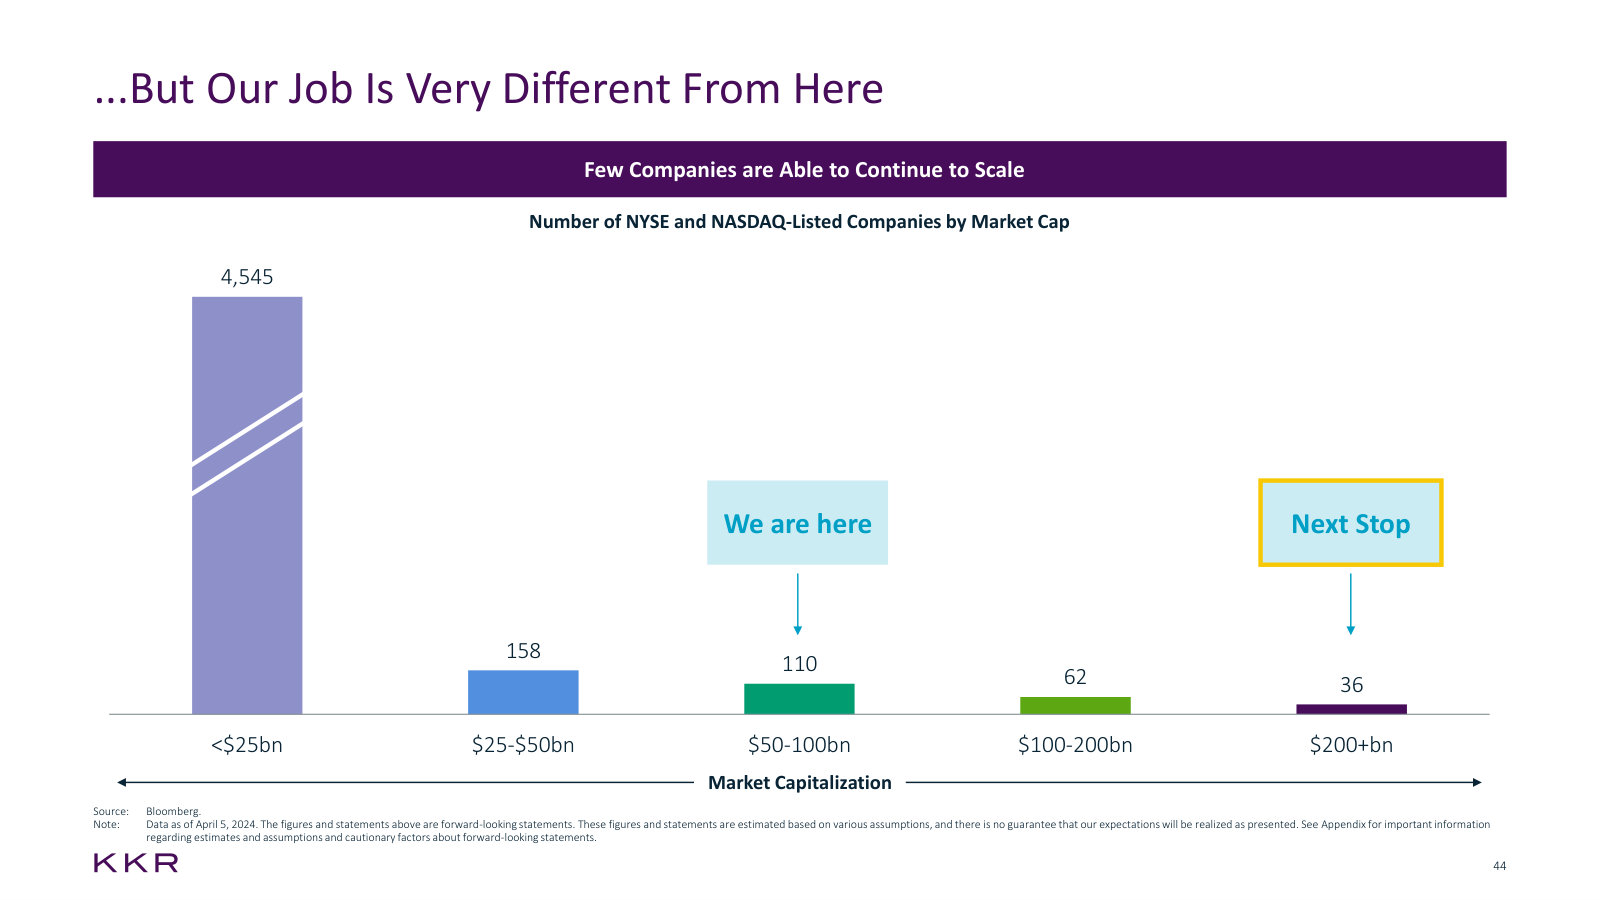
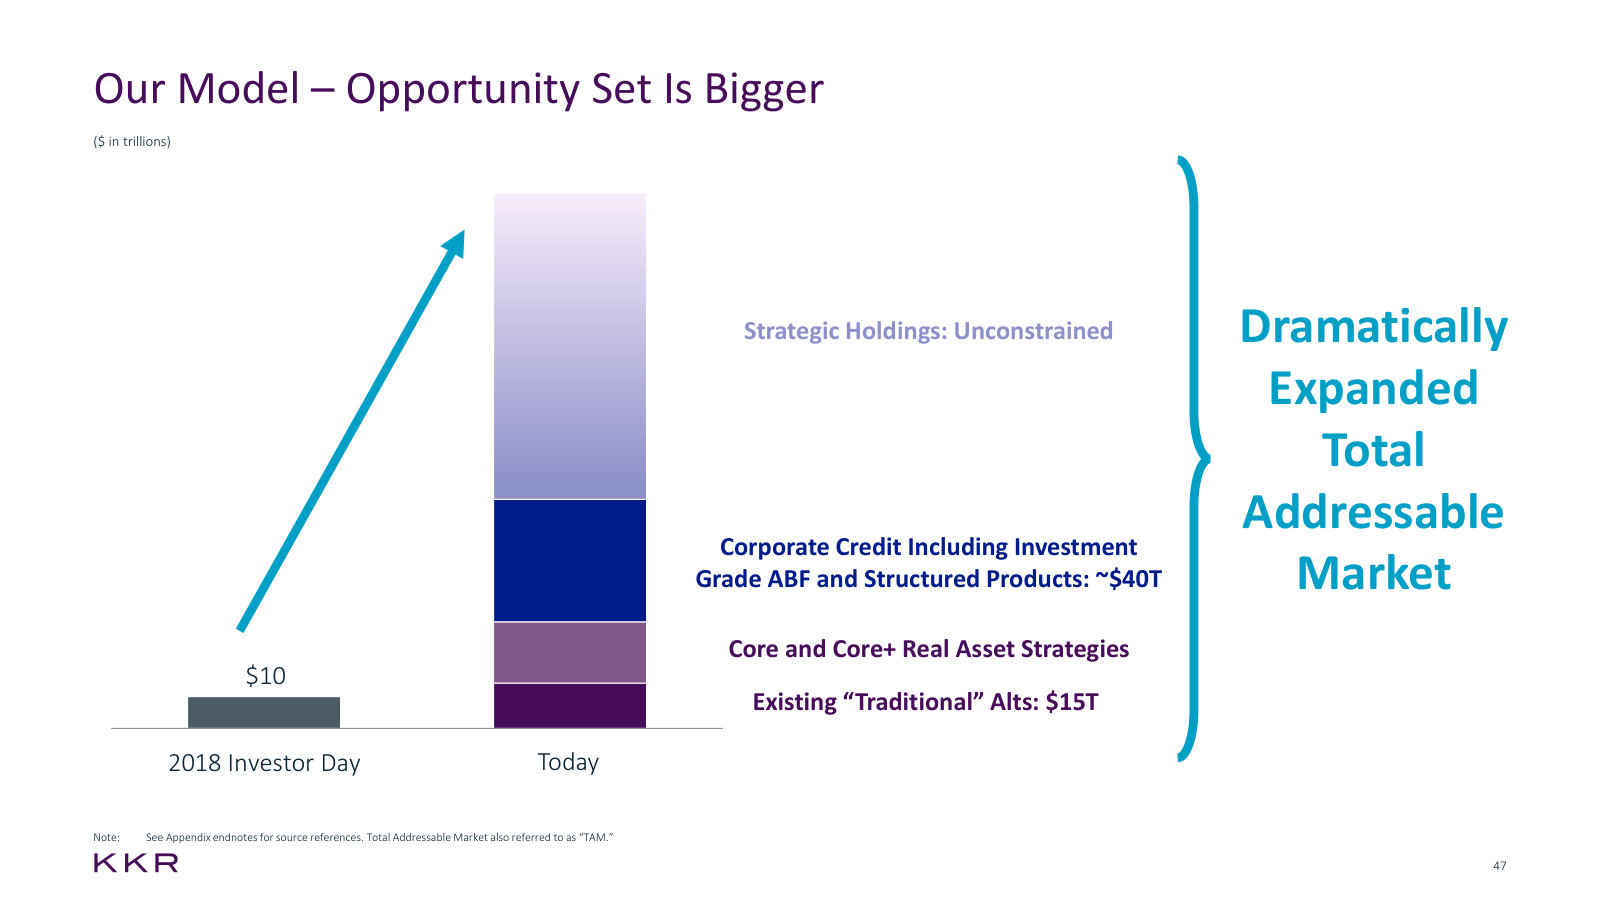
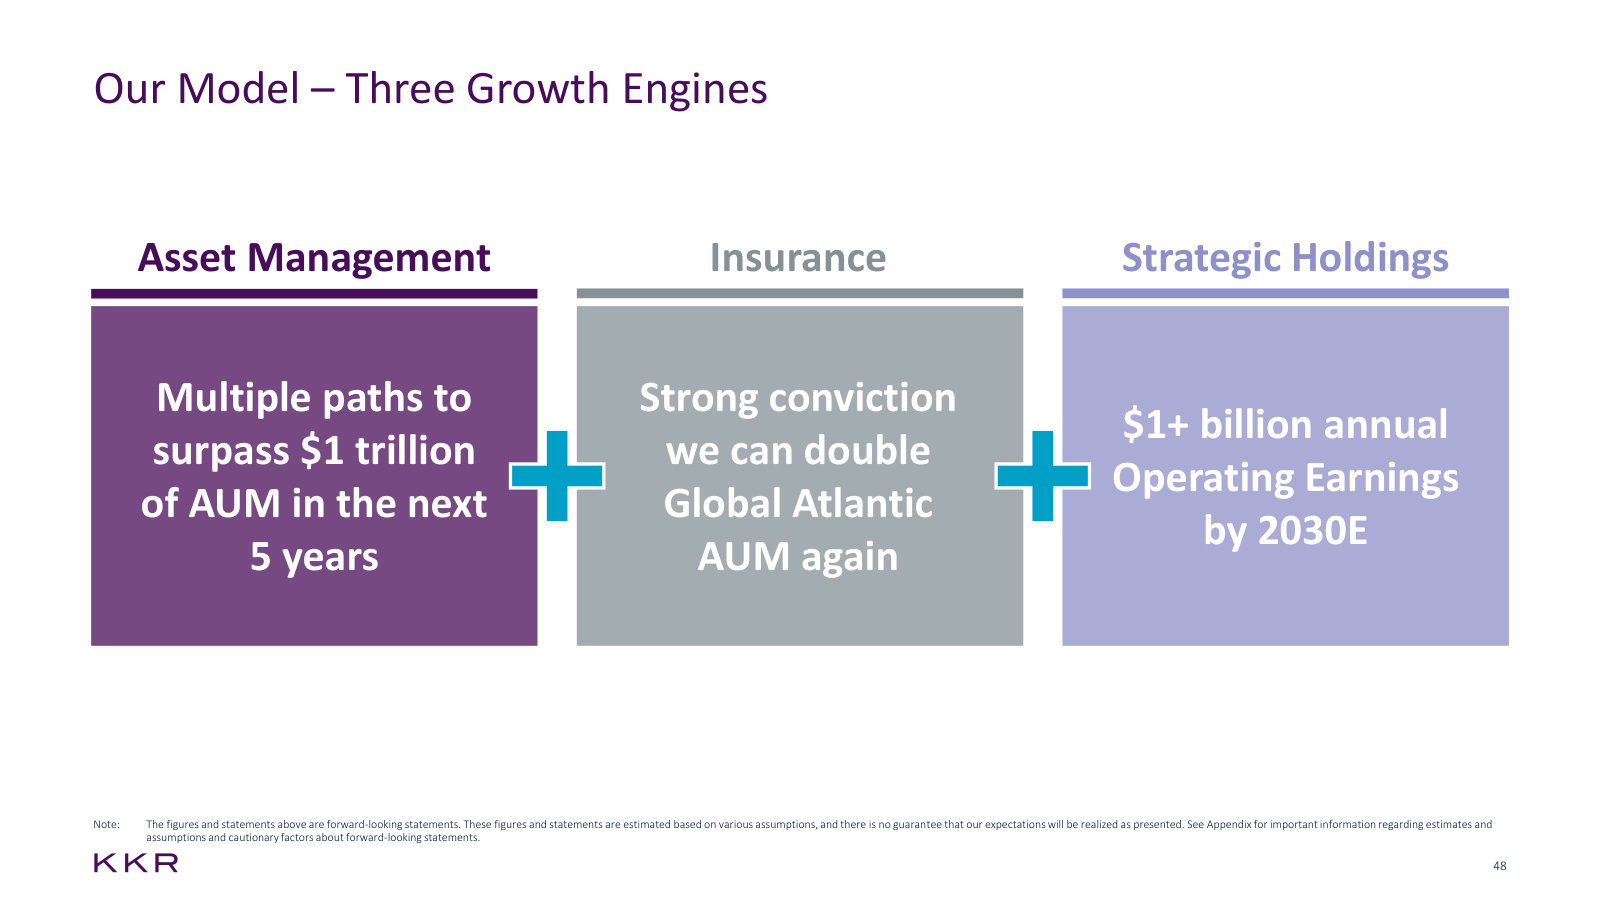
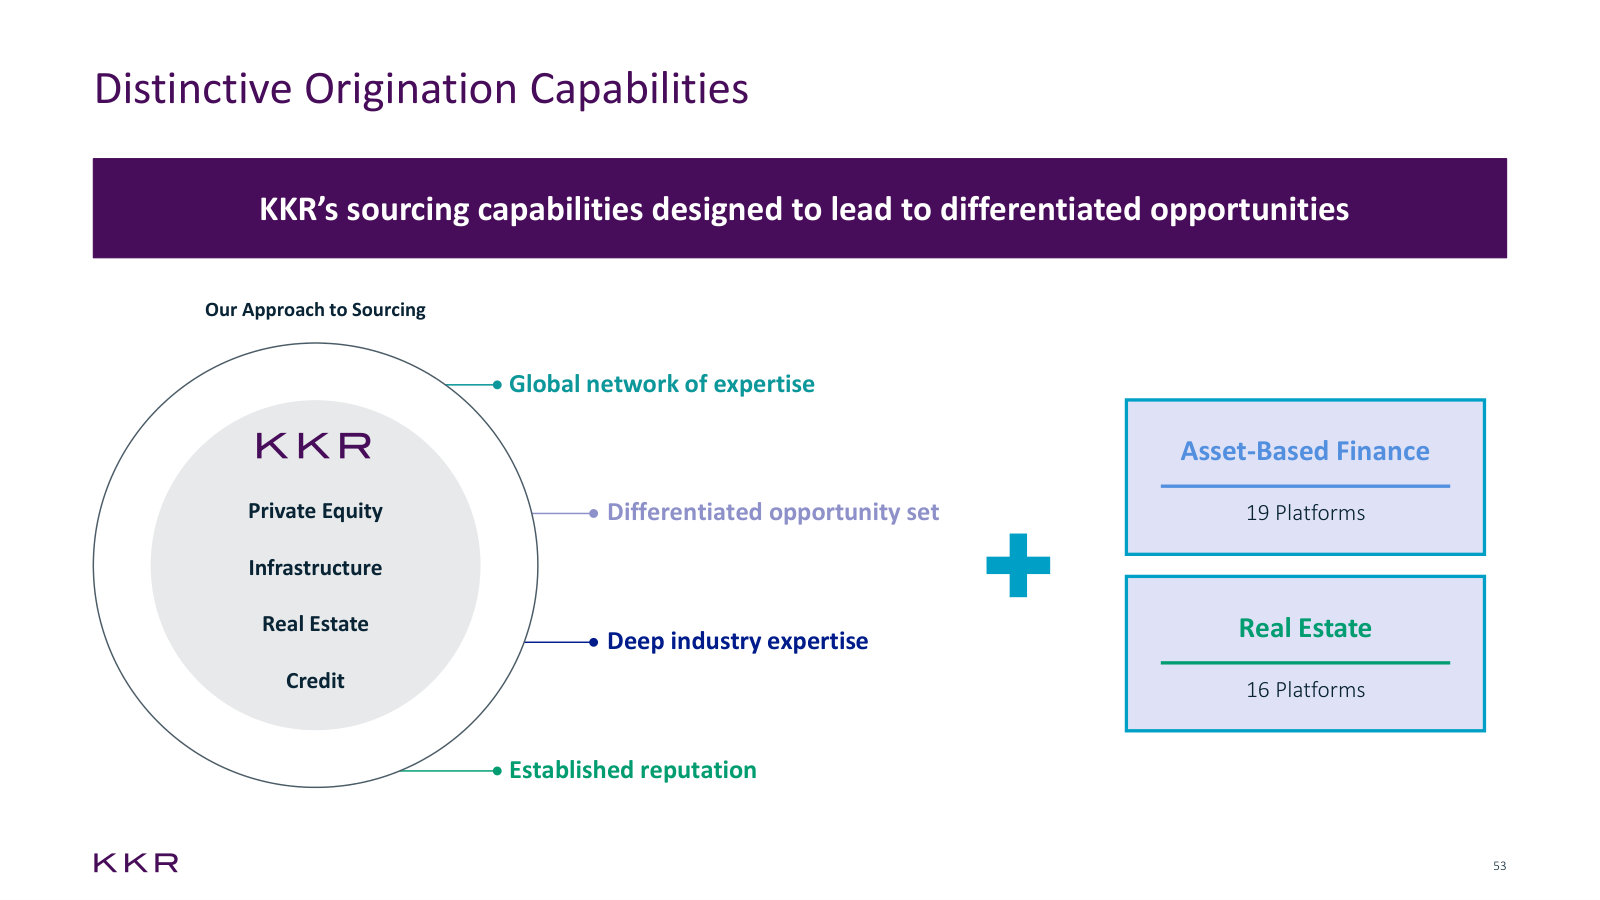
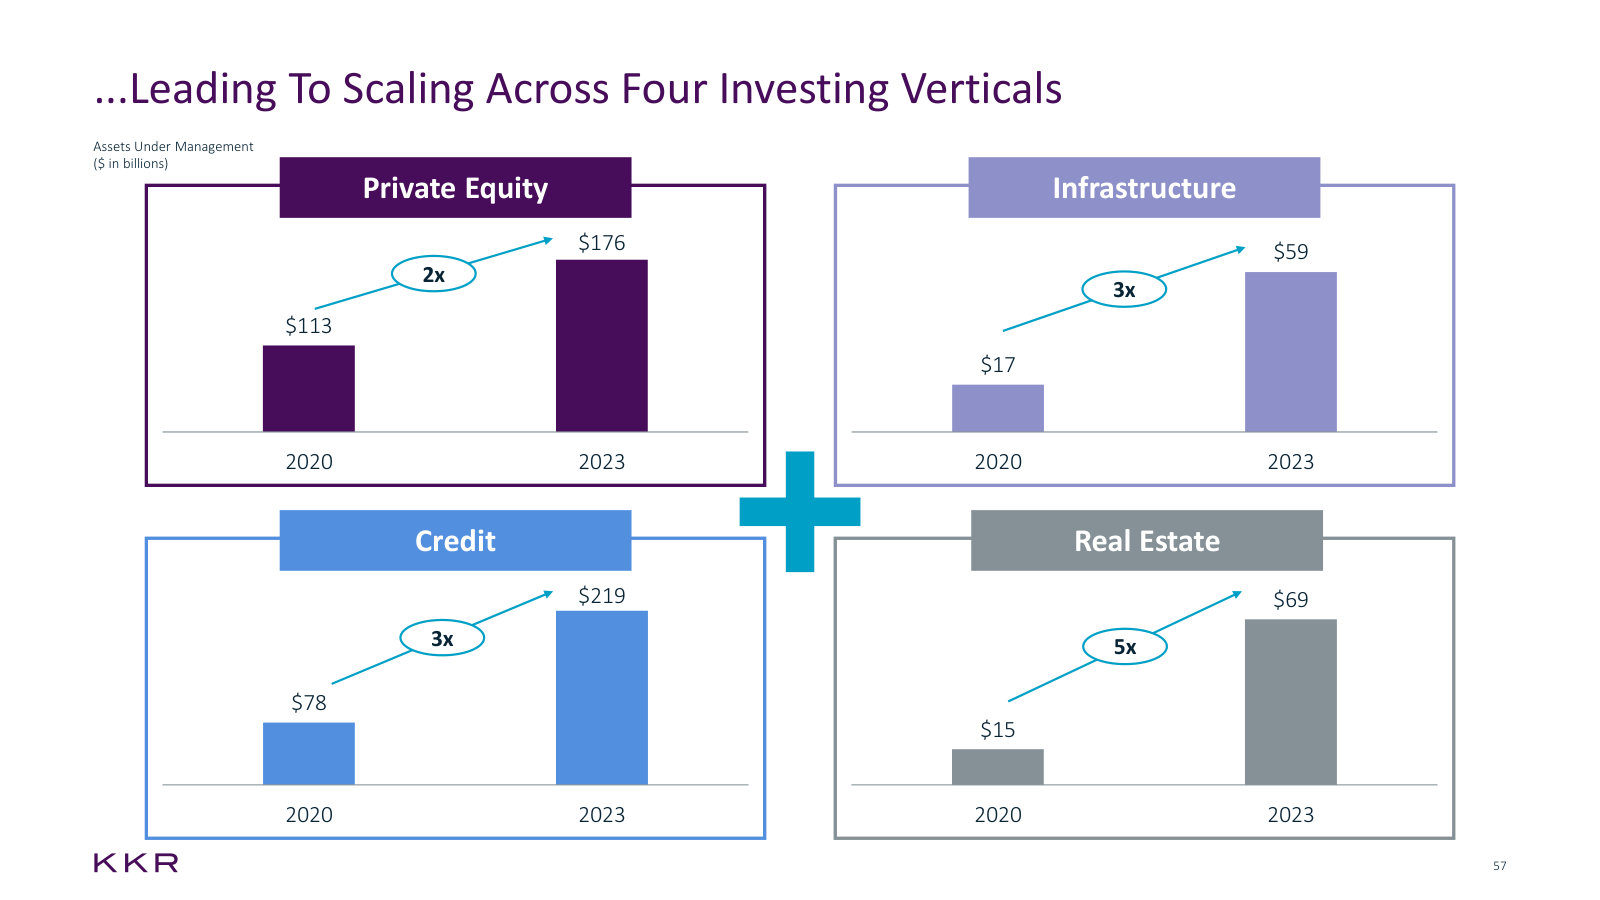
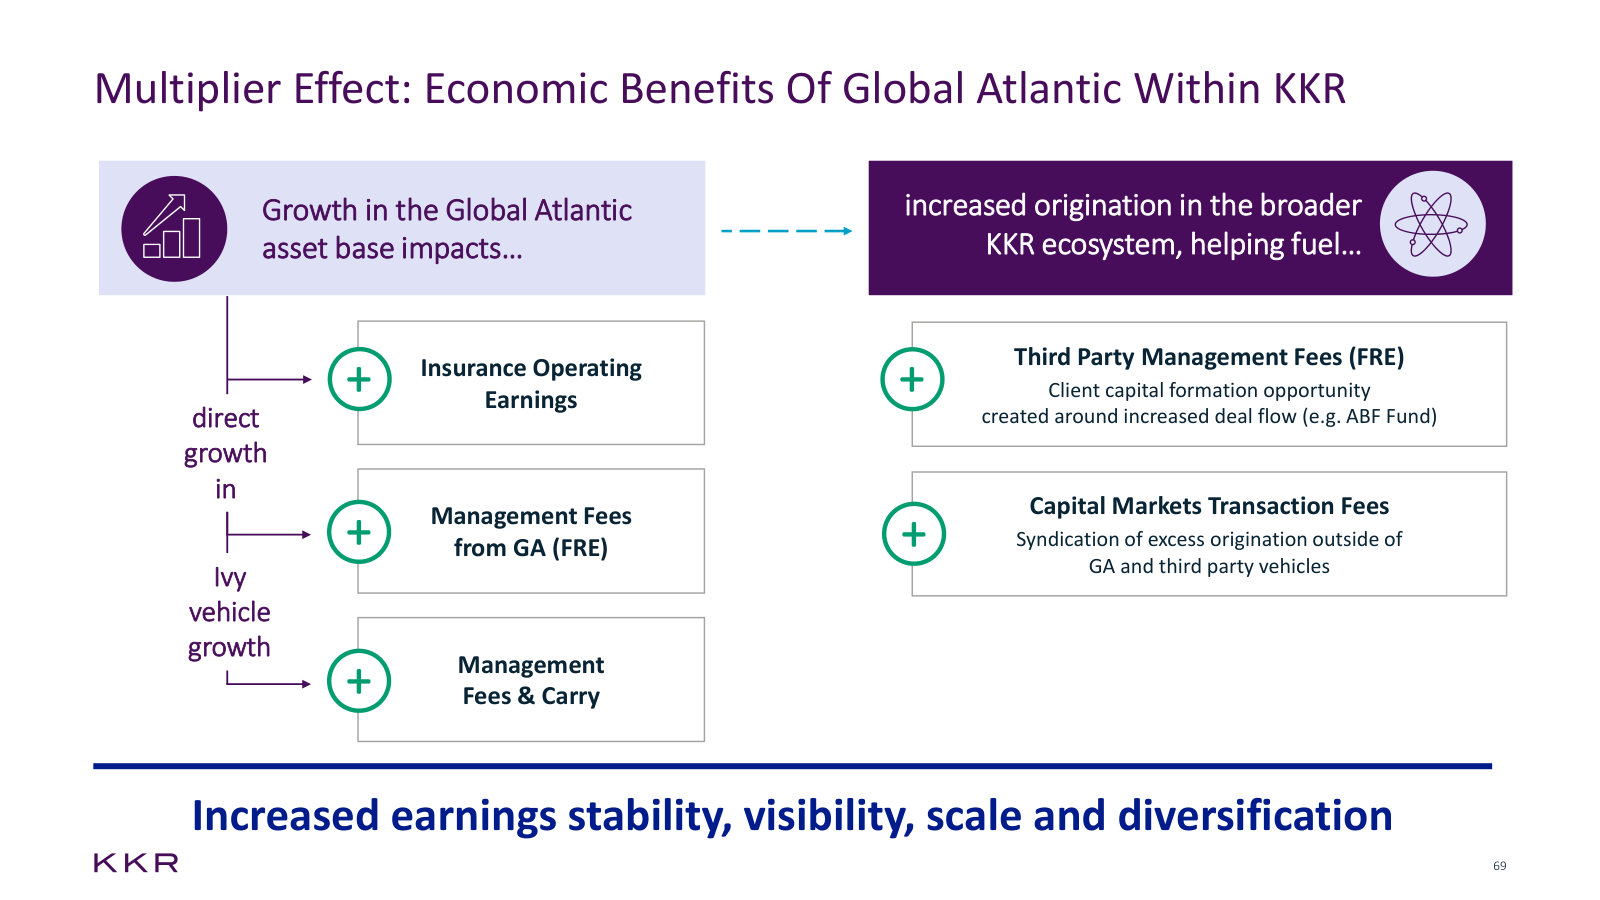
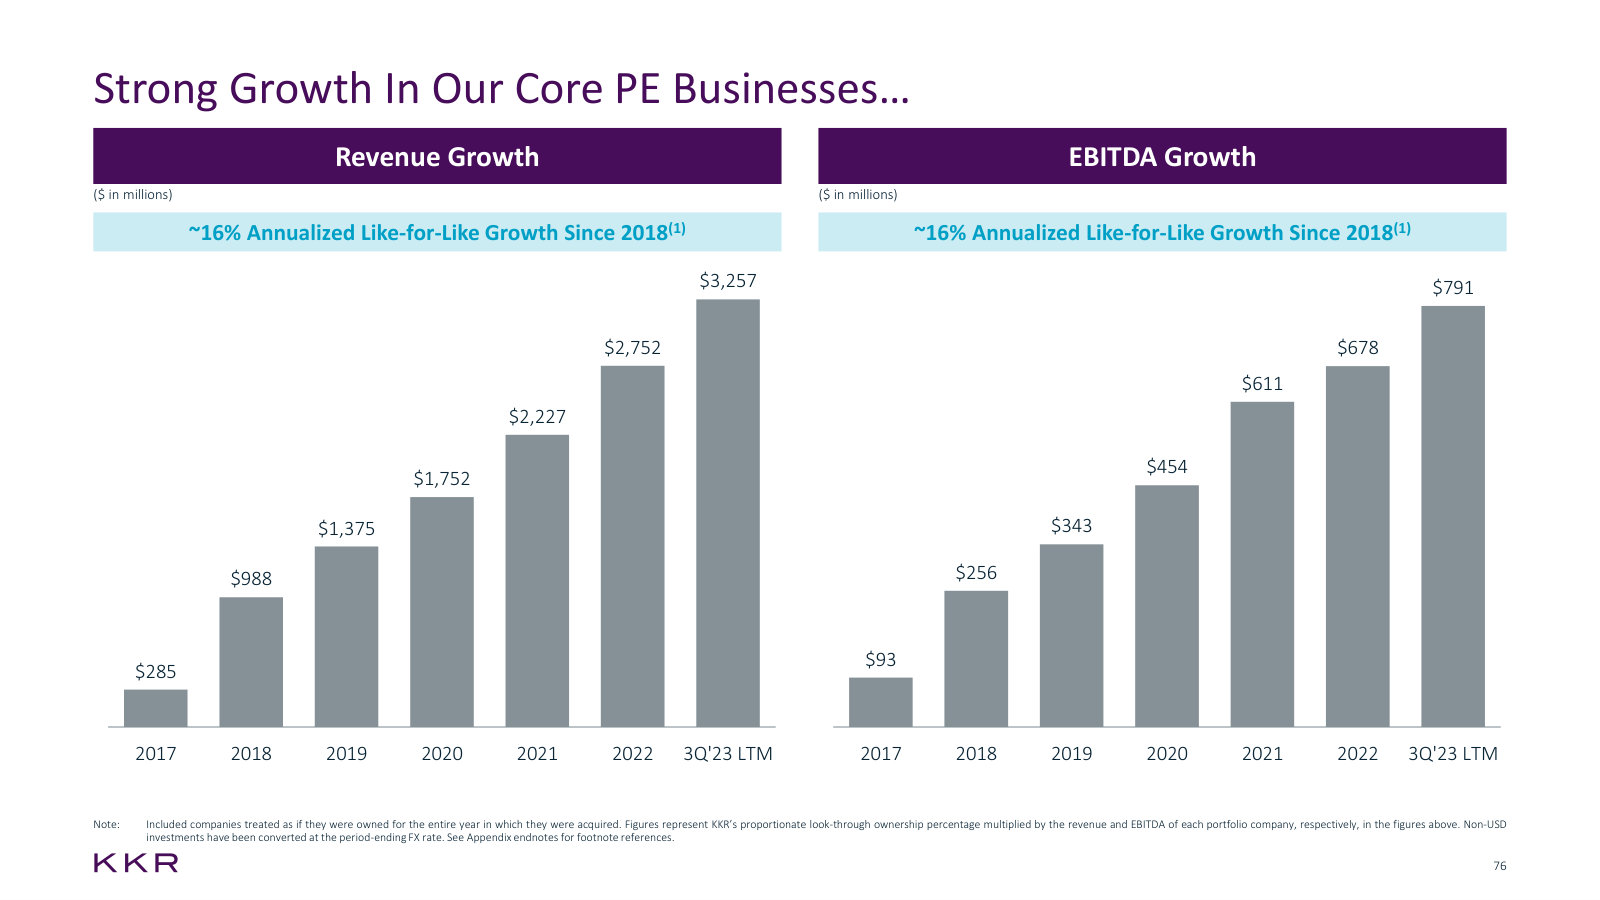
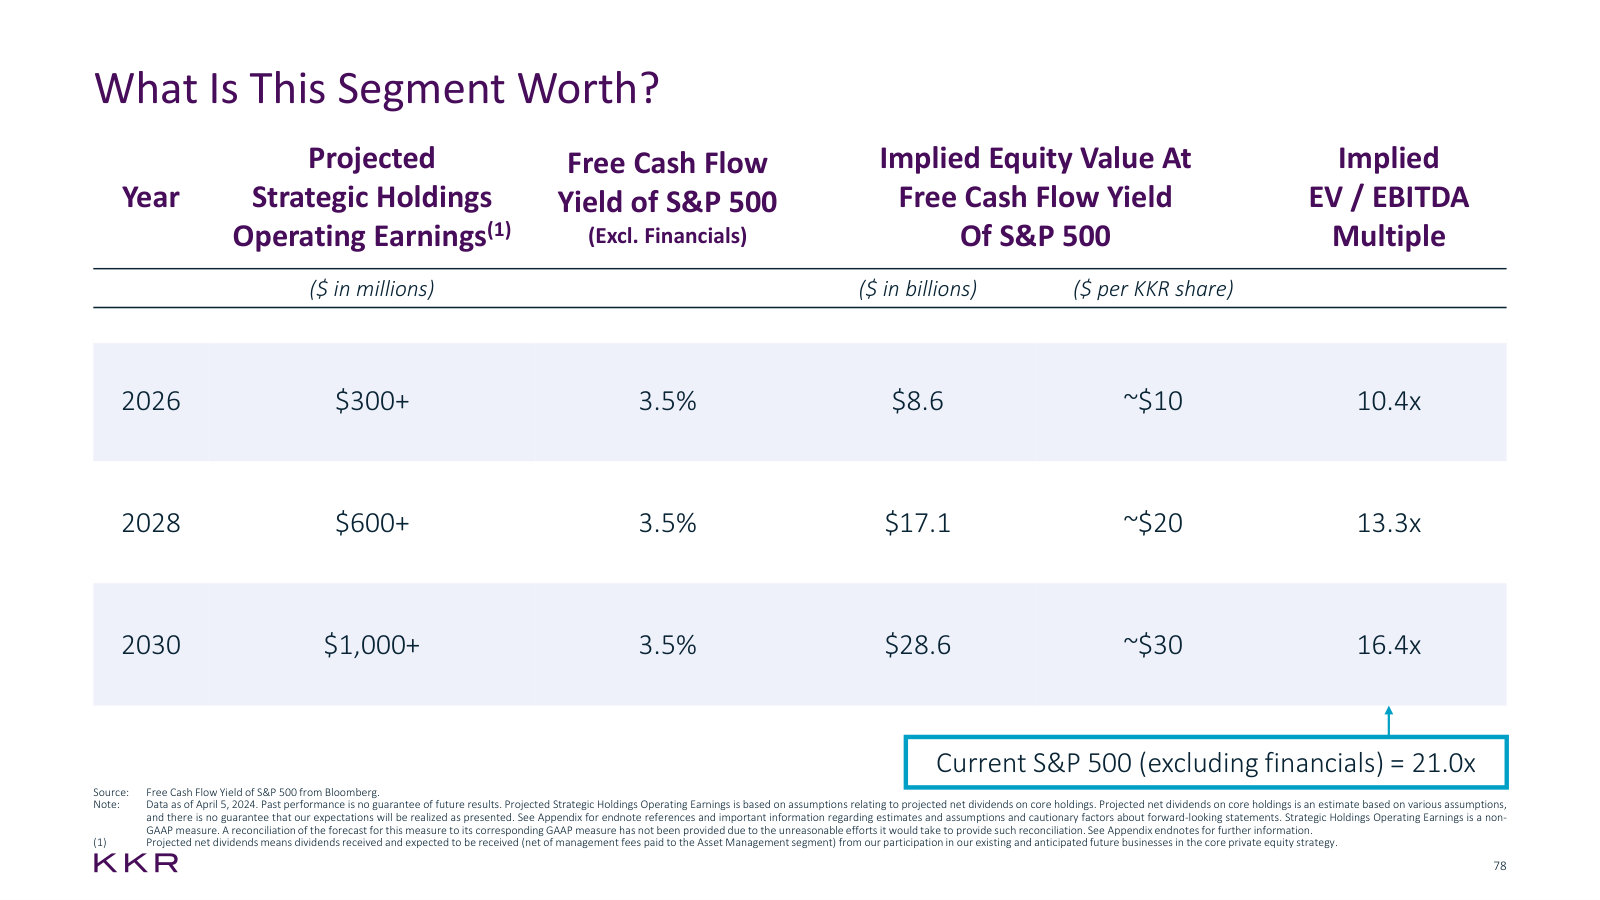
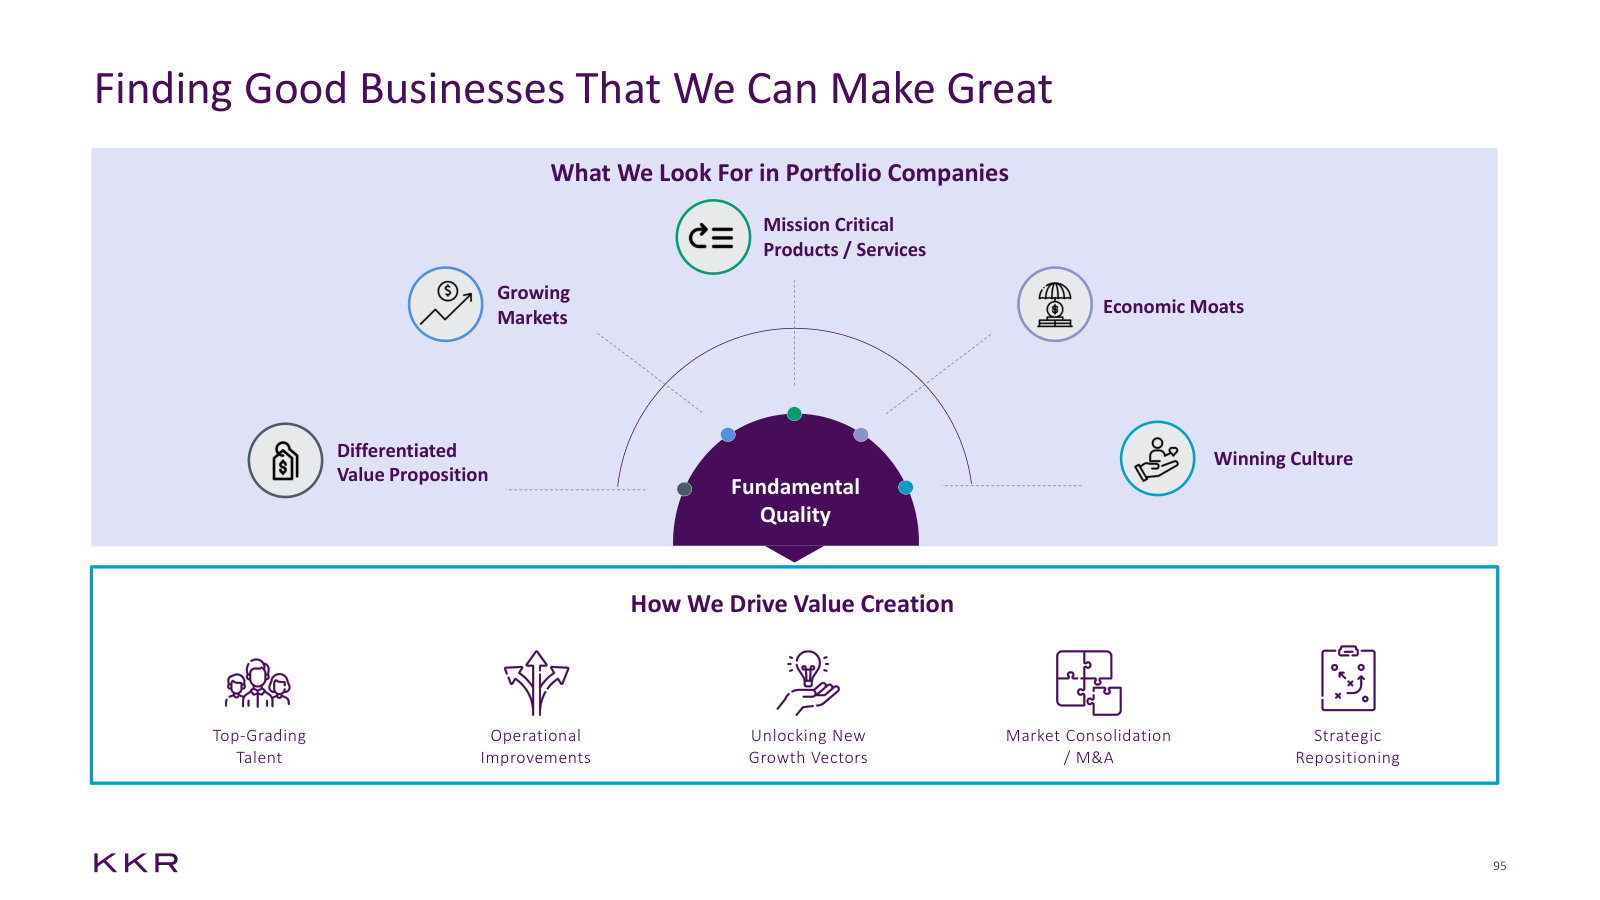
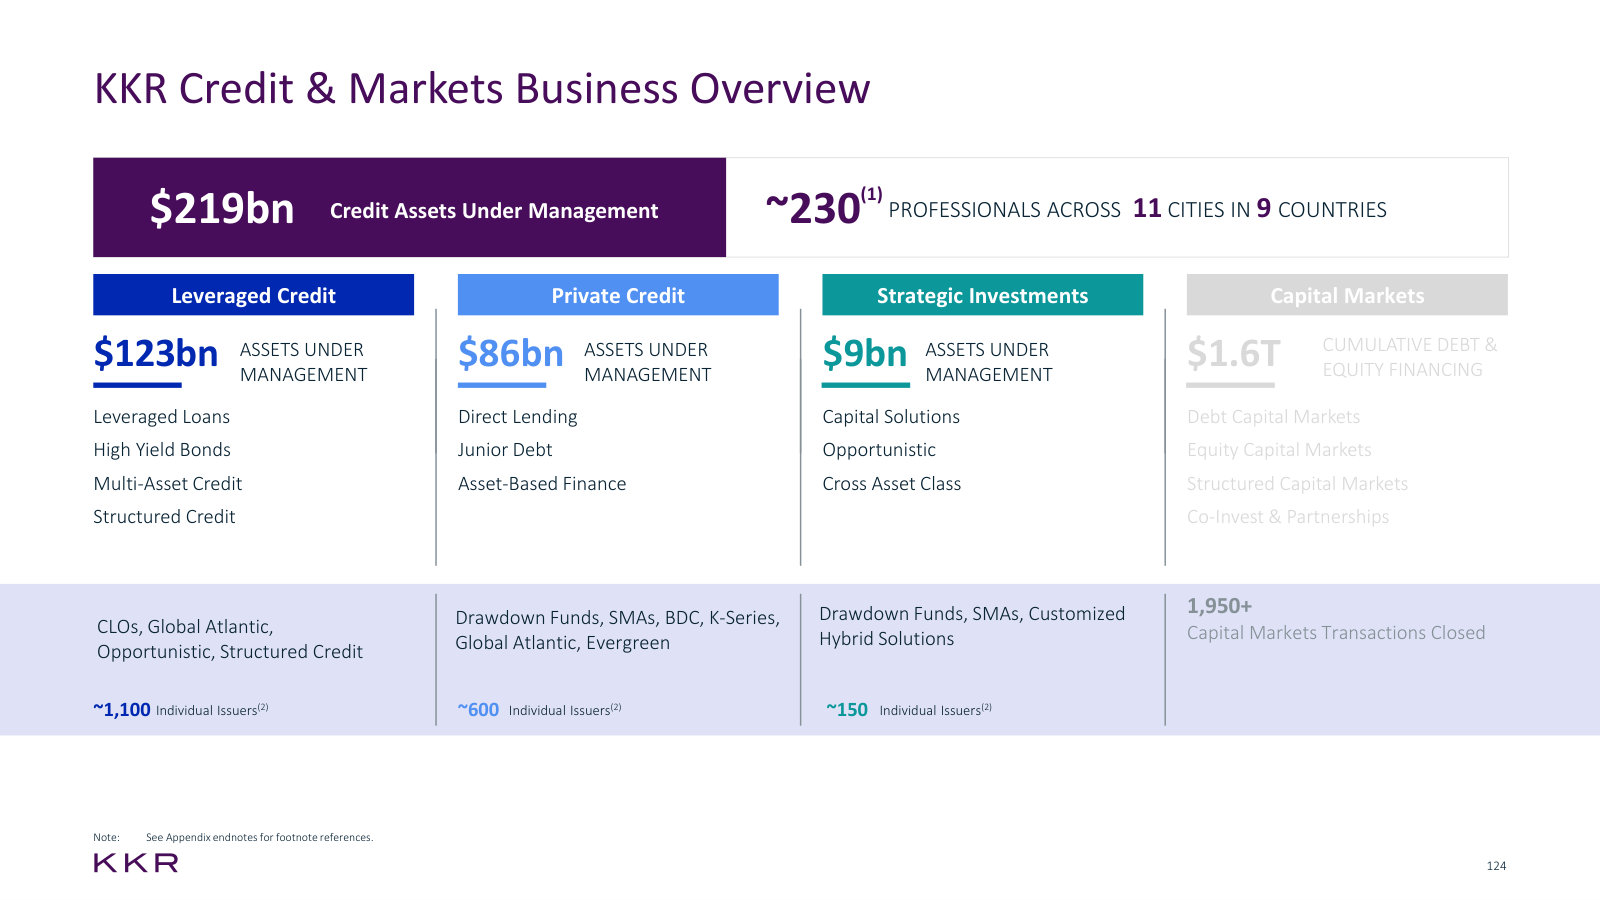
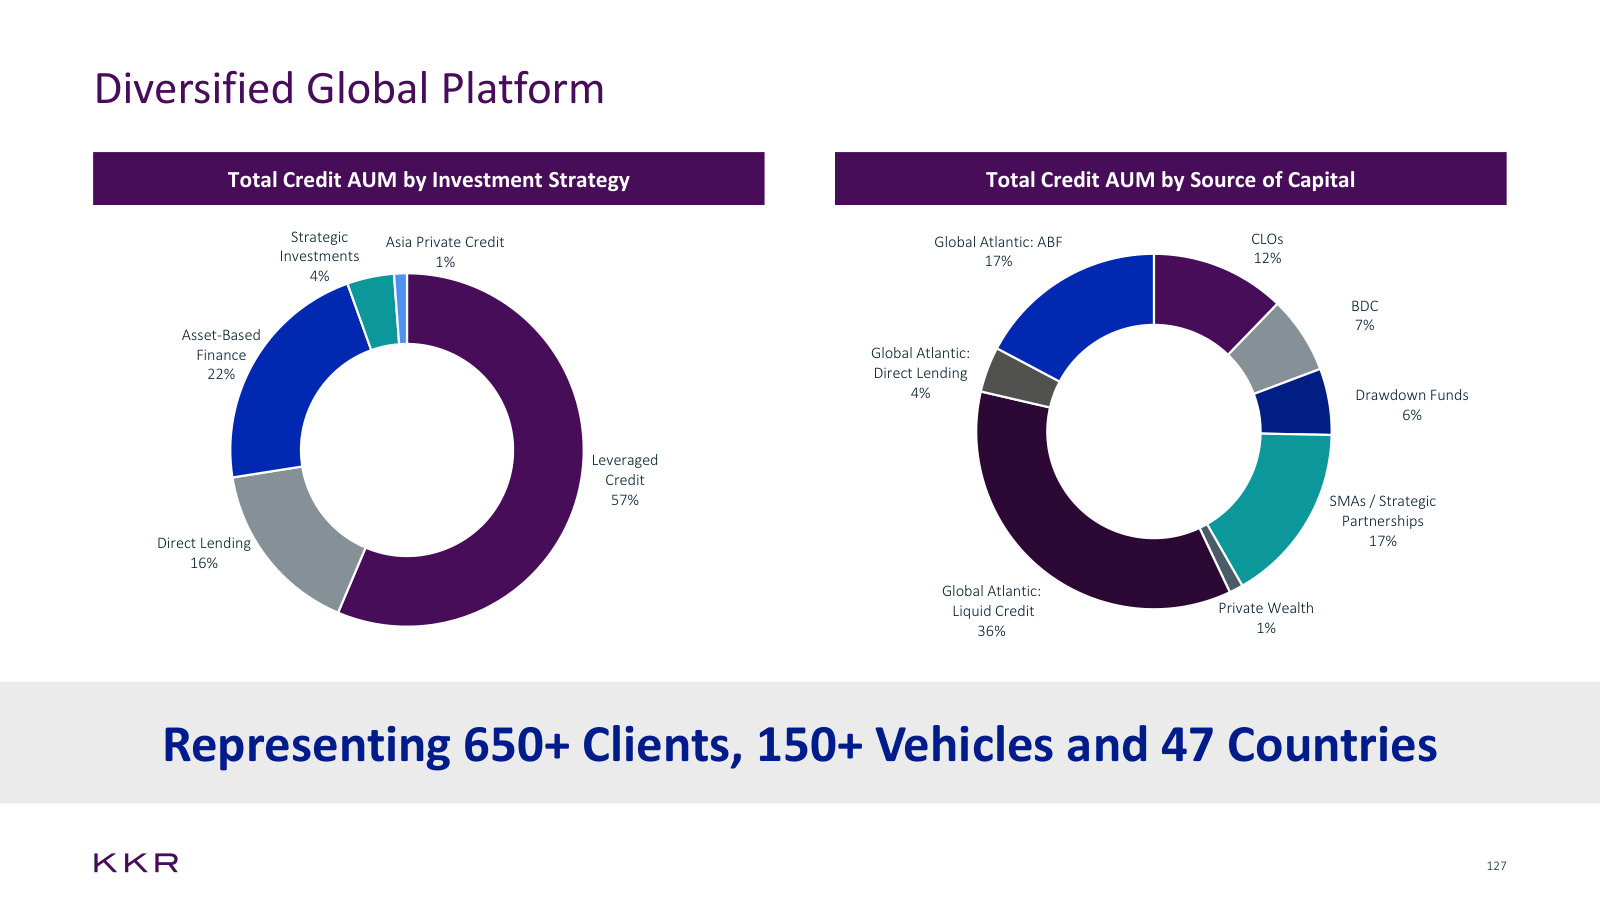
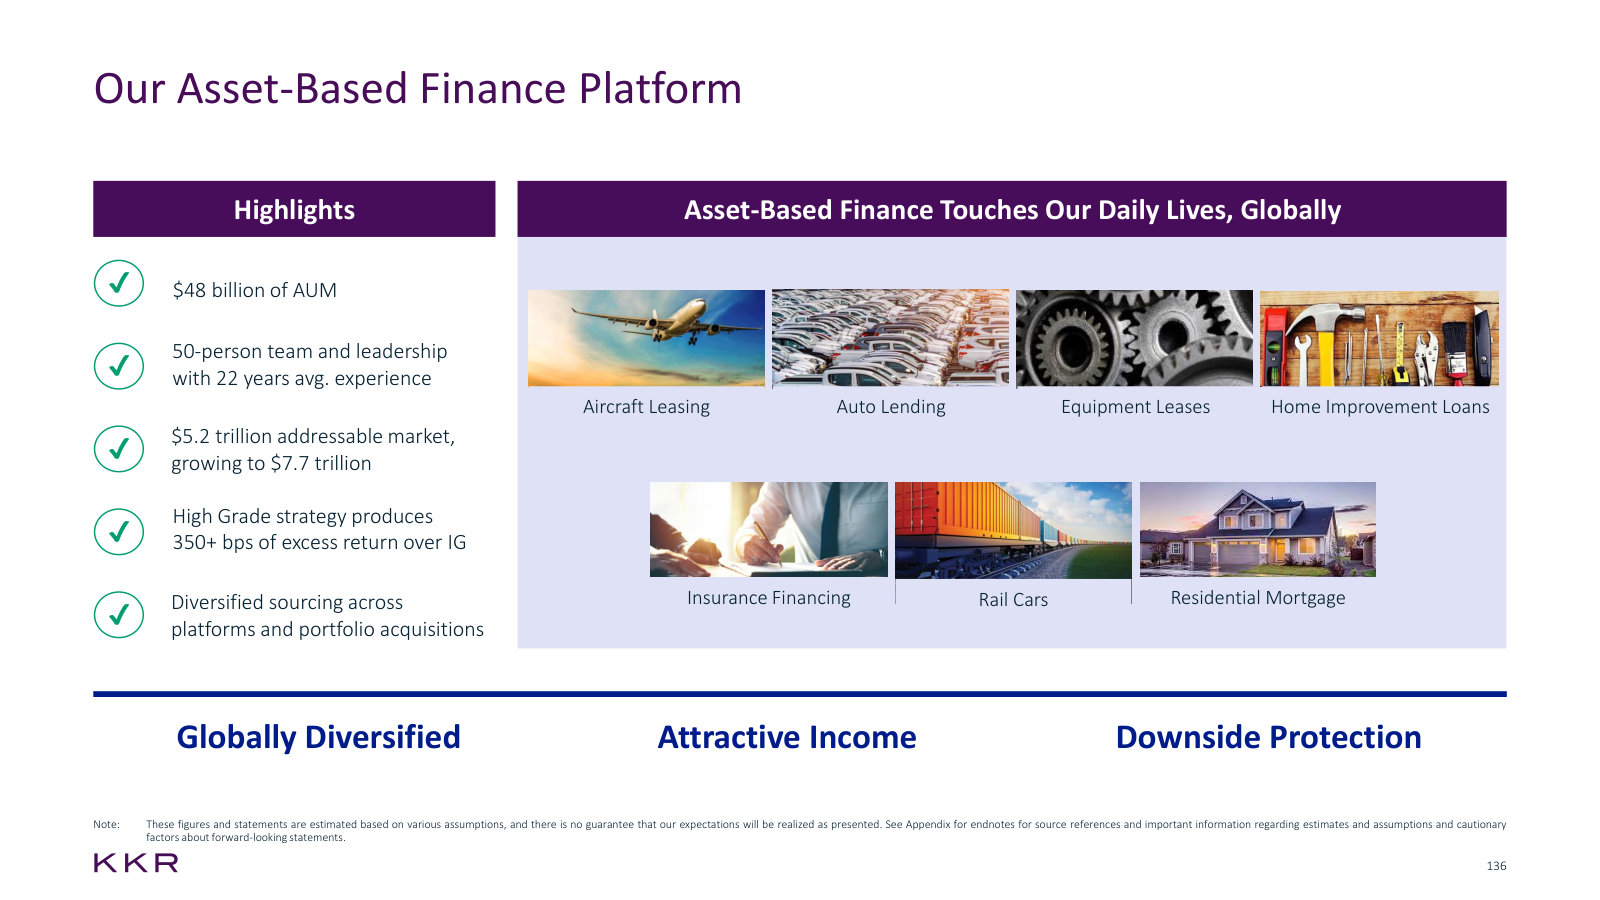
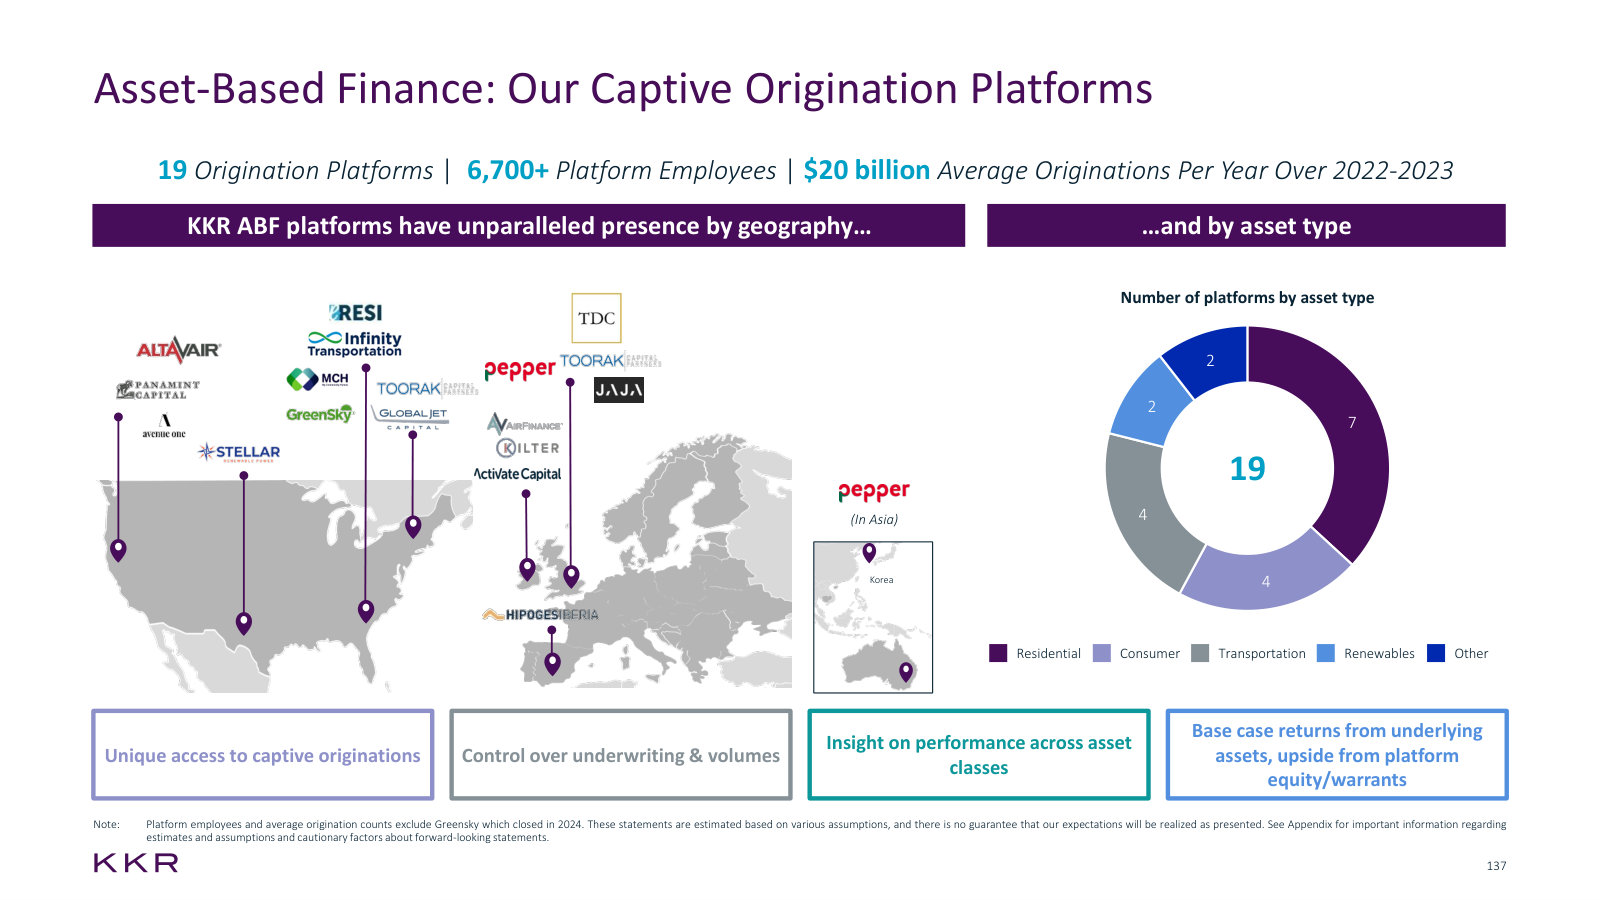
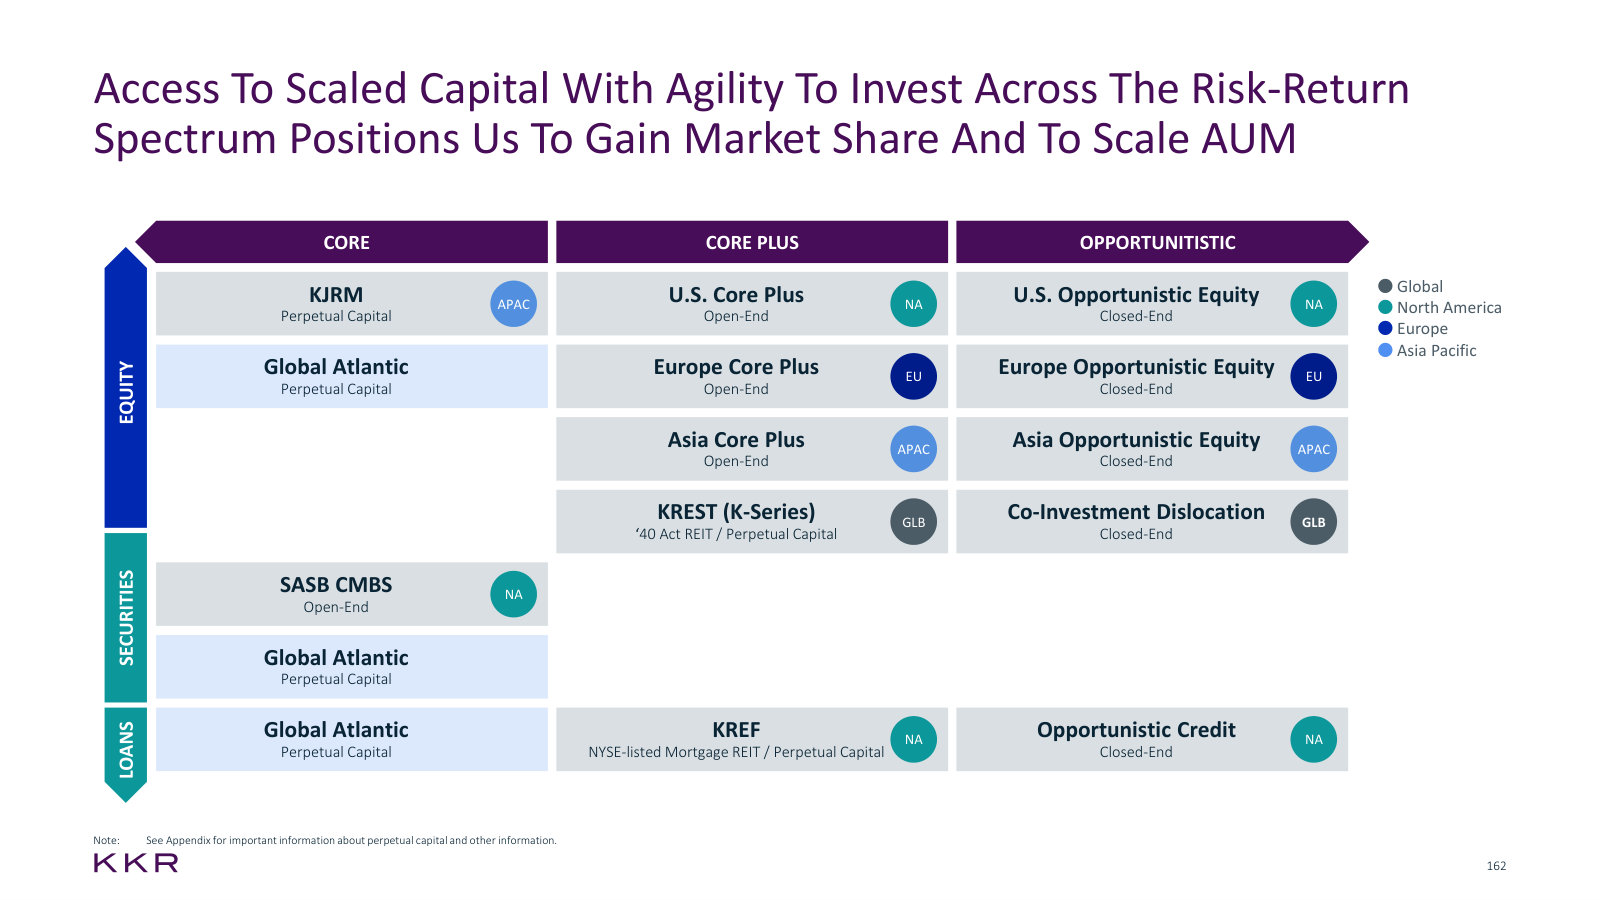
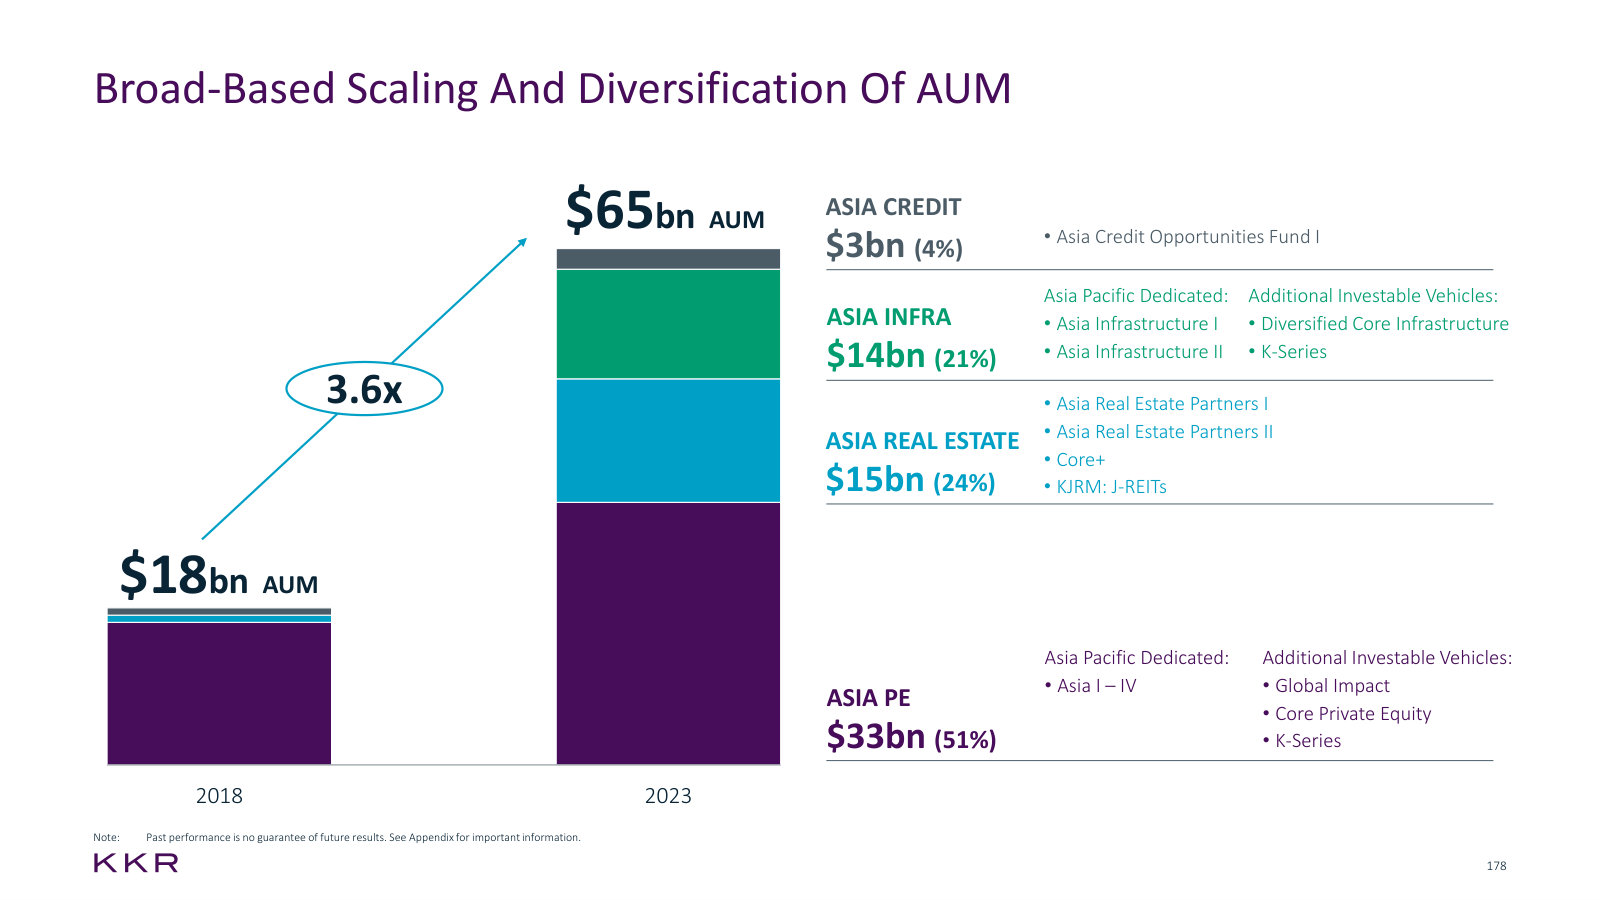
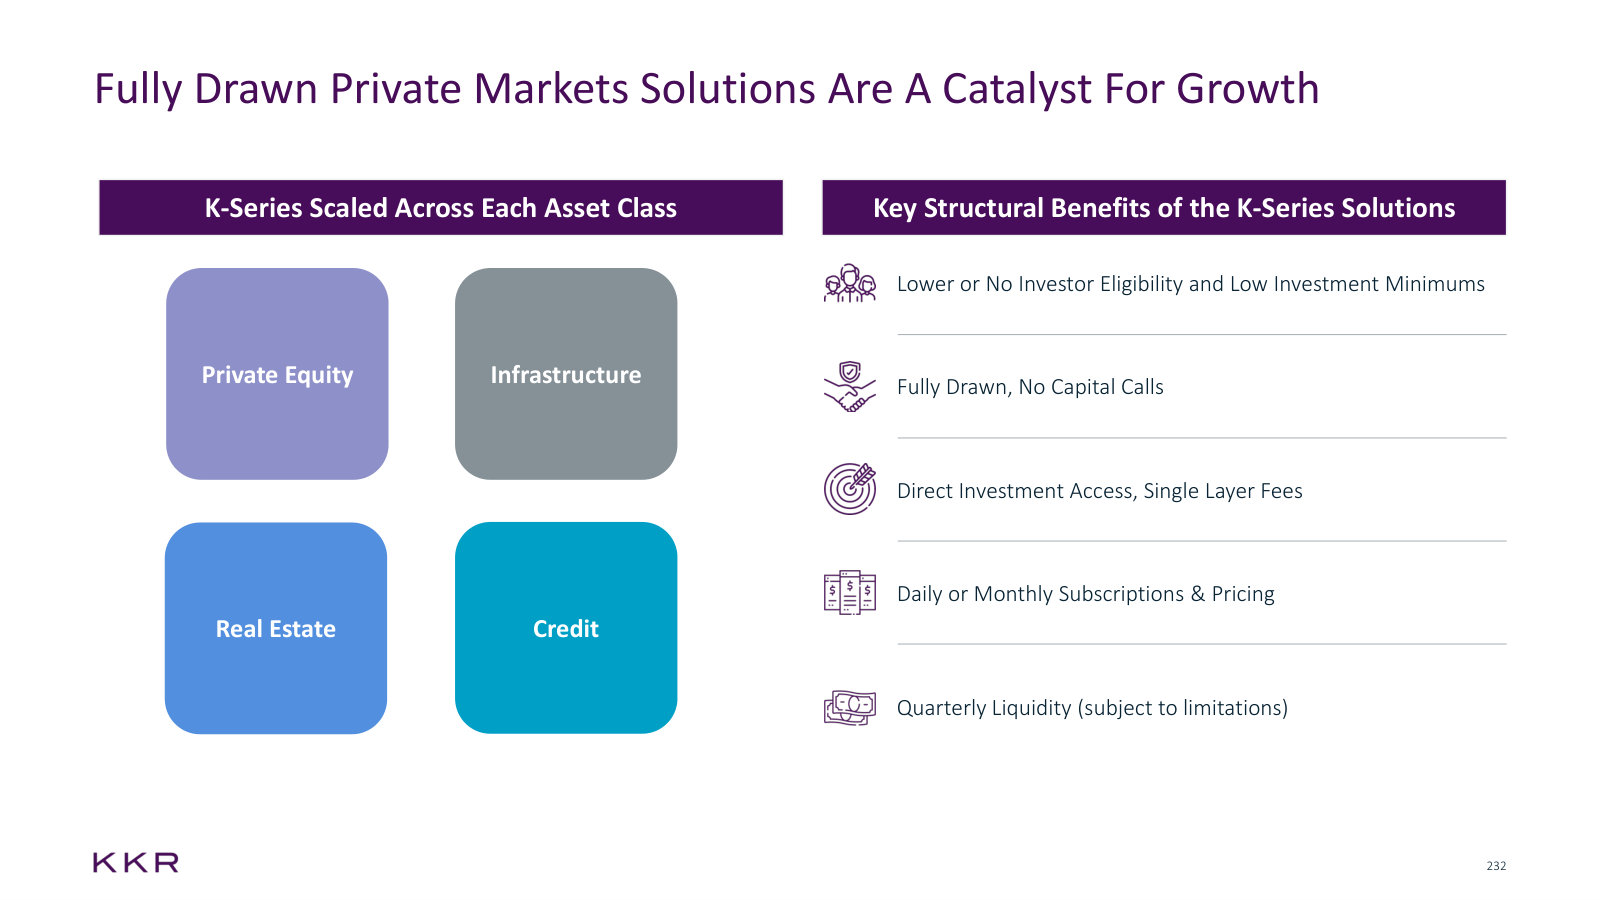
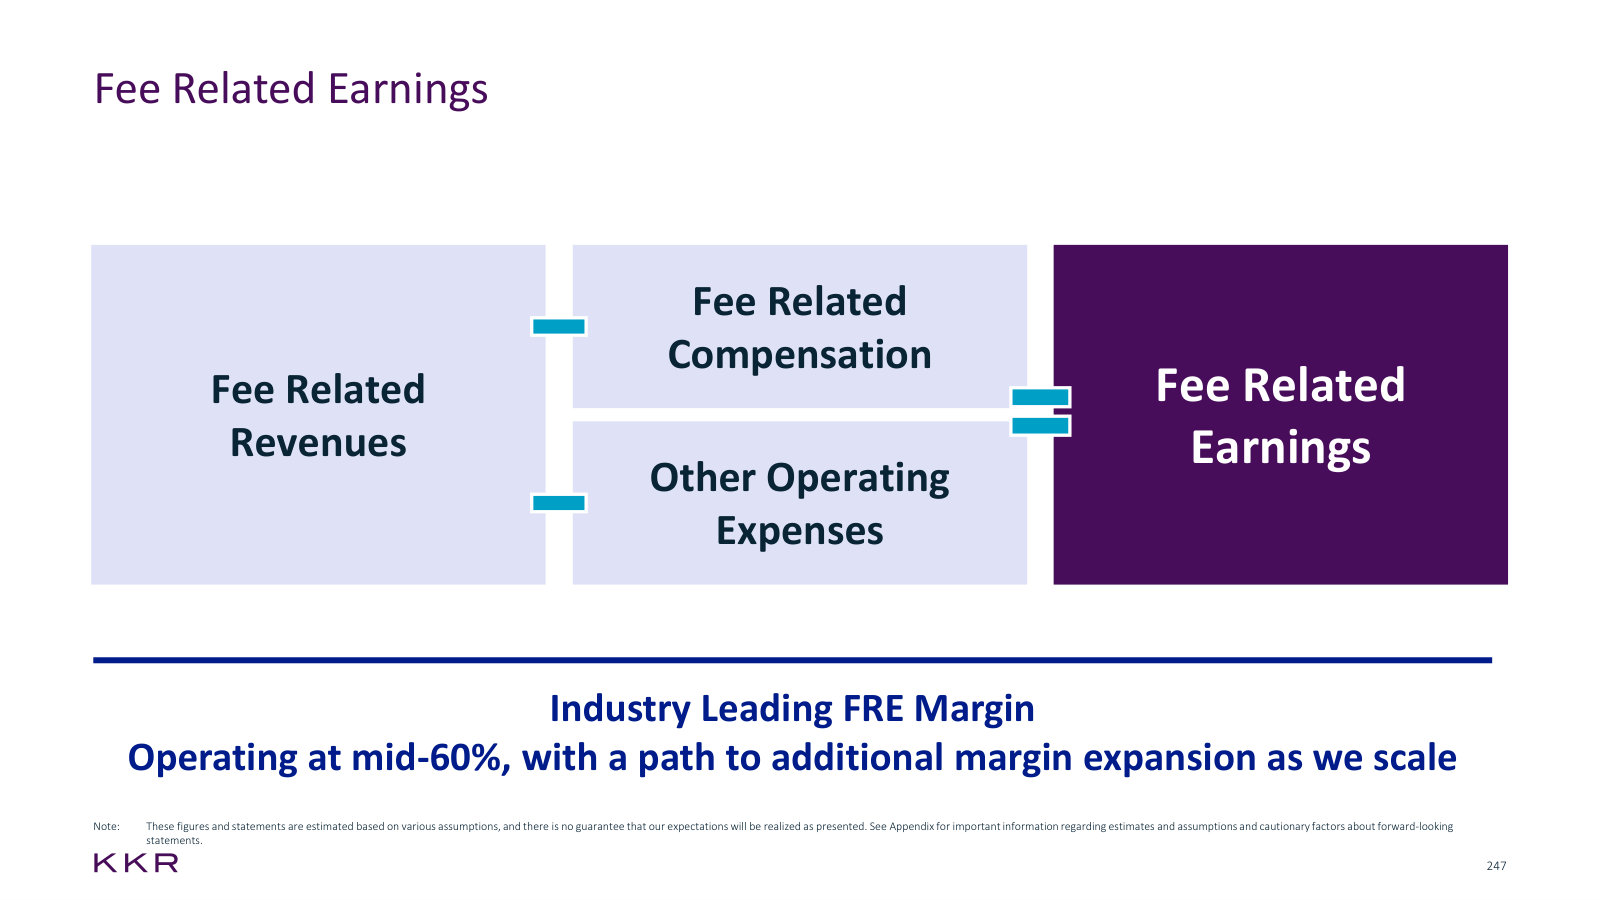
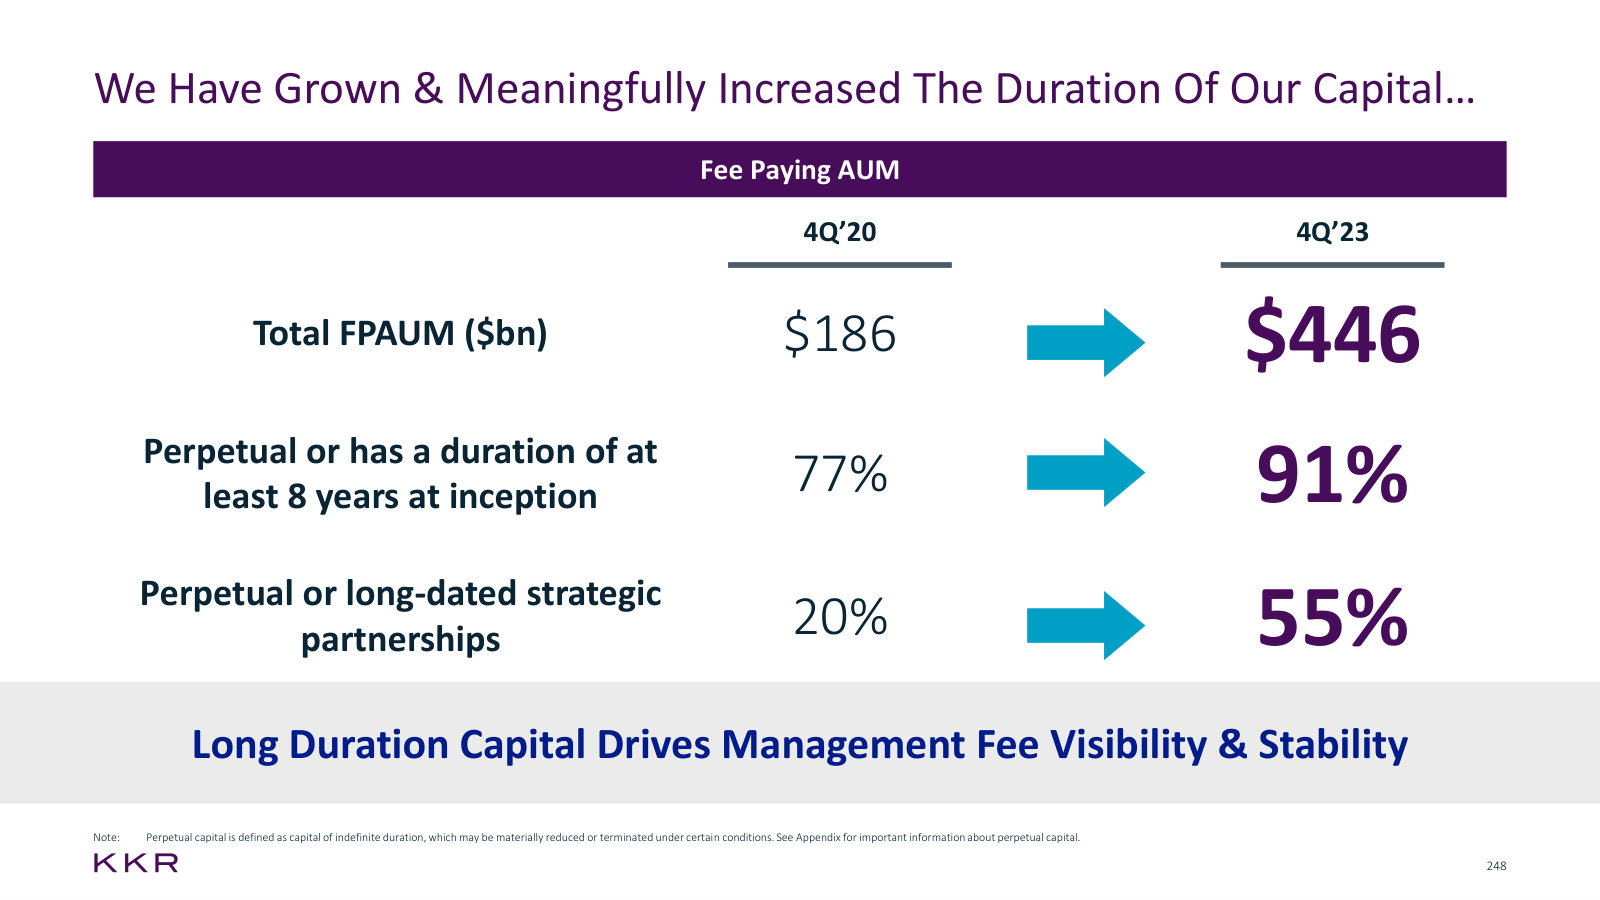
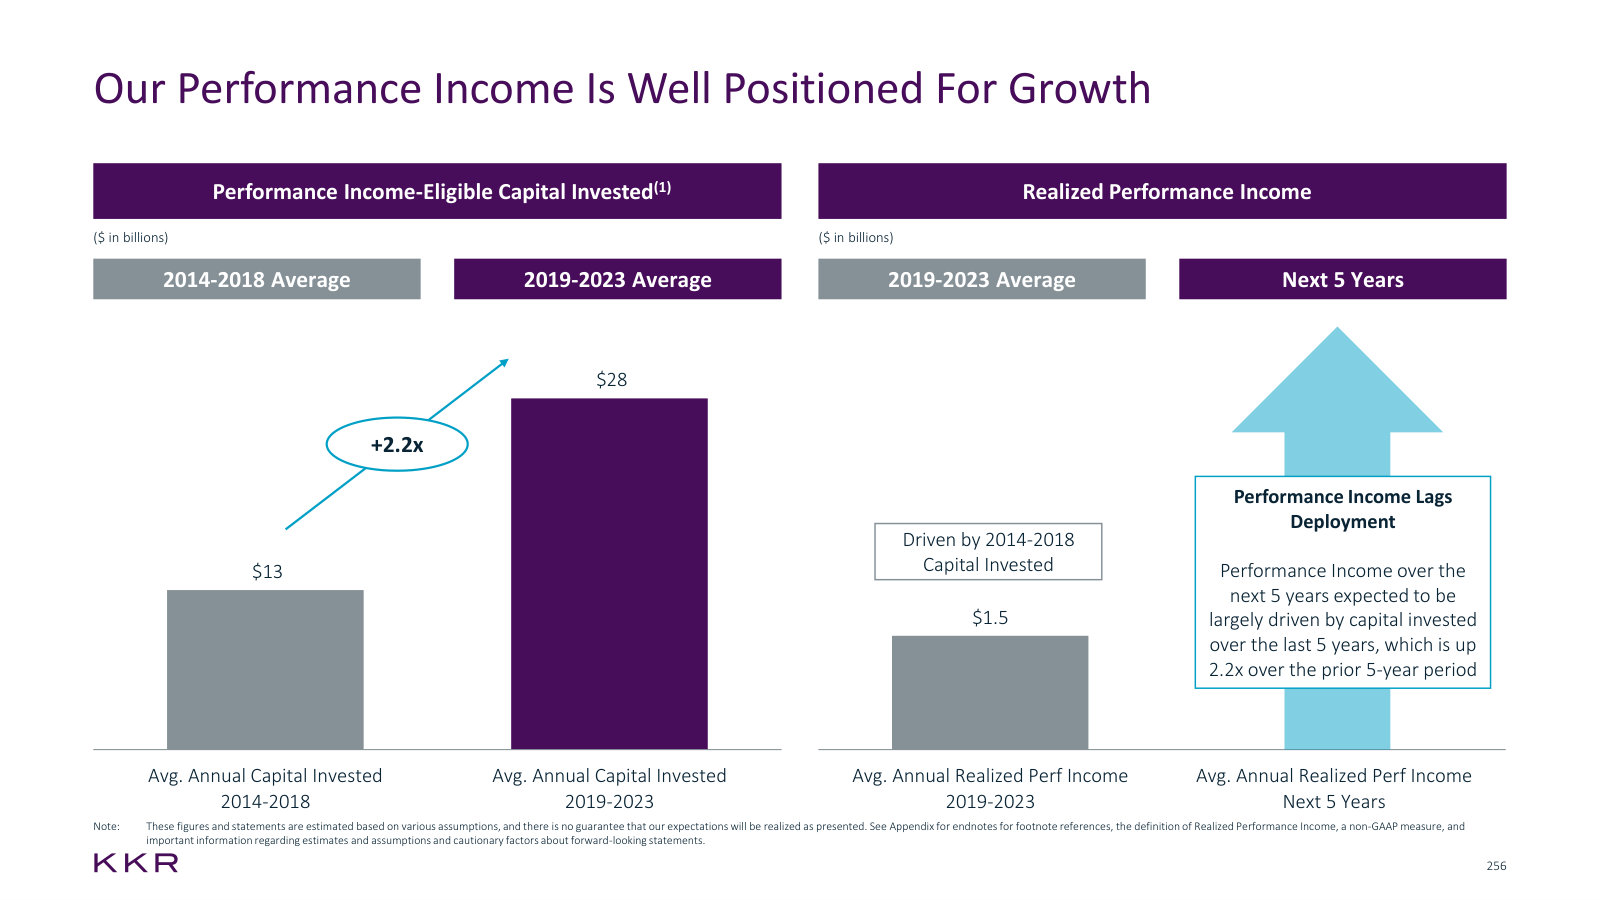
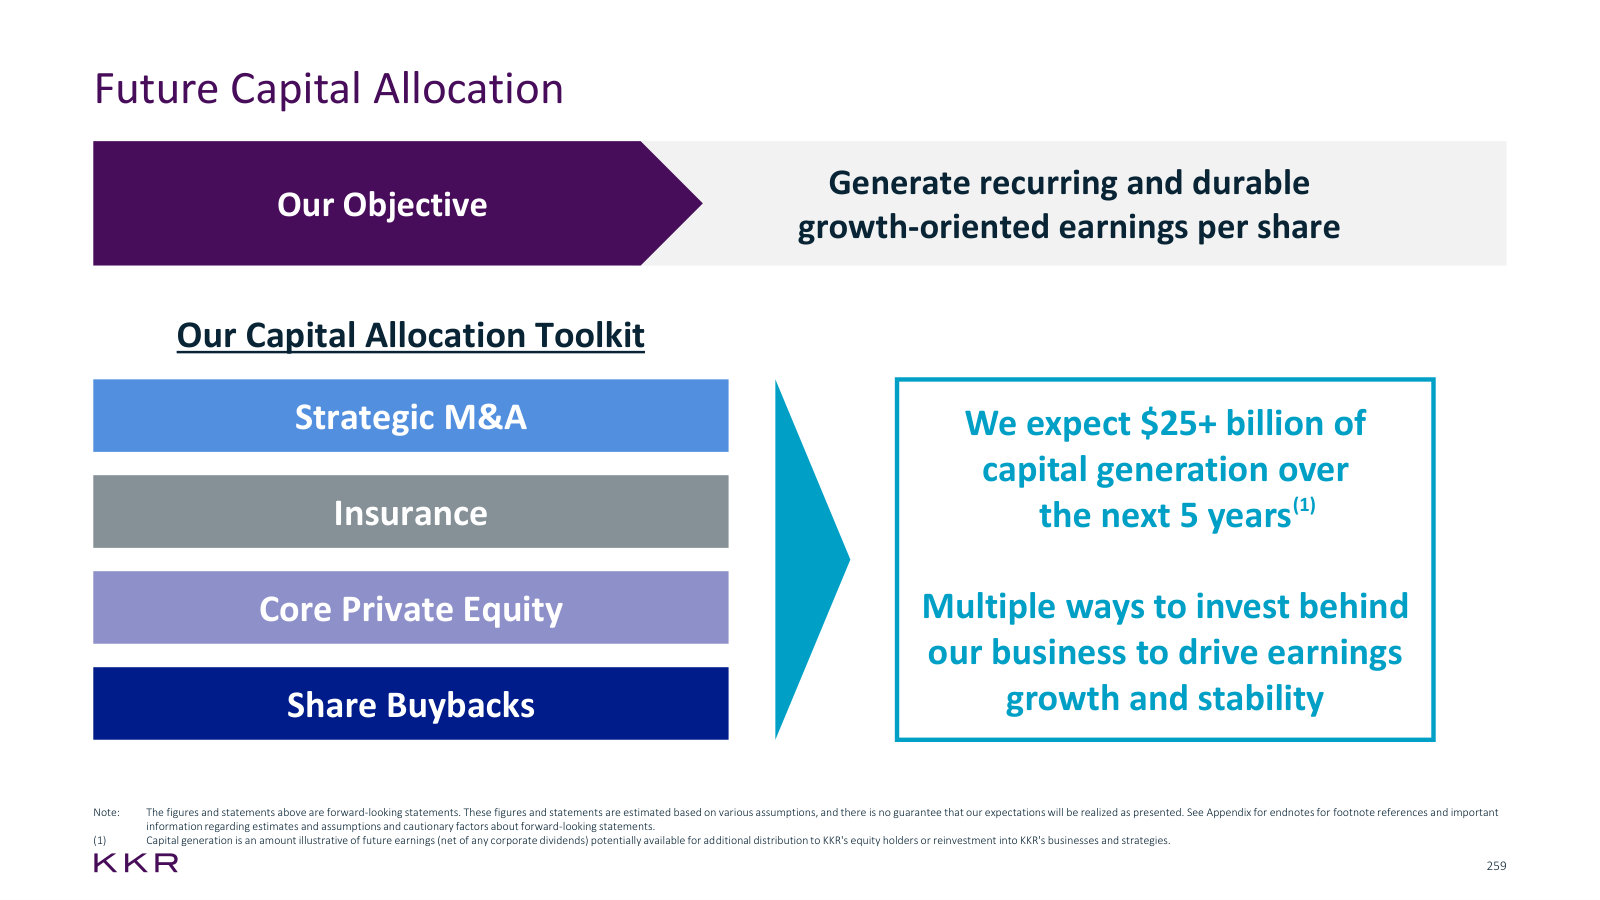
p. 8 — What KKR sold in 2010 against what it sells today — three product lines became roughly forty strategies. · Open the full presentation →p. 10 — Gross inception-to-date return against benchmark for eighteen mature funds across every asset class. · Open the full presentation →p. 22 — The 2024–2026 targets set at this investor day: $300bn+ raised, $4.50+ FRE and $7–$8 Adjusted Net Income per share. · Open the full presentation →p. 23 — The long-range ambition — $15+ of Adjusted Net Income per share, with ~70% of pre-tax earnings recurring. · Open the full presentation →p. 34 — The demographic case for insurance: the 65+ population doubling, and defined contribution displacing pensions. · Open the full presentation →p. 36 — The private wealth arithmetic — $255tn of wealth by 2027 at 6% in alternatives, an $11tn addressable pool. · Open the full presentation →p. 39 — Why private credit grew: bank retrenchment, a ~$40tn global credit market, and what issuers and investors each want. · Open the full presentation →p. 44 — The candid slide — very few listed companies scale past $50bn of market cap, which is the problem KKR set itself. · Open the full presentation →p. 47 — How the addressable market widened from $10tn in 2018 to include credit, core real assets and strategic holdings. · Open the full presentation →p. 48 — The five-year goal per engine: $1tn+ AUM, double Global Atlantic, $1bn+ of Strategic Holdings earnings by 2030. · Open the full presentation →p. 53 — Where deals come from — the sourcing network plus 19 asset-based finance and 16 real estate origination platforms. · Open the full presentation →p. 57 — The four investing verticals and how each grew from 2020 to 2023, with credit and real estate scaling fastest. · Open the full presentation →p. 69 — The mechanism behind the insurance flywheel — which specific P&L lines a larger Global Atlantic asset base feeds. · Open the full presentation →p. 76 — Revenue and EBITDA of the Core PE portfolio inside Strategic Holdings, compounding about 16% a year since 2018. · Open the full presentation →p. 78 — Management's own valuation of Strategic Holdings — projected earnings capitalised at the S&P free cash flow yield. · Open the full presentation →p. 95 — What KKR looks for in a company and the five levers it pulls afterwards — the private equity method stated plainly. · Open the full presentation →p. 124 — The credit business in one frame: $219bn split across leveraged credit, private credit and strategic investments. · Open the full presentation →p. 127 — Credit AUM by strategy and, more usefully, by source of capital — Global Atlantic supplies over half of it. · Open the full presentation →p. 136 — What asset-based finance actually is — aircraft, autos, mortgages, rail — and the $5.2tn market behind it. · Open the full presentation →p. 137 — The 19 captive platforms and 6,700 employees that manufacture KKR's ABF assets rather than buying them in the market. · Open the full presentation →p. 162 — Every real estate vehicle mapped by risk-return and capital type — how a real assets platform is actually organised. · Open the full presentation →p. 178 — Asia Pacific AUM from $18bn to $65bn, broken into private equity, real estate, infrastructure and credit. · Open the full presentation →p. 232 — What makes K-Series different from a drawdown fund: no capital calls, low minimums, monthly pricing, quarterly liquidity. · Open the full presentation →p. 247 — How fee related earnings are built, and the mid-60s margin management says still has room to expand. · Open the full presentation →p. 248 — Duration of the fee-paying capital base — 91% perpetual or at least eight years, up from 77% three years earlier. · Open the full presentation →p. 256 — Why performance income should rise: capital invested doubled over the prior five years, and carry lags deployment. · Open the full presentation →p. 259 — The capital allocation toolkit — M&A, insurance, Core PE, buybacks — against $25bn+ of expected capital generation. · Open the full presentation →
A short deck from the head of Real Assets on KKR's fastest-growing real assets business: returns, scale and the current investment theme. · Open the full document →
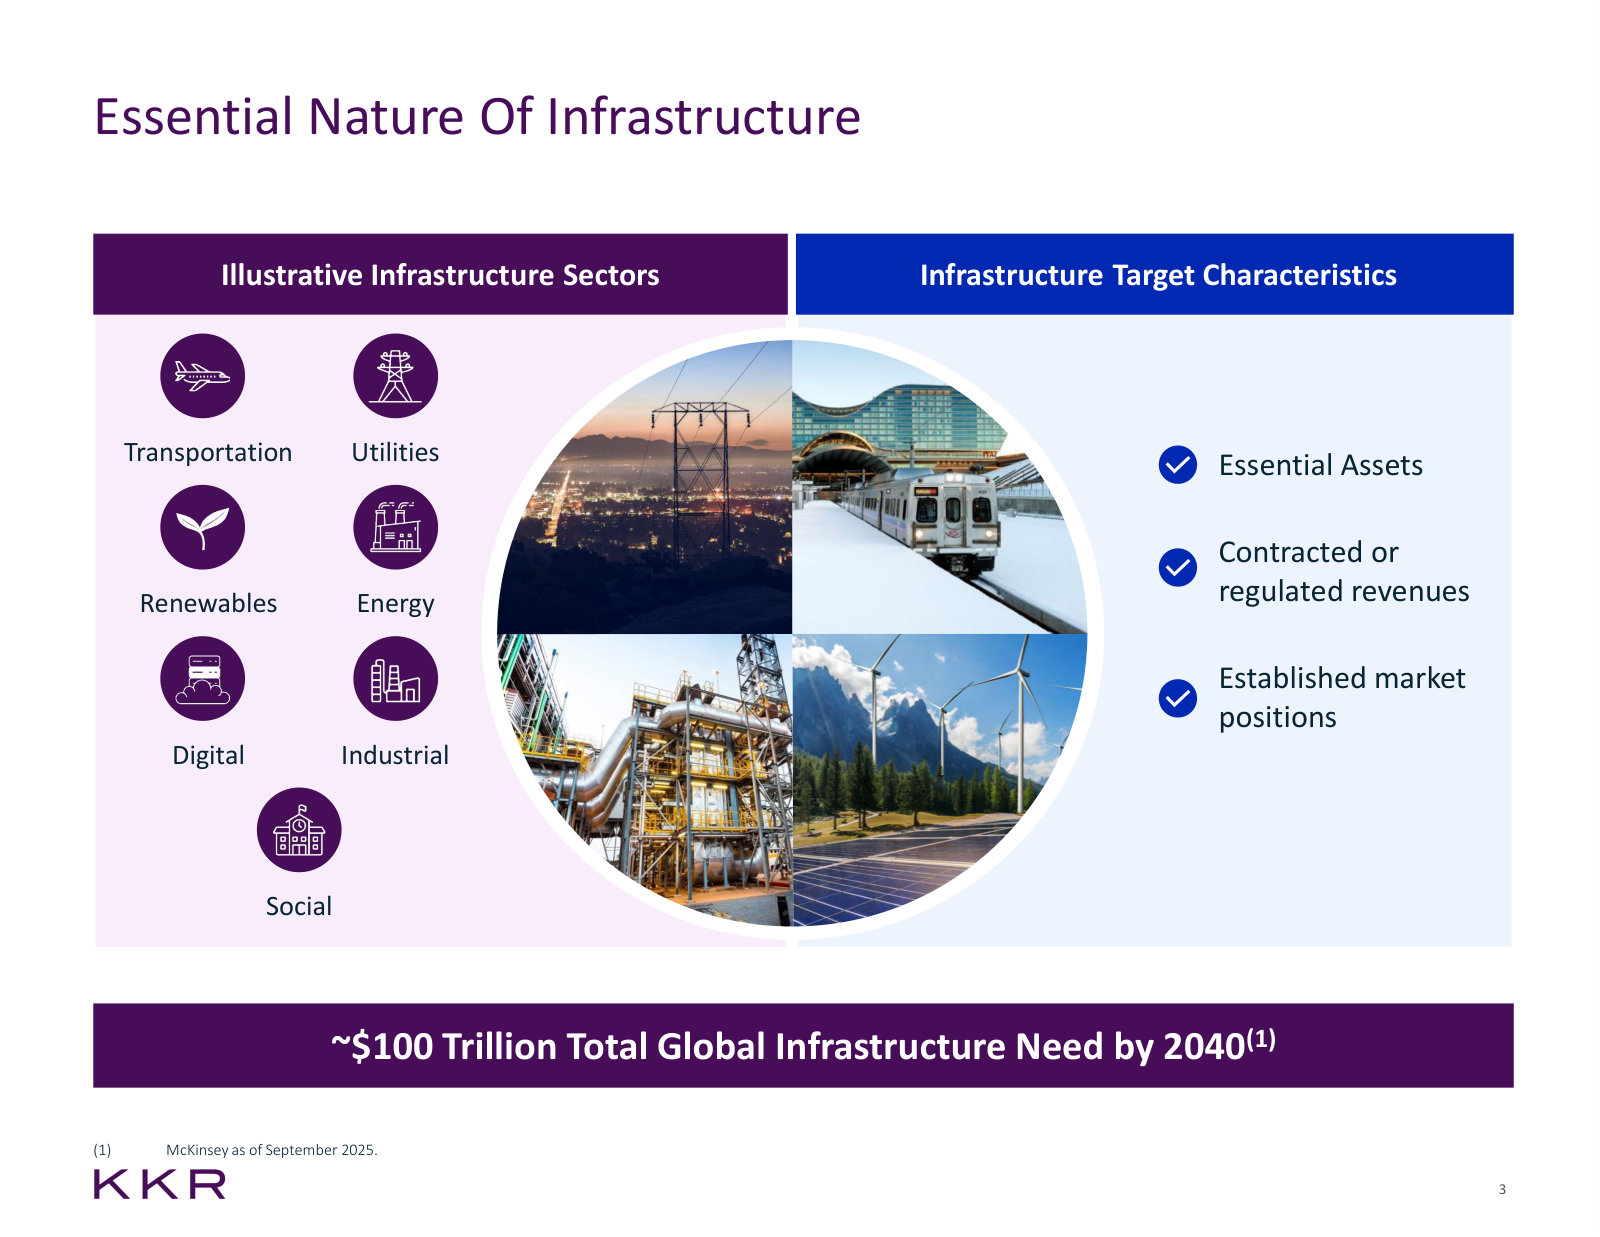
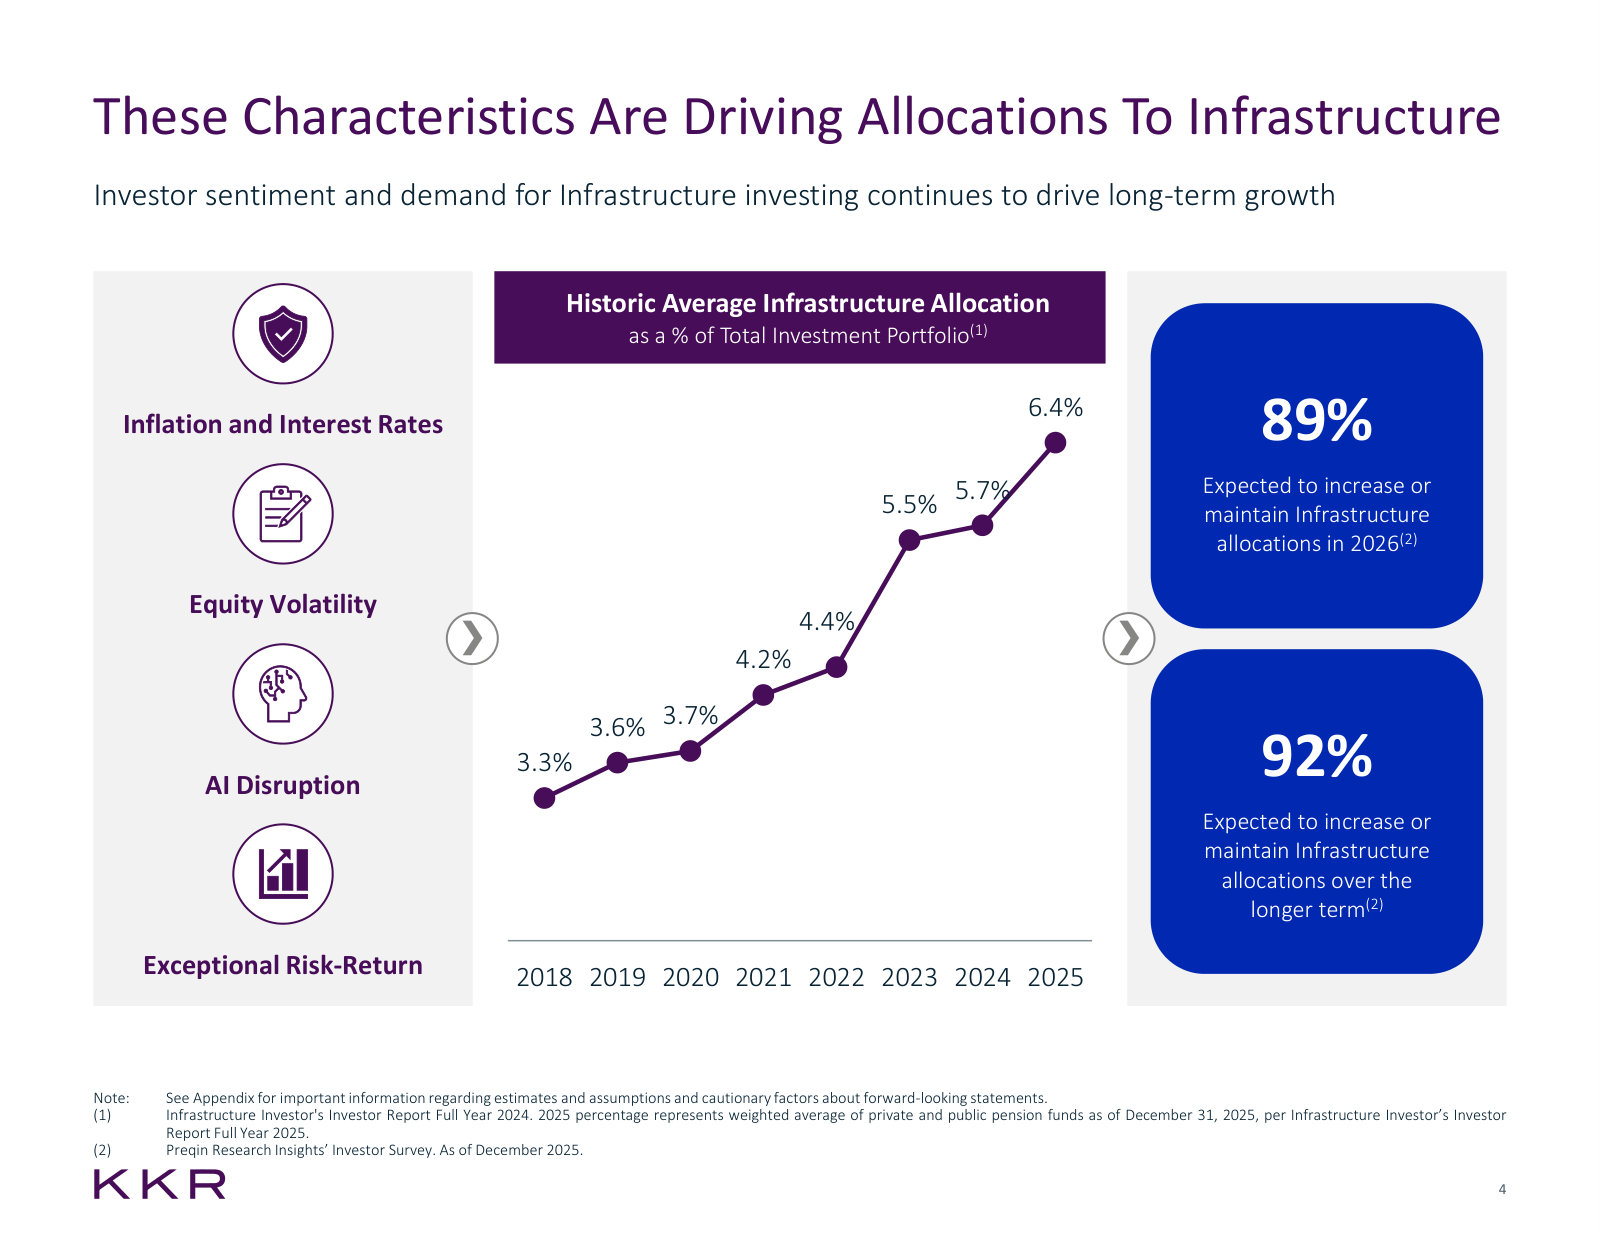
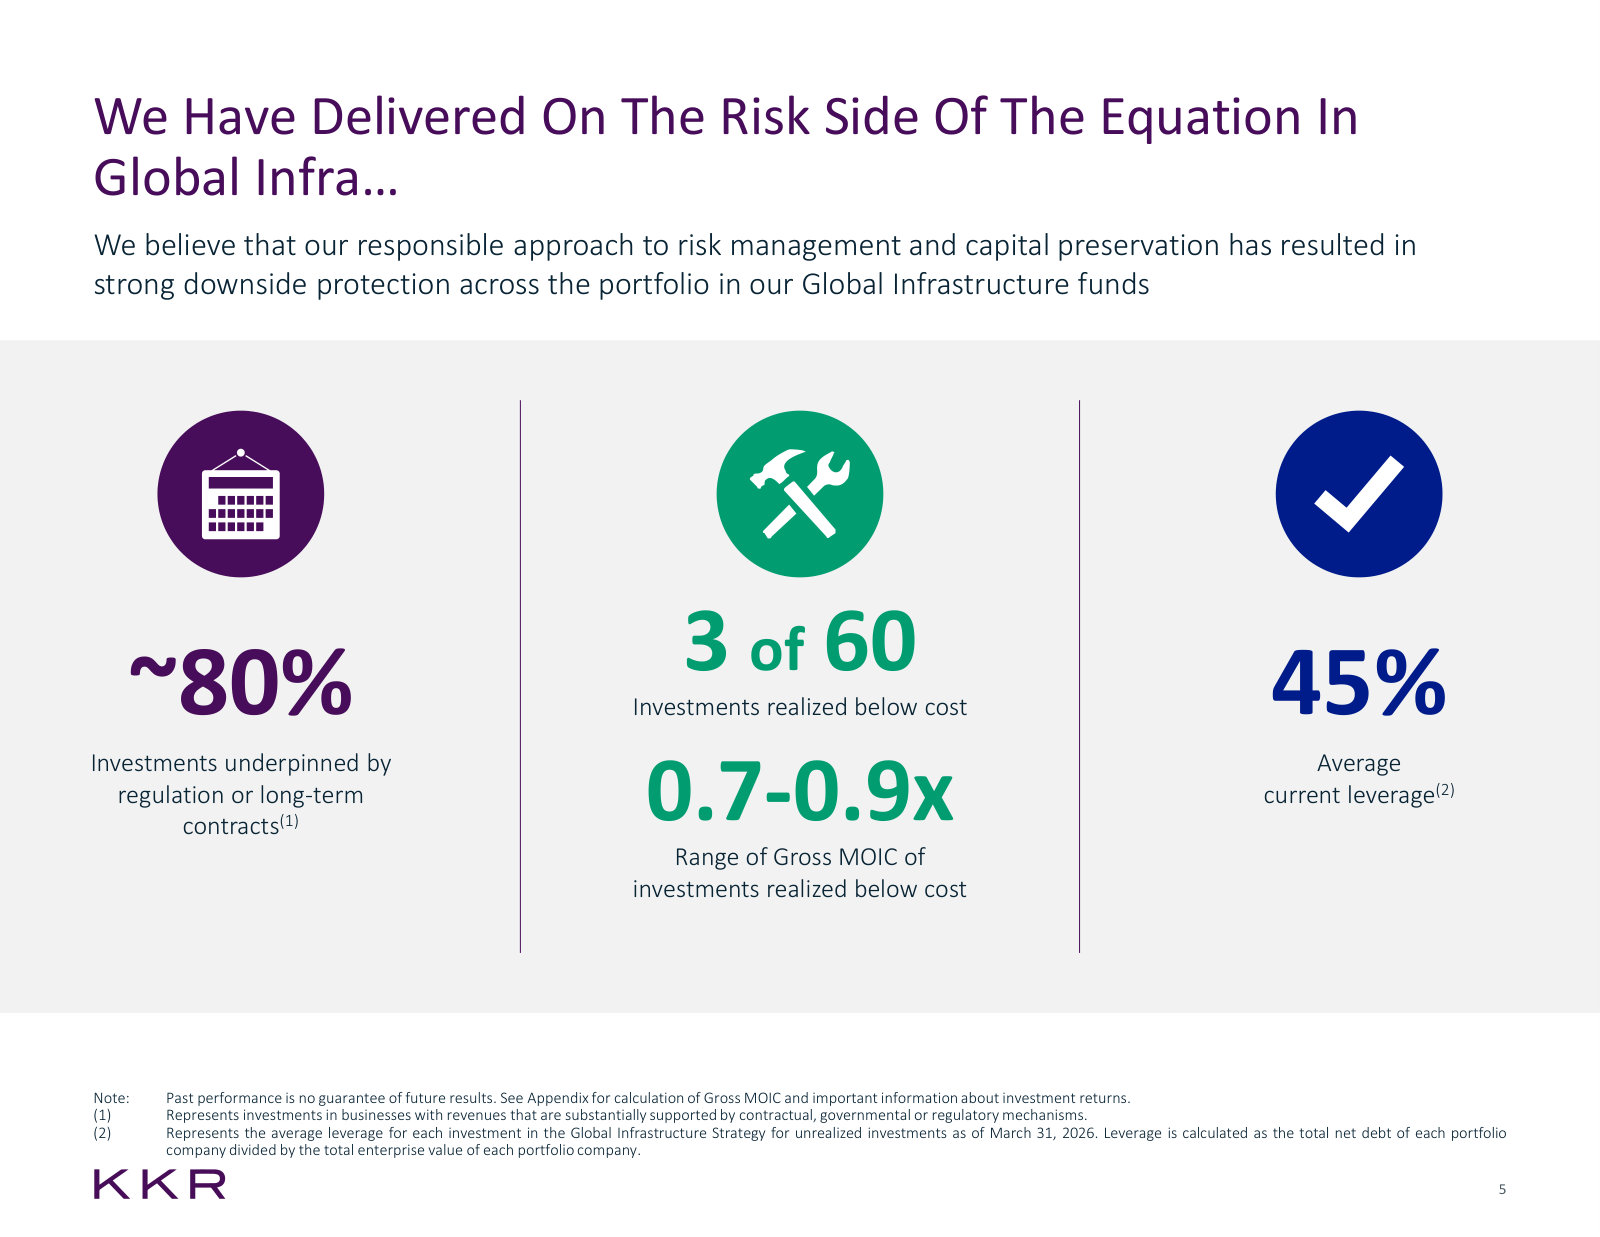
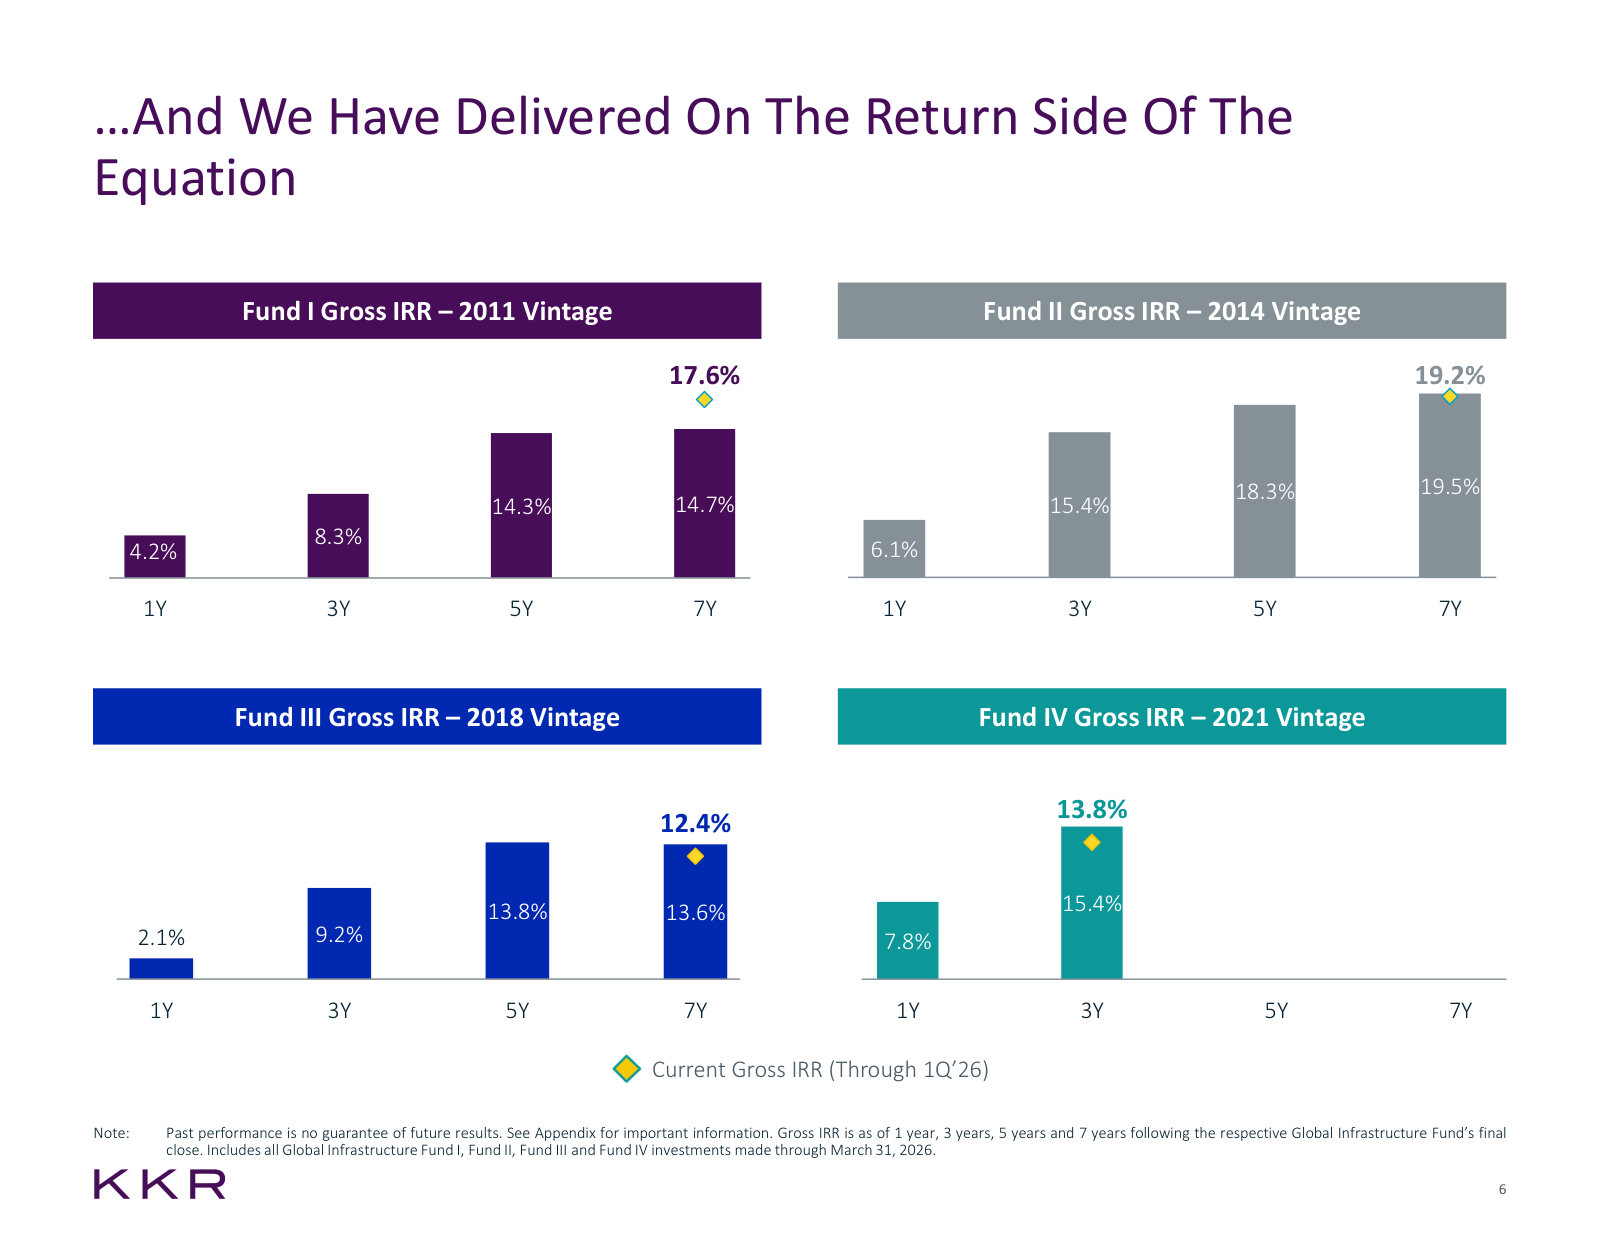
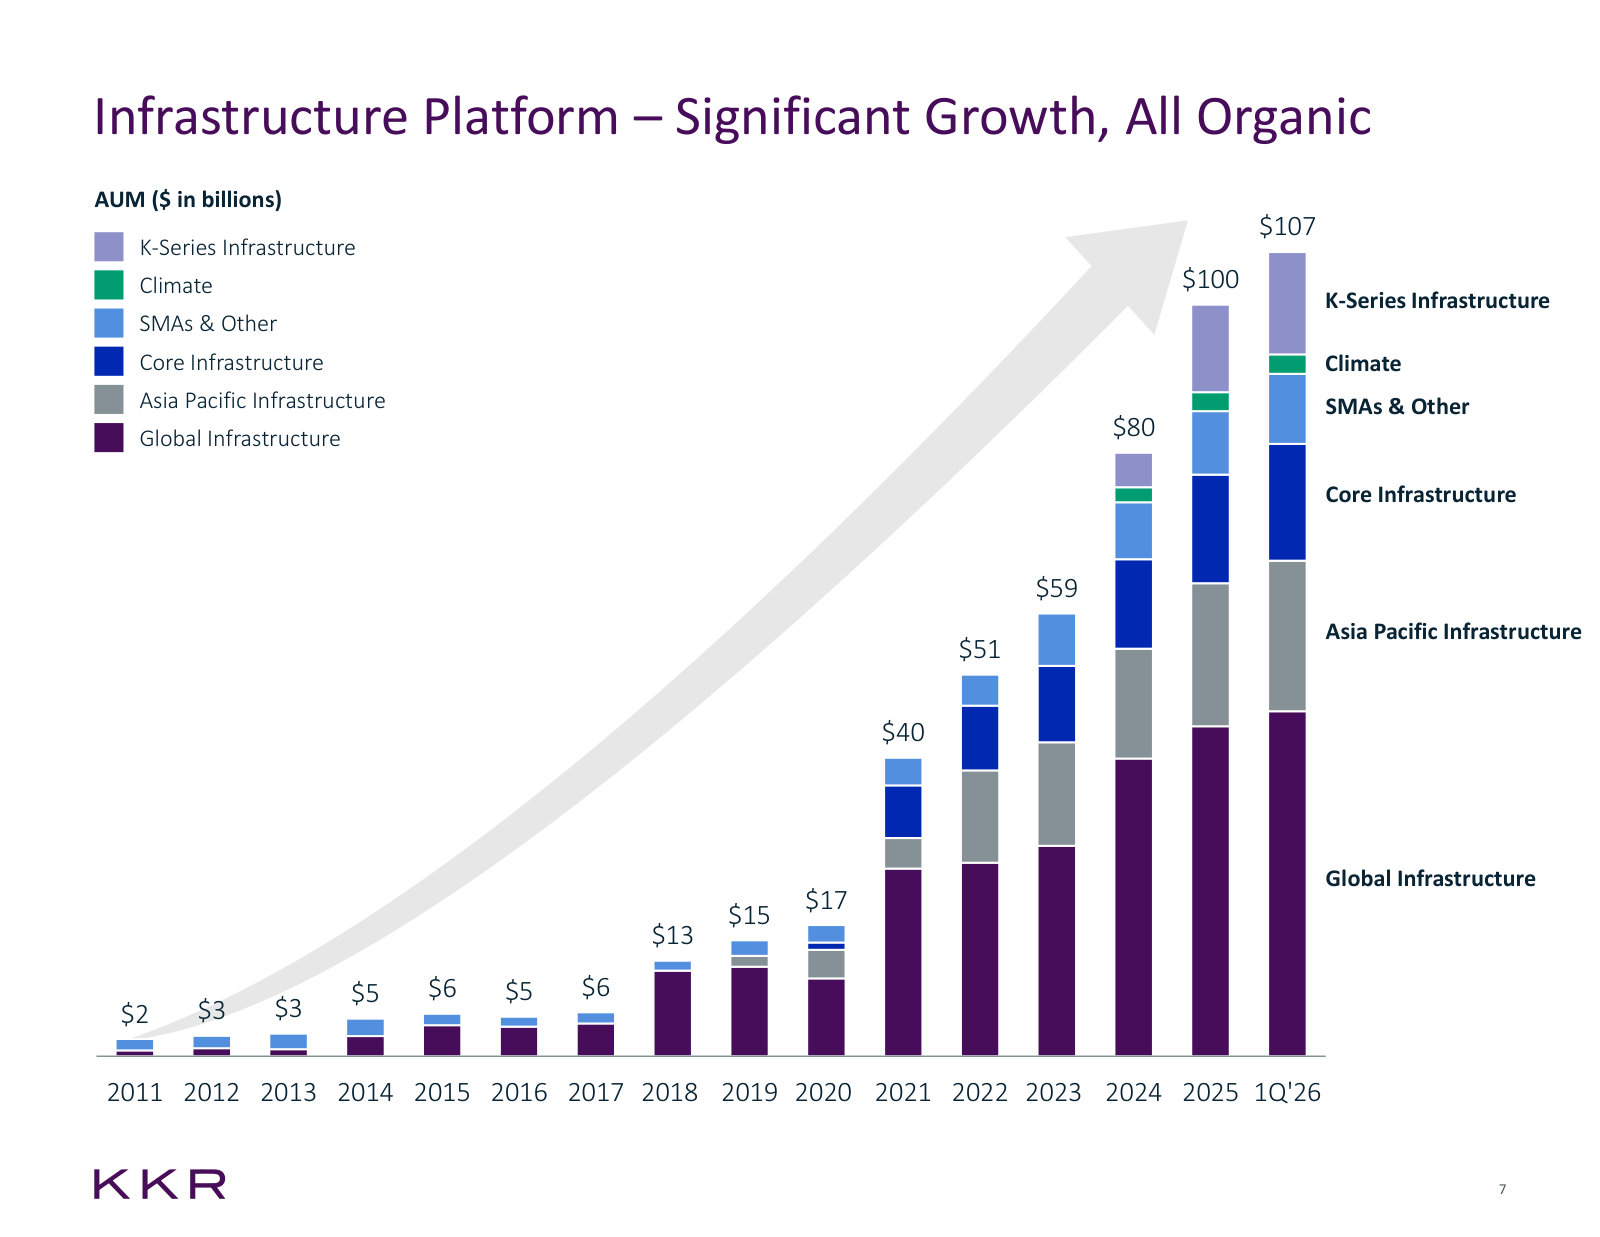
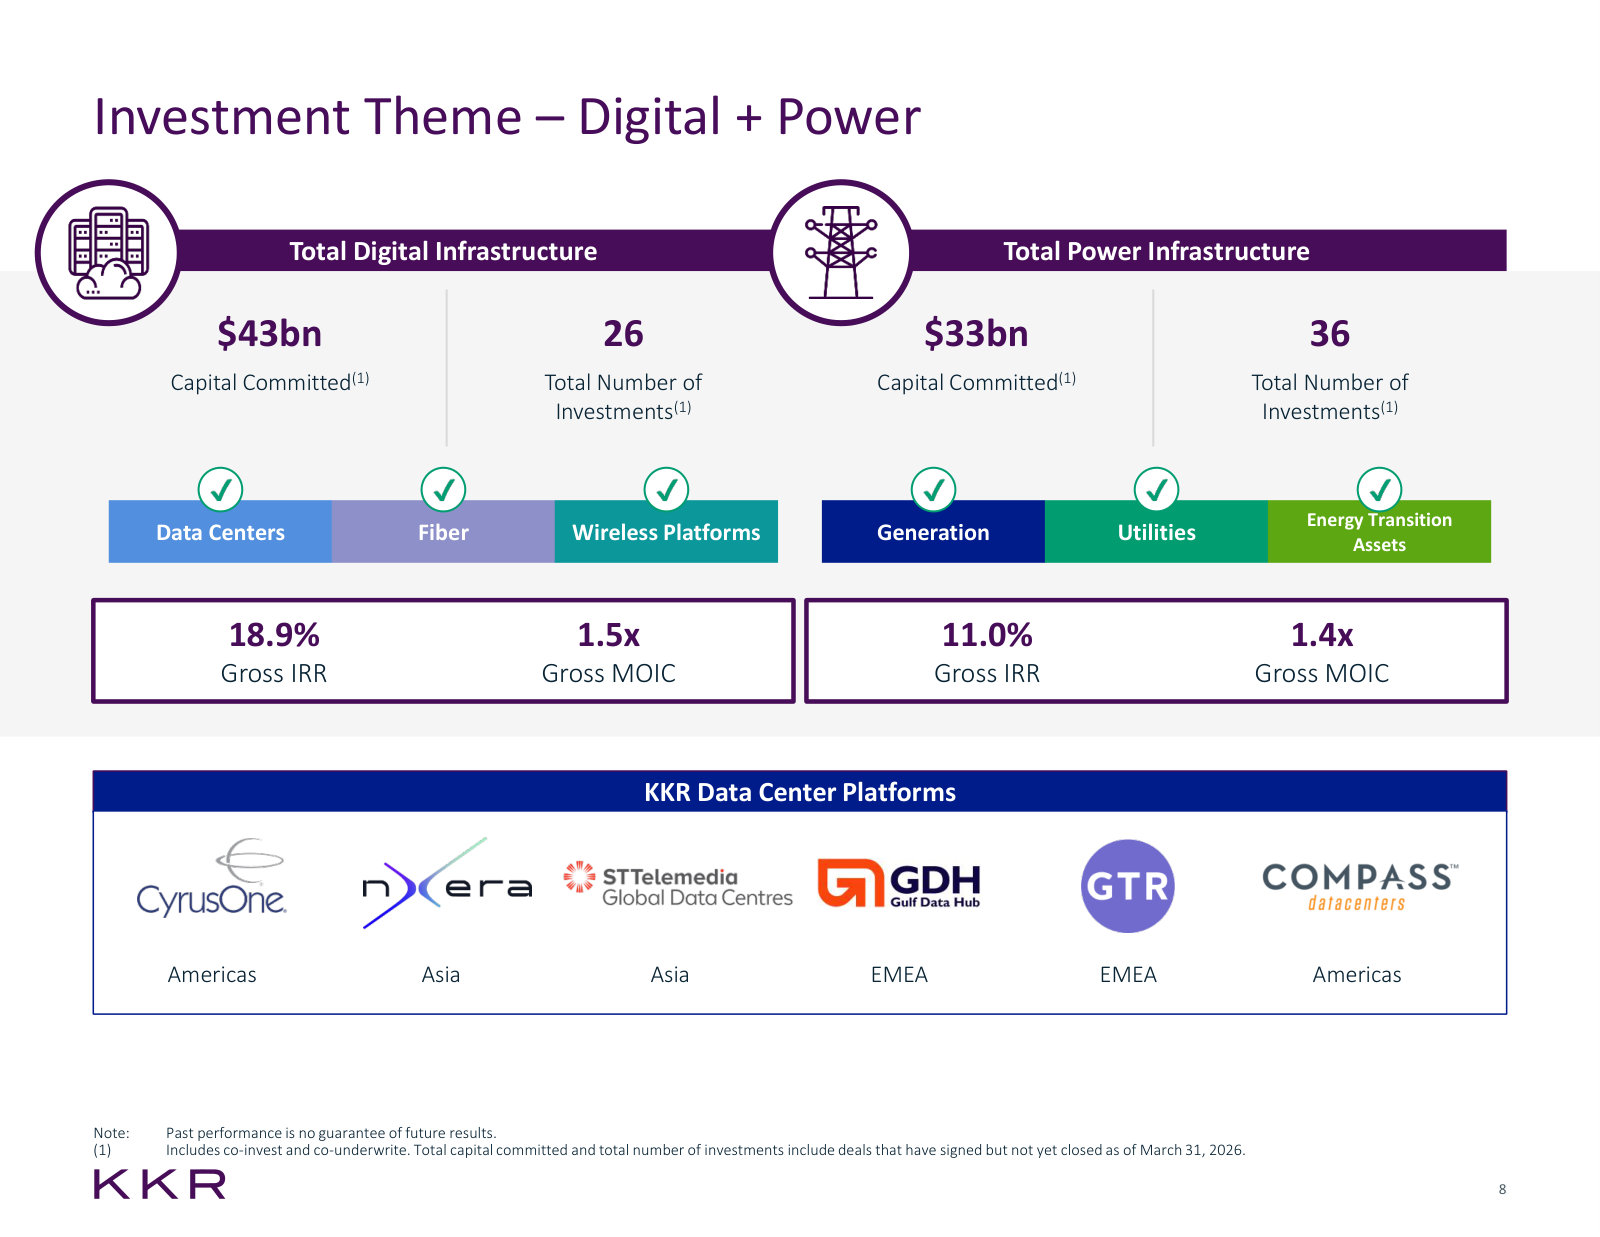
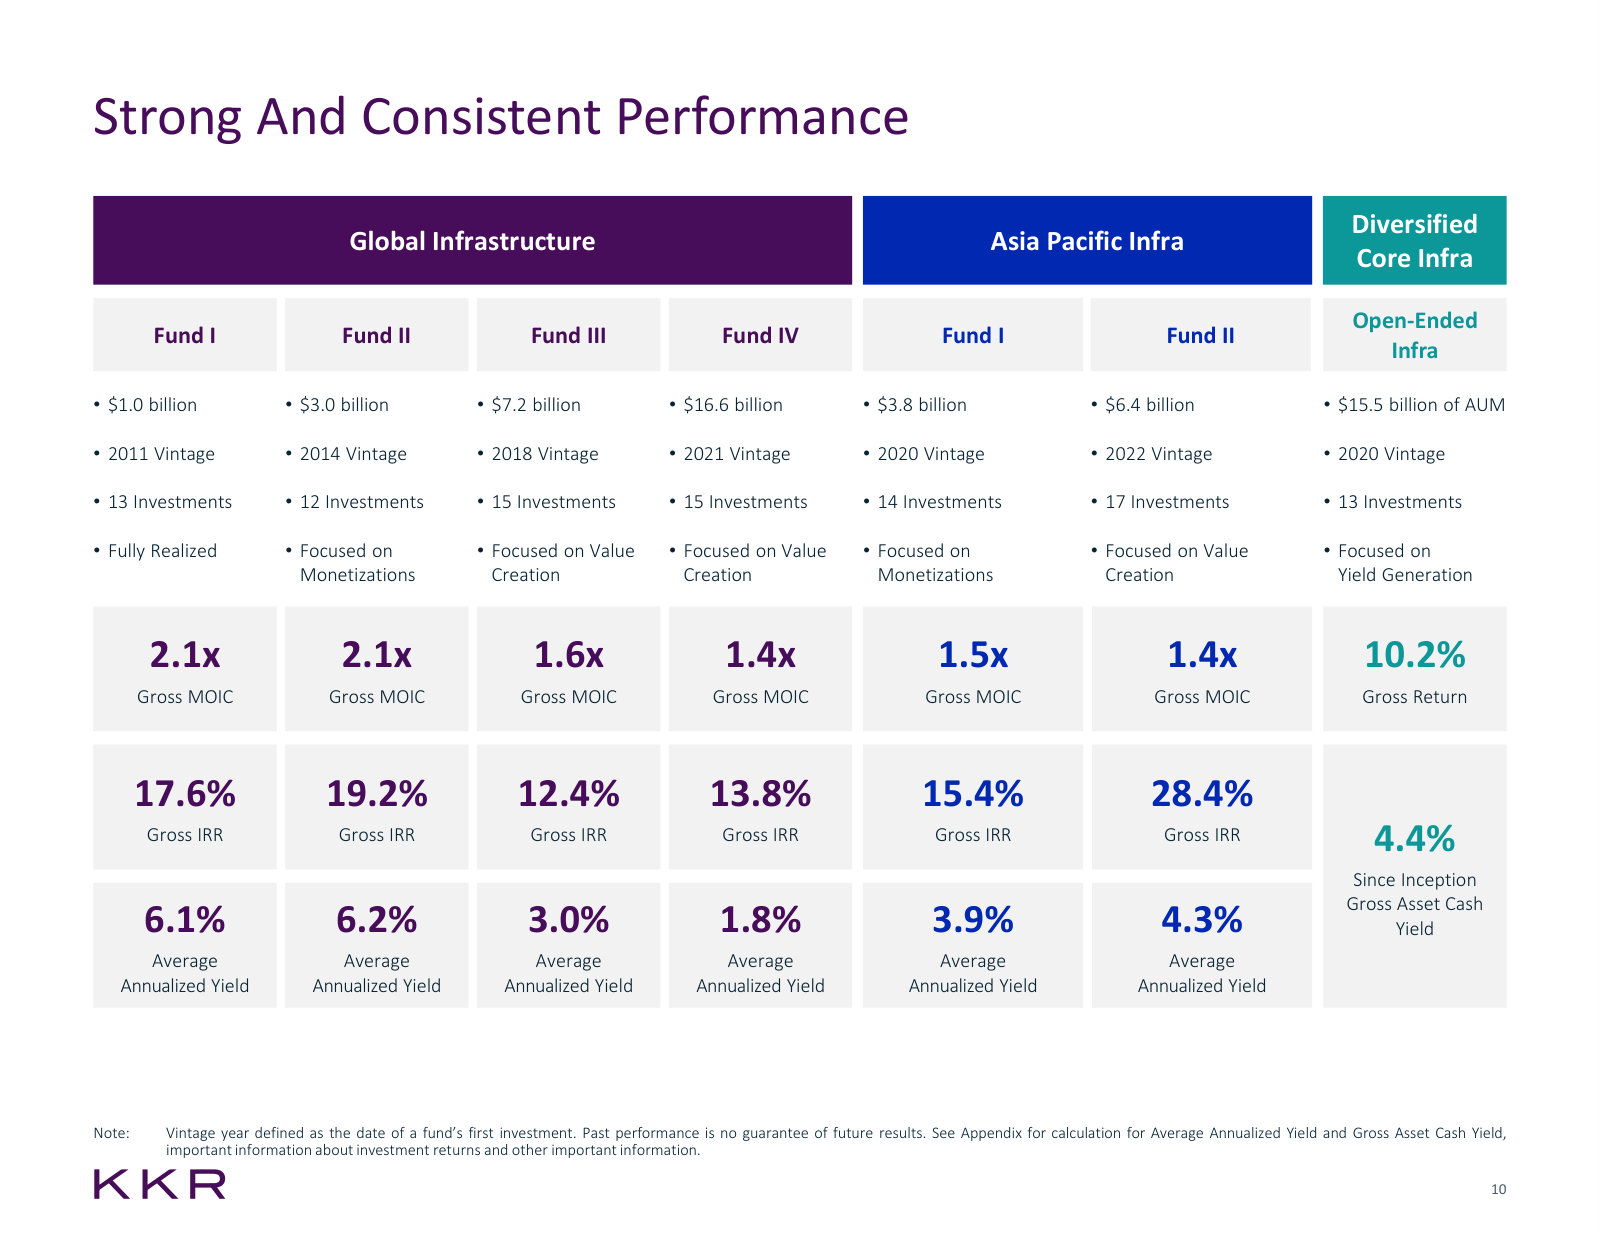
p. 3 — What counts as infrastructure and why — essential assets, contracted or regulated revenue, a ~$100tn global need. · Open the full presentation →p. 4 — Institutional infrastructure allocations have roughly doubled since 2018, and surveys say they keep rising. · Open the full presentation →p. 5 — The downside record: 3 of 60 investments realised below cost, ~80% regulated or contracted, 45% average leverage. · Open the full presentation →p. 6 — Gross IRR by holding period for each of the four global infrastructure vintages, against the mid-teens target. · Open the full presentation →p. 7 — Infrastructure AUM from $2bn in 2011 to $107bn, entirely organic, split by strategy. · Open the full presentation →p. 8 — The current theme — $43bn committed to digital and $33bn to power, with the six data centre platforms KKR owns. · Open the full presentation →p. 10 — Fund by fund: size, vintage, MOIC, IRR and cash yield across all seven infrastructure vehicles. · Open the full presentation →
Overview Presentation – 4Q'25 — 4Q'25 · 51 pages · The full-year 2025 numbers, and the same overview deck as it read before the Arctos acquisition. · Open →
Infrastructure Overview – Barclays Global Financial Services Conference — 2024 · 15 pages · The earlier infrastructure deck, with the CyrusOne case study and the climate strategy launch not in the 2026 version. · Open →
Overview Presentation – 1Q'24 — 1Q'24 · 50 pages · The first overview deck reported on the three-segment basis, right after the 2024 investor day. · Open →
Origination: Global Atlantic and ABF — 2024 · 17 pages · How insurance liabilities are turned into KKR-originated assets, at the point the strategy was being sold to investors. · Open →
Goldman Sachs Financial Services Conference — 2023 · 36 pages · The segment realignment explained to a conference audience — a shorter version of the November announcement. · Open →
Strategic Update — 2023 · 34 pages · The announcement that created today's structure: buying the rest of Global Atlantic and forming Strategic Holdings. · Open →
Private Credit Overview — 2023 · 19 pages · A standalone primer on direct lending and asset-based finance, from before those businesses roughly doubled. · Open →