Full Report
The numbers behind KKR & Co. Inc.: as-reported financial statements and company metrics for FY2021–FY2025, traced to the source filings, opened with the share-price history those statements have to justify. Every linked figure opens the exact page of the filing it was printed on, with the statement row highlighted. Amounts in US$ thousands unless noted.
Reading notes: All figures are in US$ thousands, exactly as KKR prints them on its consolidated statements ('Amounts in Thousands, Except Share and Per Share Data'). Per-share figures are as printed. KKR consolidates the investment funds, CLOs and other vehicles it manages, plus the Global Atlantic insurance companies. Total revenues, total assets and total equity therefore include large amounts attributable to noncontrolling interests; the line 'Net Income (Loss) Attributable to KKR and Co. Inc.' is the figure attributable to common stockholders. FY2021 and FY2022 columns are the LDTI-restated comparatives printed in the FY2023 Form 10-K, so that all five years sit on one accounting basis. The FY2021 balance sheet is the only exception: no restated 31 December 2021 balance sheet is printed anywhere in this corpus, so those cells cite the FY2022 Form 10-K (as originally reported) and are not strictly comparable with FY2022-FY2025. FY2025 total revenues and total expenses are cited to the FY2025 Form 10-K MD A results table (p.88) and the segment-reconciliation table (p.275) respectively: those subtotal rows are present in the filing's Consolidated Statements of Operations on p.159 but were dropped by the text extraction for that page, and a citation must point at a row that is actually readable on the cited page. All other FY2025 income-statement rows cite p.159/p.160 directly.
Share Price — Full Available History — 20 Years
The stock closed at $102.66 on Jul 28, 2026 — up 342% over the window shown (+7.9% a year), trading between $1.96 and $167.07. At that close the stock trades at 44× FY2025 diluted EPS as reported below.
Source: market price feed, monthly closes, sampled from 4,737 source observations, Jan 2007–Jul 2026. Price return only, excludes dividends.
FY2025 at a Glance
Revenue (US$ thousands)
Net income (US$ thousands)
Diluted EPS
Source: FY2025 consolidated statements [1] [2] [3] [4]. Click any linked figure to open the filing page with the row highlighted.
Revenues by Source
| Revenues by Source | FY2021 | FY2022 | FY2023 | FY2024 | FY2025 |
|---|---|---|---|---|---|
| Fees and Other | 2,850,154 | 2,821,627 | 2,963,869 | 3,653,962 | 4,064,273 |
| Capital Allocation-Based Income (Loss) | 6,842,414 | (2,500,509) | 2,843,437 | 3,558,284 | 3,771,235 |
| Net Premiums | 2,226,078 | 1,182,461 | 1,975,675 | 7,898,834 | 3,397,186 |
| Policy Fees | 1,137,805 | 1,261,721 | 1,260,249 | 1,377,686 | 1,350,814 |
| Net Investment Income | 2,845,623 | 4,118,246 | 5,514,902 | 6,574,608 | 7,665,106 |
| Net Investment-Related Gains (Losses) | 203,753 | (1,318,490) | (235,262) | (1,423,086) | (1,041,070) |
| Other Income | 120,213 | 139,124 | 176,442 | 238,410 | 256,763 |
| Total Revenues | 16,226,040 | 5,704,180 | 14,499,312 | 21,878,698 | 19,464,307 |
| Total Revenues growth, derived | — | -64.8% | +154.2% | +50.9% | -11.0% |
Source: Consolidated Statements of Operations - revenue disaggregation between the Asset Management and Strategic Holdings segments and the Insurance (Global Atlantic) segment, as reported. [3] [4] [5] [6]. Click any linked figure to open the filing page with the row highlighted.
Segment and Non-GAAP Earnings
| Segment and Non-GAAP Earnings | FY2021 | FY2022 | FY2023 | FY2024 | FY2025 |
|---|---|---|---|---|---|
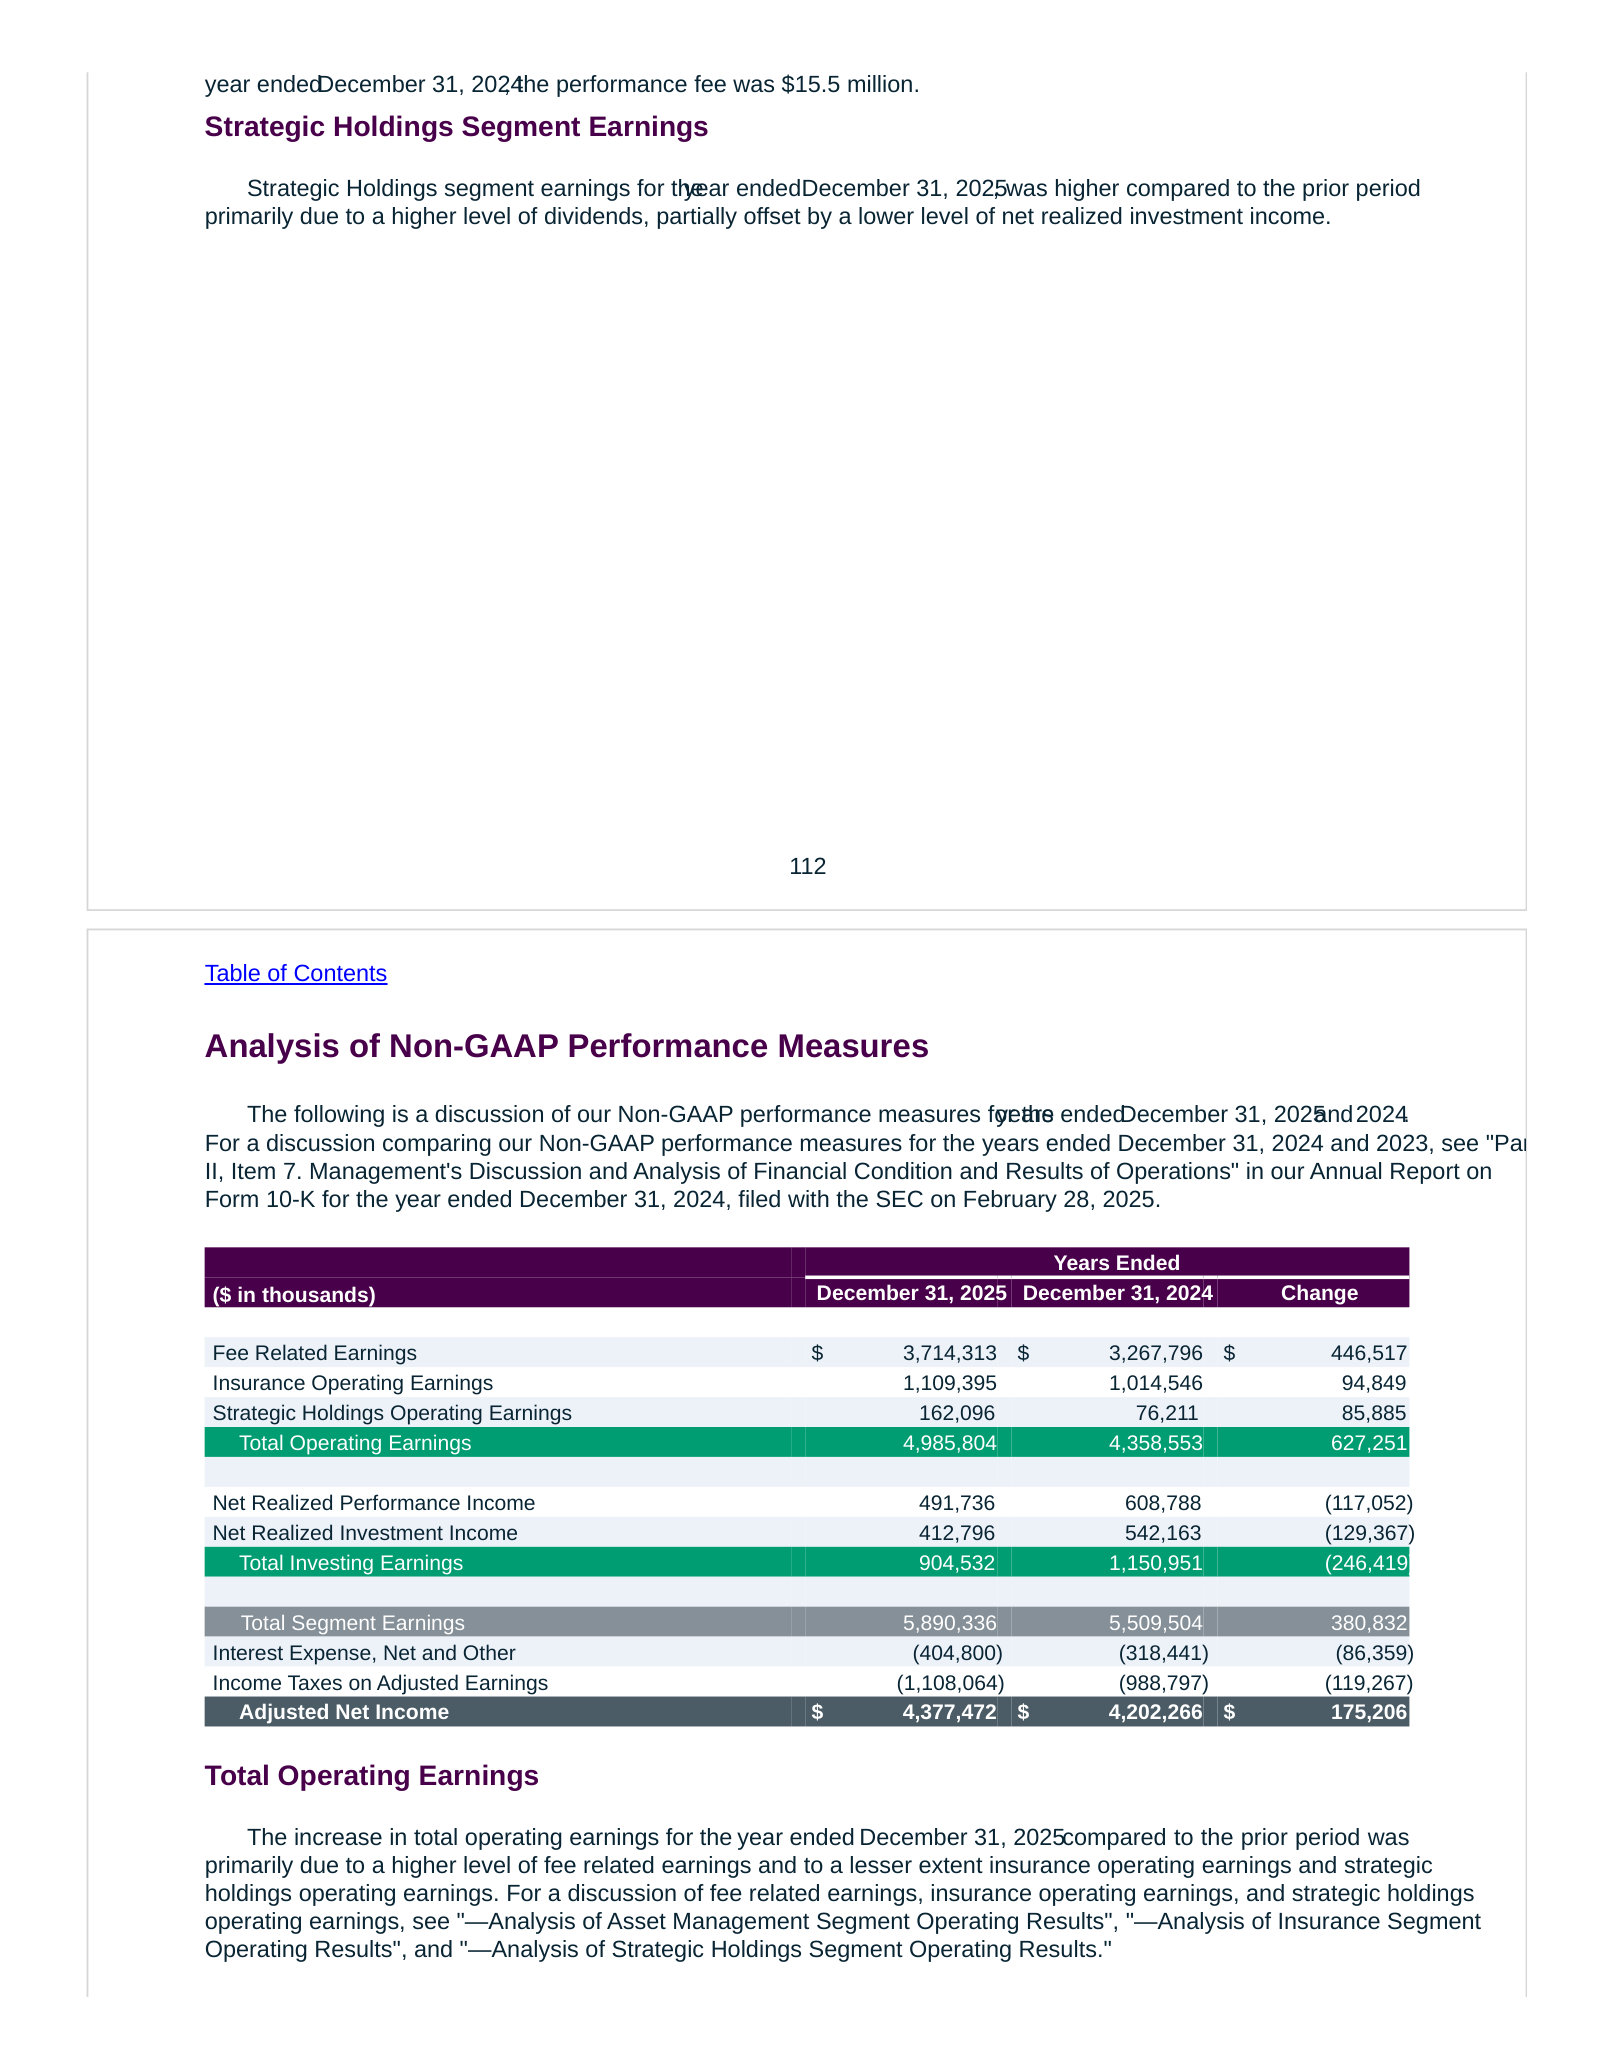
| Fee Related Earnings | 1,969,991 | 2,167,351 | 2,383,786 | 3,267,796 | 3,714,313 |
| Insurance Operating Earnings | 775,440 | 724,762 | 816,637 | 1,014,546 | 1,109,395 |
| Strategic Holdings Operating Earnings | — | — | 14,531 | 76,211 | 162,096 |
| Total Operating Earnings | — | — | 3,214,954 | 4,358,553 | 4,985,804 |
| Net Realized Performance Income | — | — | 398,949 | 608,788 | 491,736 |
| Net Realized Investment Income | — | — | 541,441 | 542,163 | 412,796 |
| Total Segment Earnings | — | — | 4,155,344 | 5,509,504 | 5,890,336 |
| Adjusted Net Income | 3,916,090 | 3,512,308 | 3,040,093 | 4,202,266 | 4,377,472 |
Source: Management's Discussion and Analysis - Analysis of Non-GAAP Performance Measures. FY2021-FY2022 Fee Related Earnings, Insurance Operating Earnings and Adjusted Net Income are taken from the FY2023 Form 10-K reconciliation, where the last of these was labelled After-tax Distributable Earnings before KKR renamed the measure. KKR did not report Strategic Holdings as a segment before FY2023. [7] [8] [9]. Click any linked figure to open the filing page with the row highlighted.
Income Statement
Source: Consolidated Statements of Operations (Amounts in Thousands, Except Share and Per Share Data). [1] [2] [3] [4]. Click any linked figure to open the filing page with the row highlighted.
Columns marked E are consensus analyst estimates from S&P Capital IQ (CapIQ), shown alongside reported results for direct comparison; they are not company guidance.
Estimate source: S&P Capital IQ (CapIQ) consensus, as of 2026-07-29. Estimate figures are S&P Capital IQ consensus (vendor data — no filing page links). EPS and net income use the normalized (adjusted) consensus where the street reports it. Consensus revenue sits well below the as-reported line for the last actual year — analysts often model a narrower revenue basis (e.g. net of interest or pass-through costs), so compare trends, not levels. Line-item analyst models (segments, drivers, KPIs) are in the Visible Alpha tab.
Balance Sheet
Source: Consolidated Statements of Financial Condition (Amounts in Thousands). Balances are fully consolidated and include the assets and liabilities of KKR's consolidated funds, CFEs and the Global Atlantic insurance companies. [10] [11] [12] [13]. Click any linked figure to open the filing page with the row highlighted.
Cash Flow
Source: Consolidated Statements of Cash Flows (Amounts in Thousands). Purchases and sales of investments by the consolidated funds run through operating activities, which is why operating cash flow is structurally negative in fund-raising years. [14] [15] [16] [17]. Click any linked figure to open the filing page with the row highlighted.
Fee Engine - Asset Management Segment
| Fee Engine - Asset Management Segment | FY2021 | FY2022 | FY2023 | FY2024 | FY2025 |
|---|---|---|---|---|---|
| Management Fees | 2,071,440 | 2,656,487 | 3,030,325 | 3,461,381 | 4,100,841 |
| Transaction and Monitoring Fees, Net | 1,004,241 | 775,933 | 720,654 | 1,165,884 | 1,092,577 |
| Fee Related Performance Revenues | 45,852 | 90,665 | 94,427 | 137,992 | 181,784 |
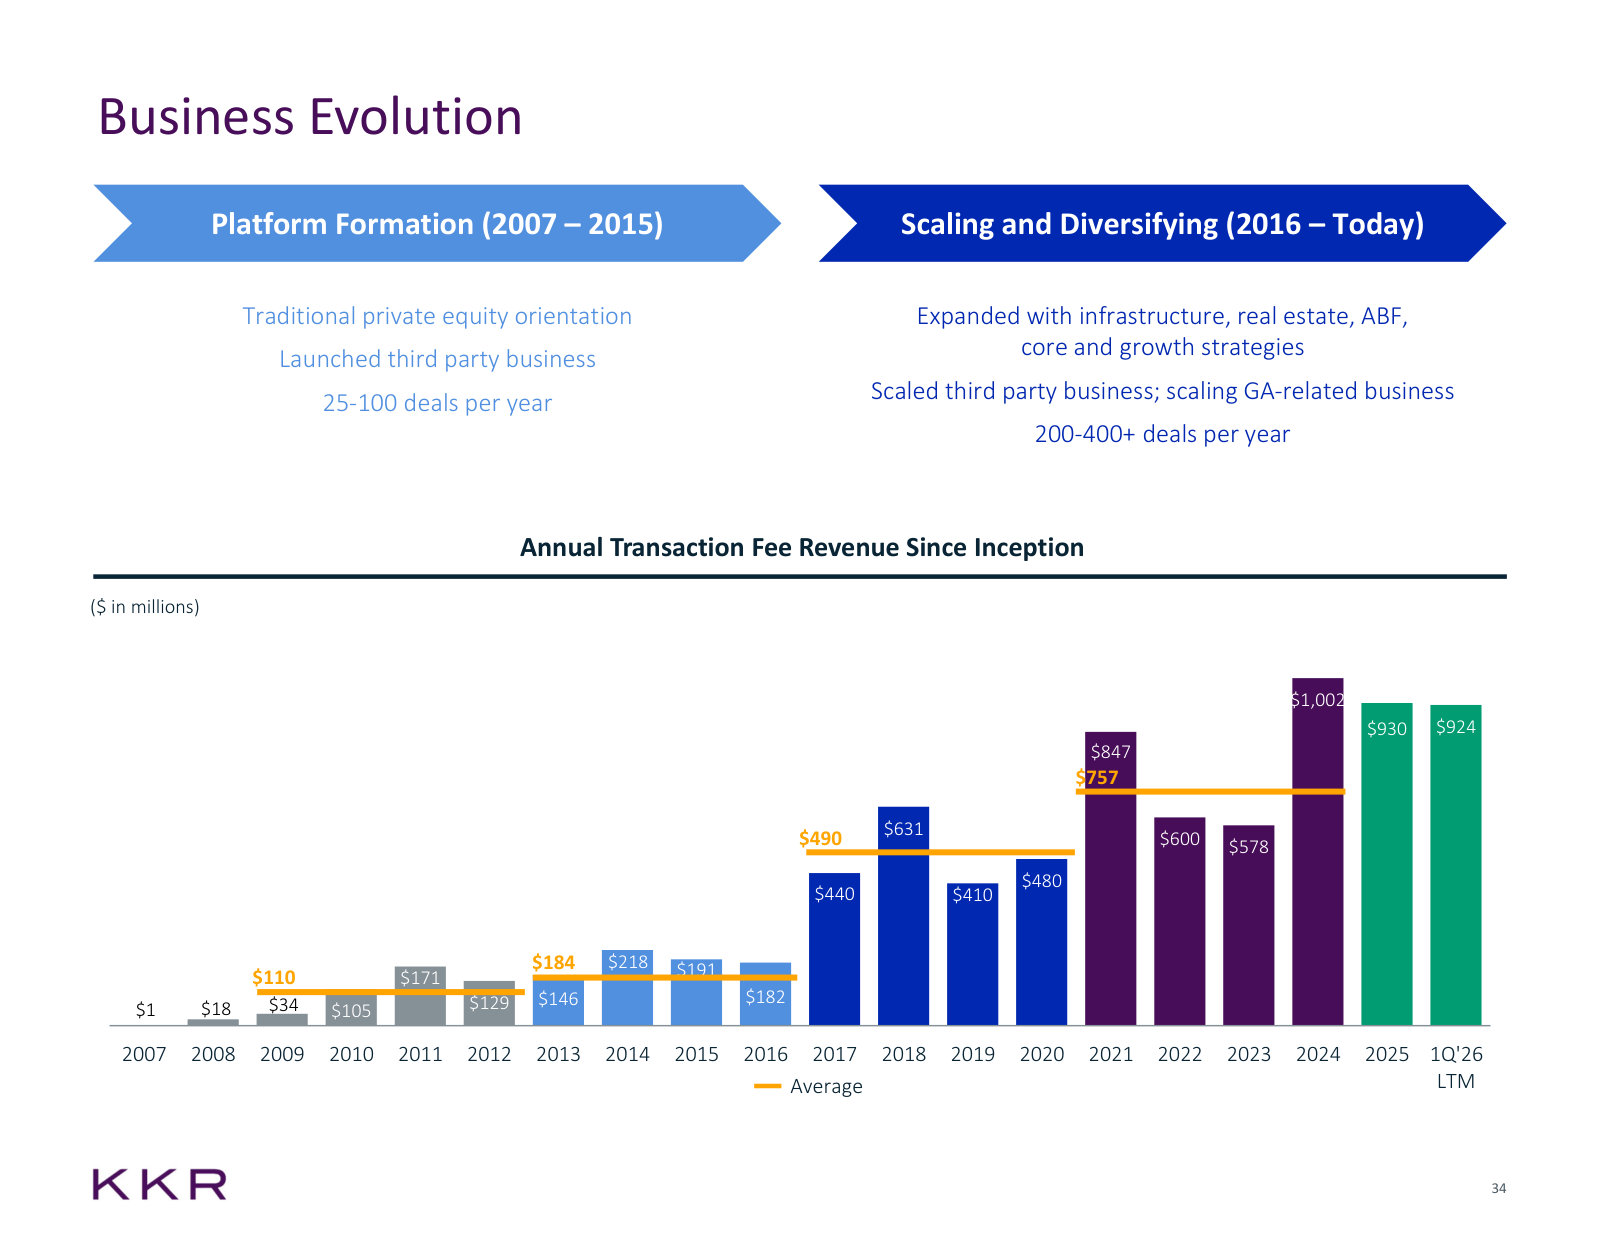
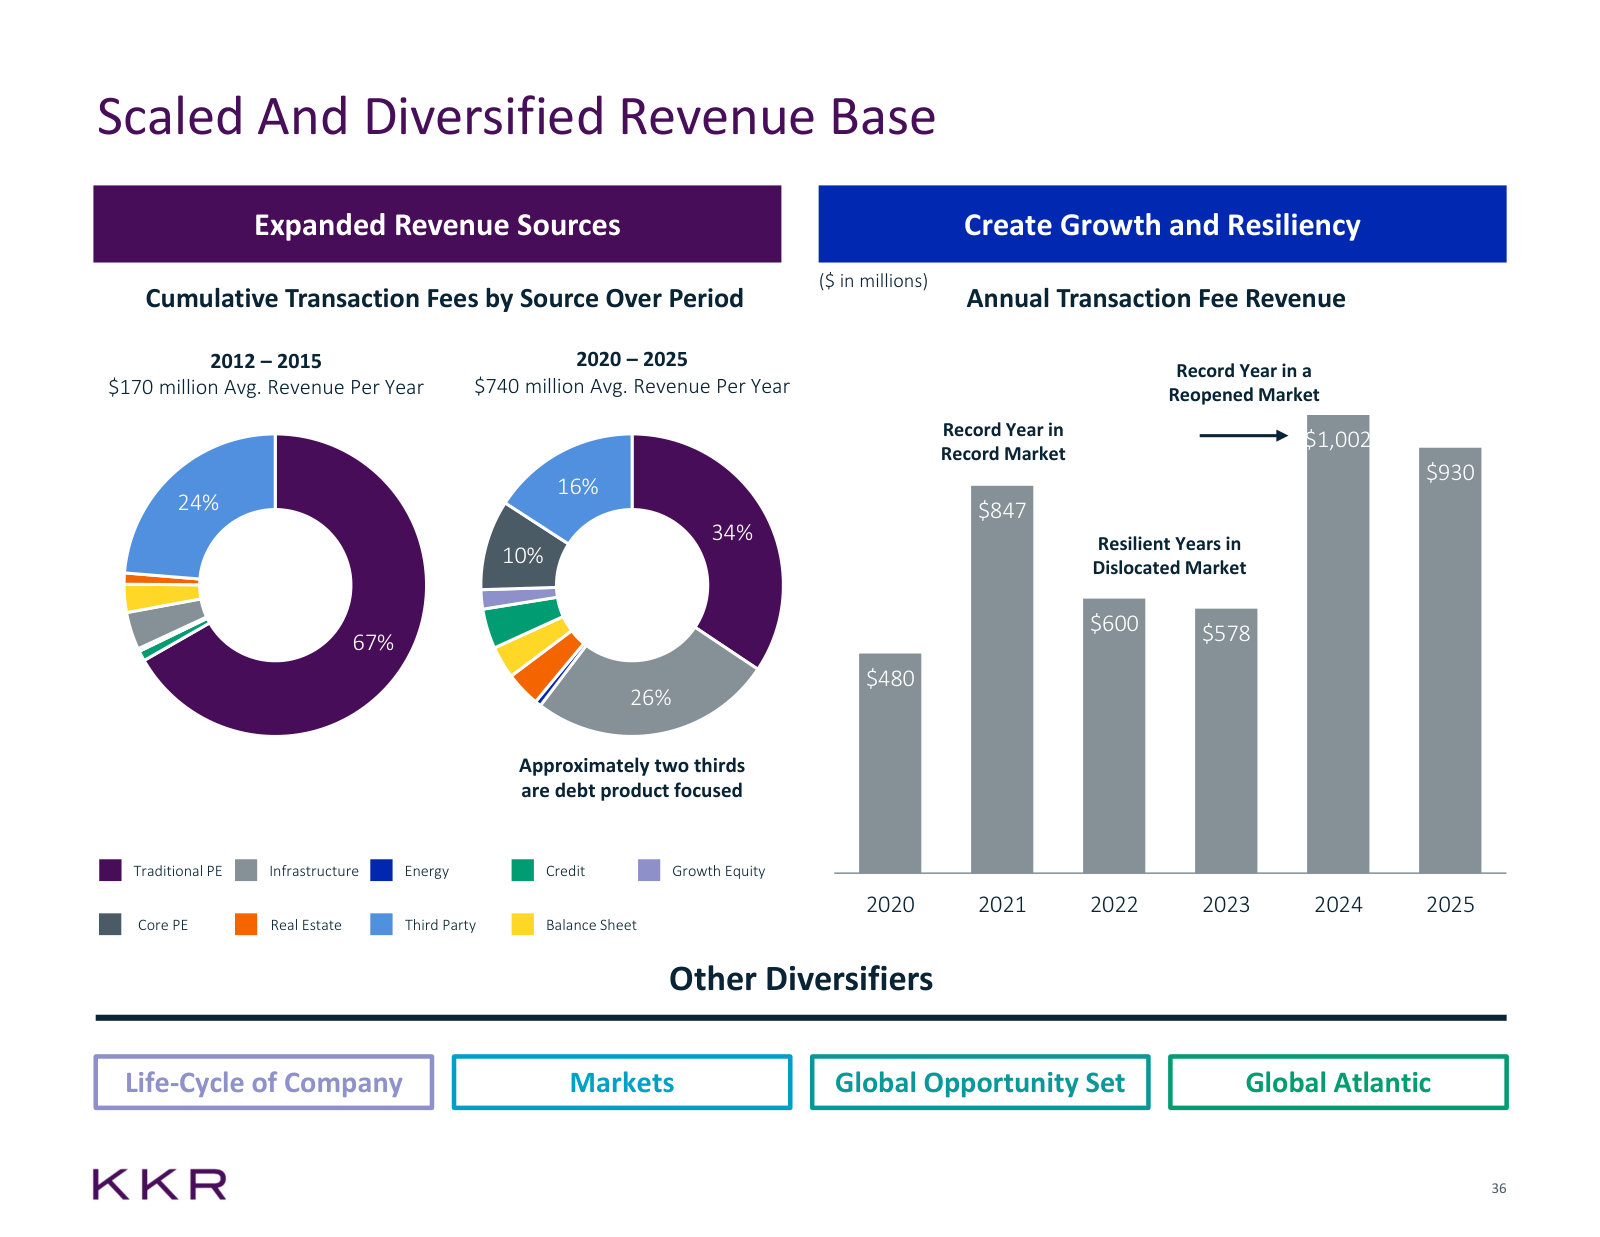
| Capital Markets Transaction Fees | 846,895 | 600,303 | 577,617 | 1,001,763 | 930,143 |
| Capital Markets Transactions Completed | 358 | 240 | 239 | 397 | 404 |
Source: company filings [18] [19] [20] [21]. Click any linked figure to open the filing page with the row highlighted.
Assets Under Management by Business Line
| Assets Under Management by Business Line | FY2021 | FY2022 | FY2023 | FY2024 | FY2025 |
|---|---|---|---|---|---|
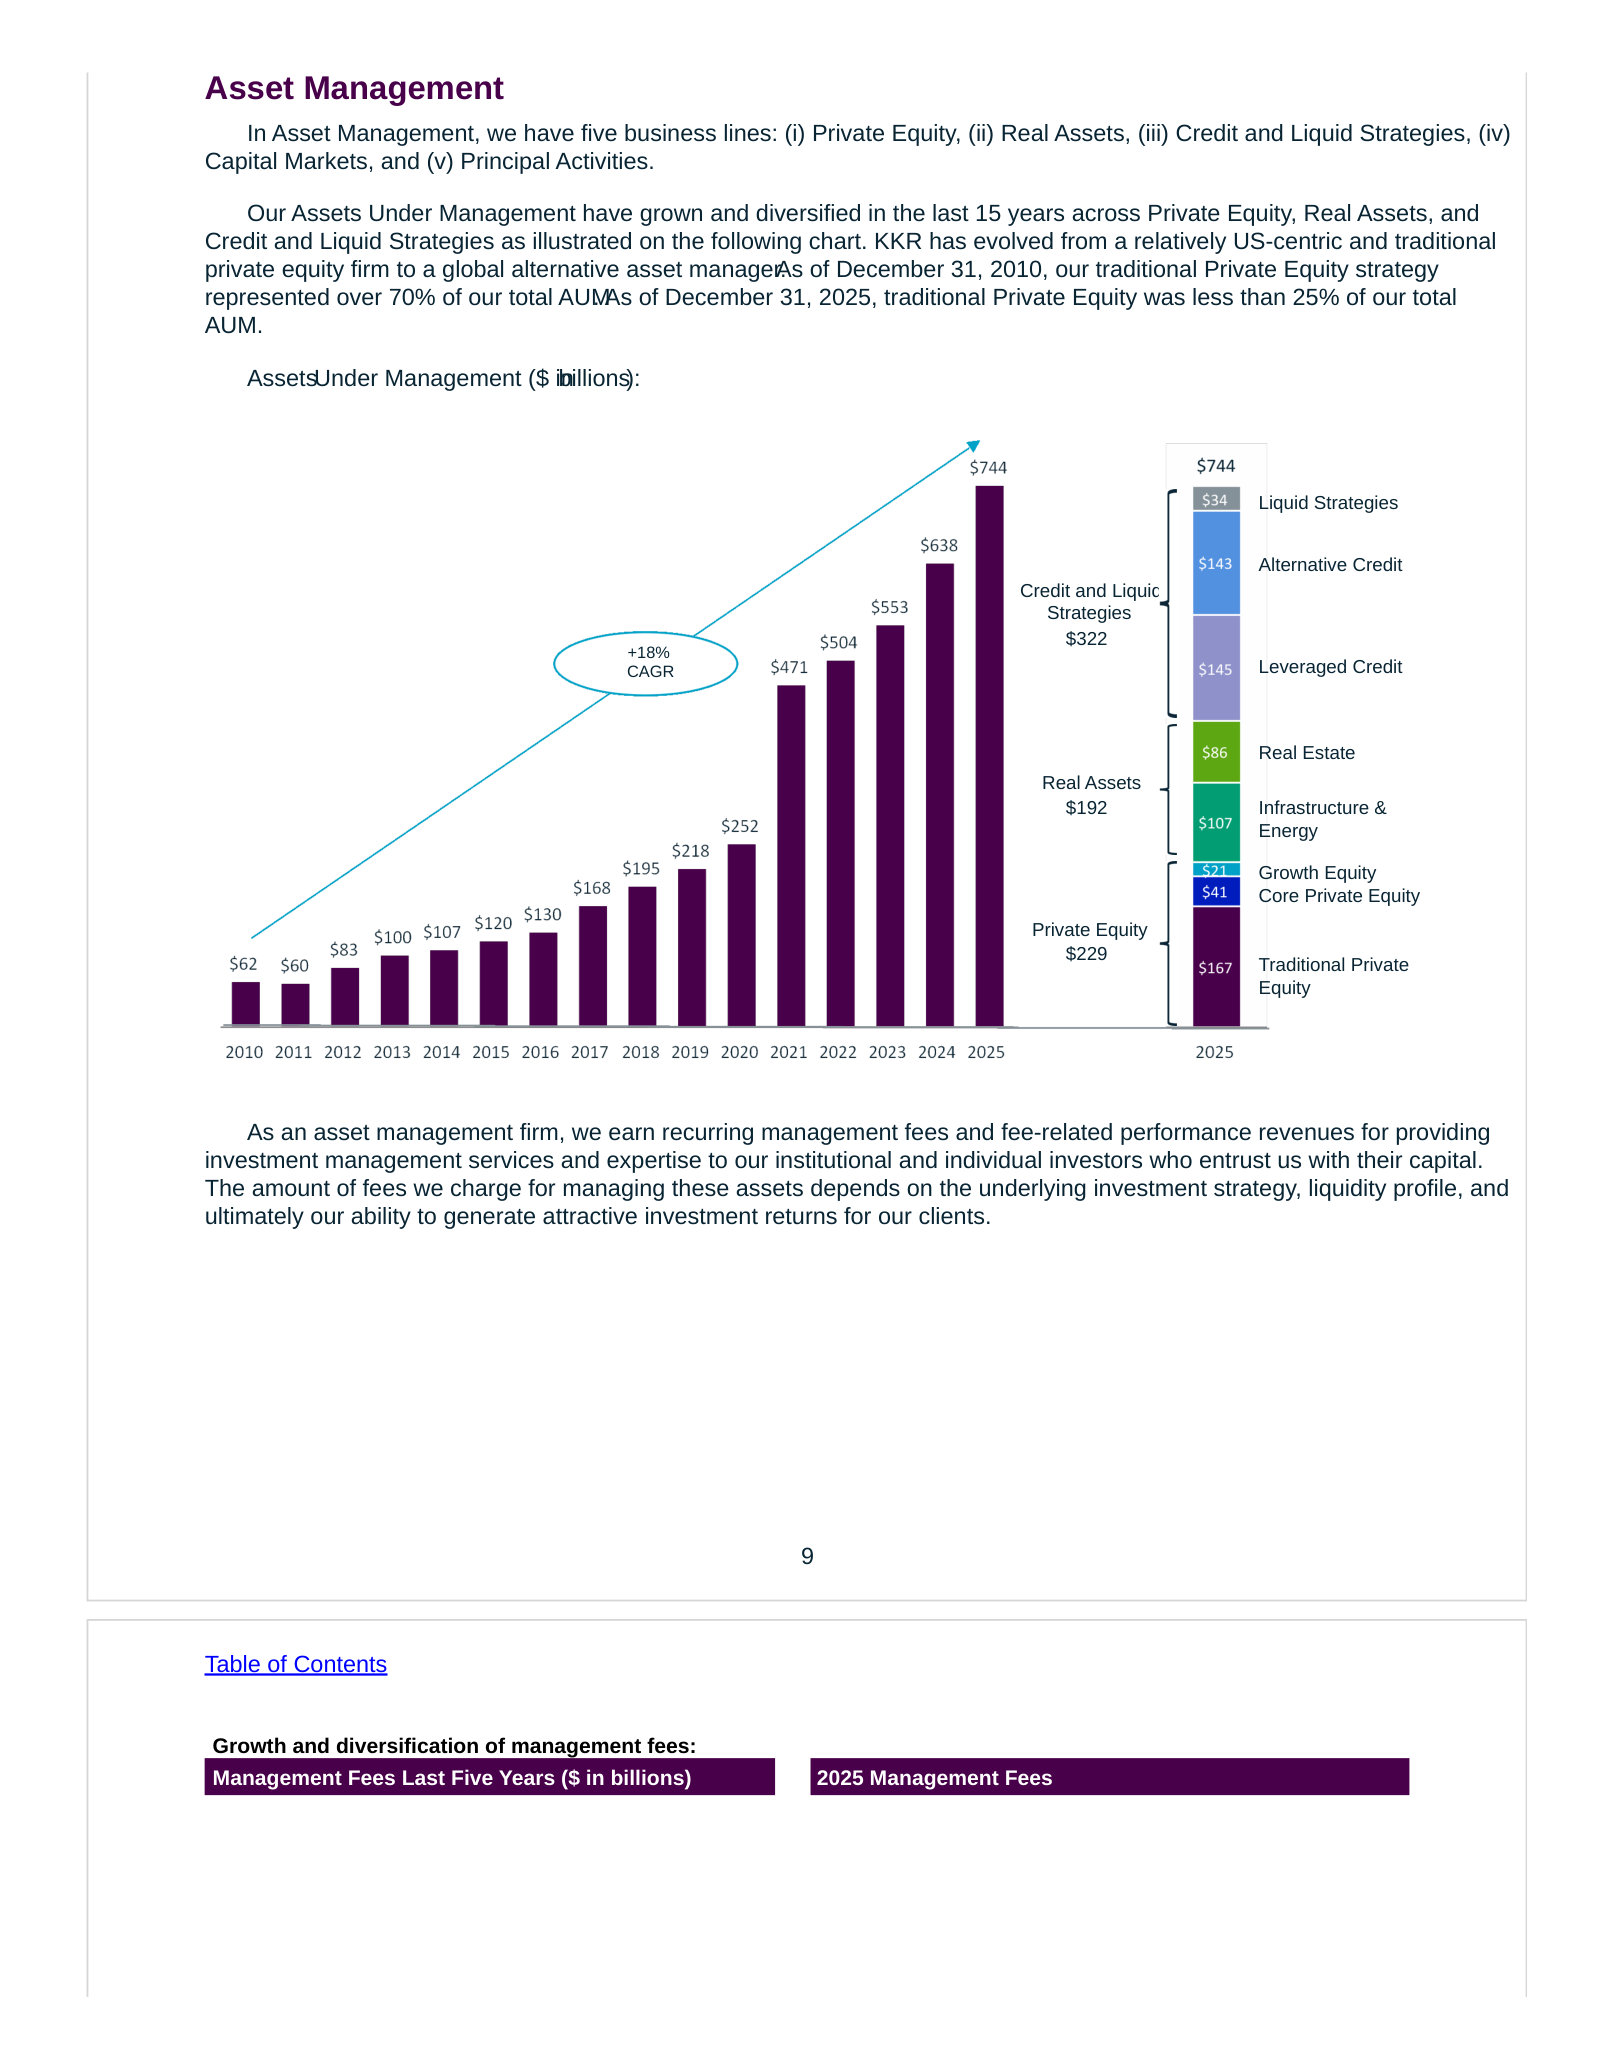
| Private Equity - Assets Under Management | 173,745,000 | 165,147,000 | 176,377,000 | 195,358,000 | 229,374,000 |
| Private Equity - Fee Paying AUM | 87,890,000 | 102,261,000 | 107,726,000 | 119,598,000 | 151,239,000 |
| Real Assets - Assets Under Management | 83,303,000 | 118,592,000 | 130,933,000 | 165,969,000 | 192,480,000 |
| Real Assets - Fee Paying AUM | 66,965,000 | 103,532,000 | 112,254,000 | 139,681,000 | 163,451,000 |
| Credit and Liquid Strategies - Assets Under Management | 213,507,000 | 220,158,000 | 245,491,000 | 276,245,000 | 322,004,000 |
| Credit and Liquid Strategies - Fee Paying AUM | 202,534,000 | 206,130,000 | 226,428,000 | 252,684,000 | 289,454,000 |
Source: company filings [22] [23] [24] [25]. Click any linked figure to open the filing page with the row highlighted.
Capital Formation and Deployment
| Capital Formation and Deployment | FY2021 | FY2022 | FY2023 | FY2024 | FY2025 |
|---|---|---|---|---|---|
| New Capital Raised - Private Equity | — | 18,087,000 | 6,901,000 | 17,660,000 | 27,176,000 |
| New Capital Raised - Real Assets | — | 29,244,000 | 15,984,000 | 39,680,000 | 33,739,000 |
| New Capital Raised - Credit and Liquid Strategies | — | 33,883,000 | 46,581,000 | 56,302,000 | 68,484,000 |
| Capital Invested | 73,318,000 | 71,411,000 | 44,010,000 | 83,570,000 | 94,610,000 |
| Traditional Private Equity Portfolio Appreciation | 46.0% | (14.0%) | 16.0% | 14.0% | 14.0% |
Source: company filings [24] [25] [26] [27]. Click any linked figure to open the filing page with the row highlighted.
Insurance - Global Atlantic
| Insurance - Global Atlantic | FY2021 | FY2022 | FY2023 | FY2024 | FY2025 |
|---|---|---|---|---|---|
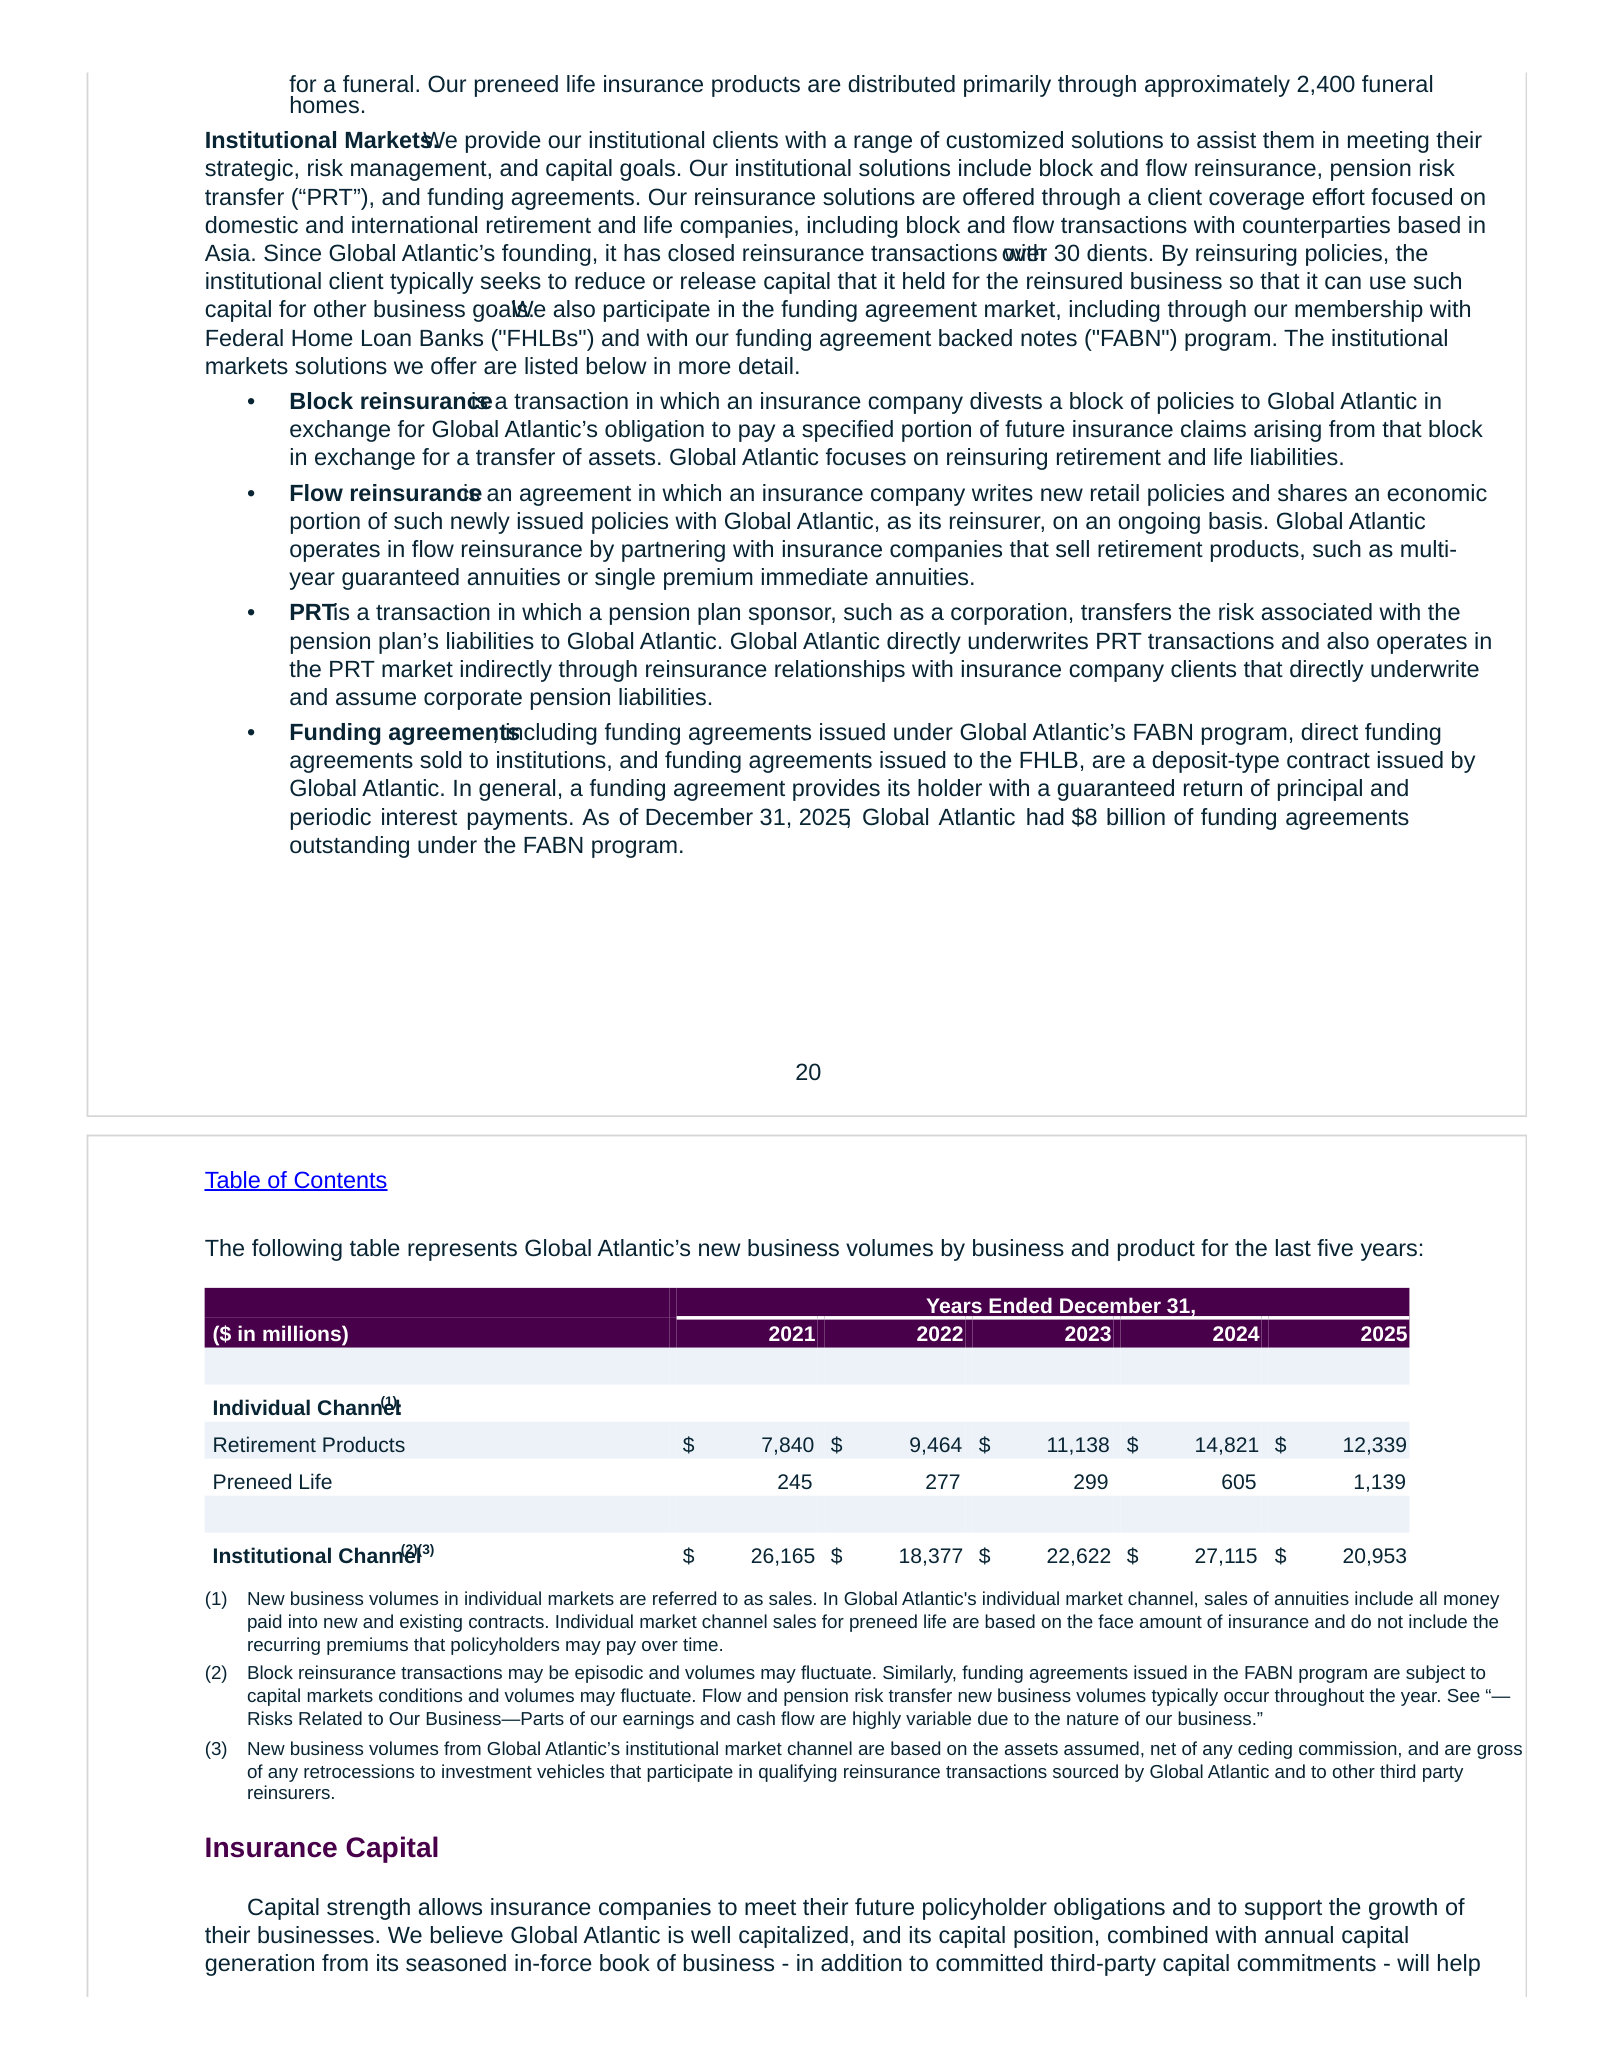
| New Business Volumes - Individual Channel, Retirement Products | 7,840,000 | 9,464,000 | 11,138,000 | 14,821,000 | 12,339,000 |
| New Business Volumes - Individual Channel, Preneed Life | 245,000 | 277,000 | 299,000 | 605,000 | 1,139,000 |
| New Business Volumes - Institutional Channel | 26,165,000 | 18,377,000 | 22,622,000 | 27,115,000 | 20,953,000 |
| Net Cost of Insurance | — | (2,295,133) | (3,283,009) | (4,448,886) | (5,229,343) |
Source: company filings [28] [29] [30] [31]. Click any linked figure to open the filing page with the row highlighted.
Realizations and Book Value
| Realizations and Book Value | FY2021 | FY2022 | FY2023 | FY2024 | FY2025 |
|---|---|---|---|---|---|
| Realized Performance Income - Private Equity | 1,678,753 | 1,903,580 | 938,790 | 1,312,479 | 1,321,116 |
| Realized Performance Income - Real Assets | 97,312 | 113,465 | 67,018 | 218,320 | 260,741 |
| Realized Performance Income - Credit and Liquid Strategies | 365,531 | 159,613 | 59,581 | 291,316 | 297,655 |
| Book Value (Non-GAAP) | 25,388,882 | 24,284,035 | 27,525,304 | 31,055,762 | 33,050,520 |
Source: company filings [32] [33] [34] [35]. Click any linked figure to open the filing page with the row highlighted.
Long-Term Record
| Fiscal year | Total Revenues | Net Income (Loss) Attributable to KKR and Co. Inc. | Net Income (Loss) Per Share of Common Stock - Diluted | Net Cash Provided (Used) by Operating Activities | Total Assets | Assets Under Management |
|---|---|---|---|---|---|---|
| FY2019 | 4,220,900 | 2,005,049 | 3.54 | (5,682,155) | 60,899,319 | — |
| FY2020 | 4,230,891 | 2,002,509 | 3.37 | (5,953,693) | 79,806,502 | — |
| FY2021 | 16,226,040 | 4,732,406 | 7.42 | (7,176,708) | 264,285,440 | 470,555,000 |
| FY2022 | 5,704,180 | (521,664) | (0.79) | (5,279,259) | 275,346,636 | 503,897,000 |
| FY2023 | 14,499,312 | 3,732,261 | 4.09 | (1,493,812) | 317,294,194 | 552,801,000 |
| FY2024 | 21,878,698 | 3,076,245 | 3.28 | 6,649,878 | 360,099,411 | 637,572,000 |
| FY2025 | 19,464,307 | 2,370,463 | 2.34 | 477,760 | 410,144,072 | 743,858,000 |
Source: consolidated statements across filings; older years from the standardized feed [11] [15] [2] [25]. Click any linked figure to open the filing page with the row highlighted.
Operating KPIs
| KPI | FY2021 | FY2022 | FY2023 | FY2024 | FY2025 |
|---|---|---|---|---|---|
| Assets Under Management | 470,555,000 | 503,897,000 | 552,801,000 | 637,572,000 | 743,858,000 |
| Fee Paying Assets Under Management | 357,389,000 | 411,923,000 | 446,408,000 | 511,963,000 | 604,144,000 |
| Uncalled Commitments | 111,822,000 | 107,679,000 | 98,557,000 | 109,555,000 | 118,433,000 |
Source: company-reported operating metrics [25] [36] [37] [38]. Click any linked figure to open the filing page with the row highlighted.
Analyst Consensus
Mean target
Median target
High target
Low target
Street ratings: 12 strong buy, 7 buy, 3 hold. Consensus: Buy.
Estimate source: S&P Capital IQ (CapIQ) consensus, as of 2026-07-29. Estimate figures are S&P Capital IQ consensus (vendor data — no filing page links). EPS and net income use the normalized (adjusted) consensus where the street reports it. Consensus revenue sits well below the as-reported line for the last actual year — analysts often model a narrower revenue basis (e.g. net of interest or pass-through costs), so compare trends, not levels. Line-item analyst models (segments, drivers, KPIs) are in the Visible Alpha tab.
Traceability
494 of 497 figures on this page (99%) link to the filing page where they are printed — click a linked figure to open the source PDF at that page with the row highlighted. Unlinked figures come from standardized data feeds or pre-filing years.
All figures are in US$ thousands, exactly as KKR prints them on its consolidated statements ('Amounts in Thousands, Except Share and Per Share Data'). Per-share figures are as printed.
KKR consolidates the investment funds, CLOs and other vehicles it manages, plus the Global Atlantic insurance companies. Total revenues, total assets and total equity therefore include large amounts attributable to noncontrolling interests; the line 'Net Income (Loss) Attributable to KKR and Co. Inc.' is the figure attributable to common stockholders.
FY2021 and FY2022 columns are the LDTI-restated comparatives printed in the FY2023 Form 10-K, so that all five years sit on one accounting basis. The FY2021 balance sheet is the only exception: no restated 31 December 2021 balance sheet is printed anywhere in this corpus, so those cells cite the FY2022 Form 10-K (as originally reported) and are not strictly comparable with FY2022-FY2025.
FY2025 total revenues and total expenses are cited to the FY2025 Form 10-K MD A results table (p.88) and the segment-reconciliation table (p.275) respectively: those subtotal rows are present in the filing's Consolidated Statements of Operations on p.159 but were dropped by the text extraction for that page, and a citation must point at a row that is actually readable on the cited page. All other FY2025 income-statement rows cite p.159/p.160 directly.
FY2025 Debt Obligations (Asset Management and Strategic Holdings) and Policy Liabilities cite the 31 December 2025 comparative column of the Q1 FY2026 Form 10-Q, because those value cells are blank in the extracted text of the FY2025 Form 10-K balance-sheet page.
AUM, Fee Paying AUM and Uncalled Commitments are printed by KKR in $ millions; they are shown here converted to the tab's US$ thousands scale, and the citation anchors are the millions figures as printed.
Segment and non-GAAP earnings follow KKR's current framework (Fee Related Earnings, Operating Earnings, Total Segment Earnings, Adjusted Net Income), introduced in the FY2024 Form 10-K. For FY2021-FY2022 only the measures that carry across frameworks are shown; Adjusted Net Income for those years is the identically-defined After-tax Distributable Earnings printed in the FY2023 Form 10-K.
The quarterly block covers Q1-Q3 FY2025 and Q1 FY2026. Neither the Forms 10-Q nor the SEC XBRL feed carries a stand-alone fourth-quarter statement, so Q4 is absent; single-quarter cash flows for Q2 and Q3 FY2025 are differences of the printed year-to-date statements and reconcile exactly to data/financials/cash_flow_quarterly.json.
Q1 FY2026 income before taxes, total assets, total liabilities, total equity and operating/investing cash flow are left blank: those rows were not machine-readable on the Q1 FY2026 Form 10-Q pages in this corpus, and unverified cells are omitted rather than filled from the feed.
5 figure(s) differed between the data feed and the filing; the filing value is shown (see the run's metrics/metrics_tab.json for the audit trail).
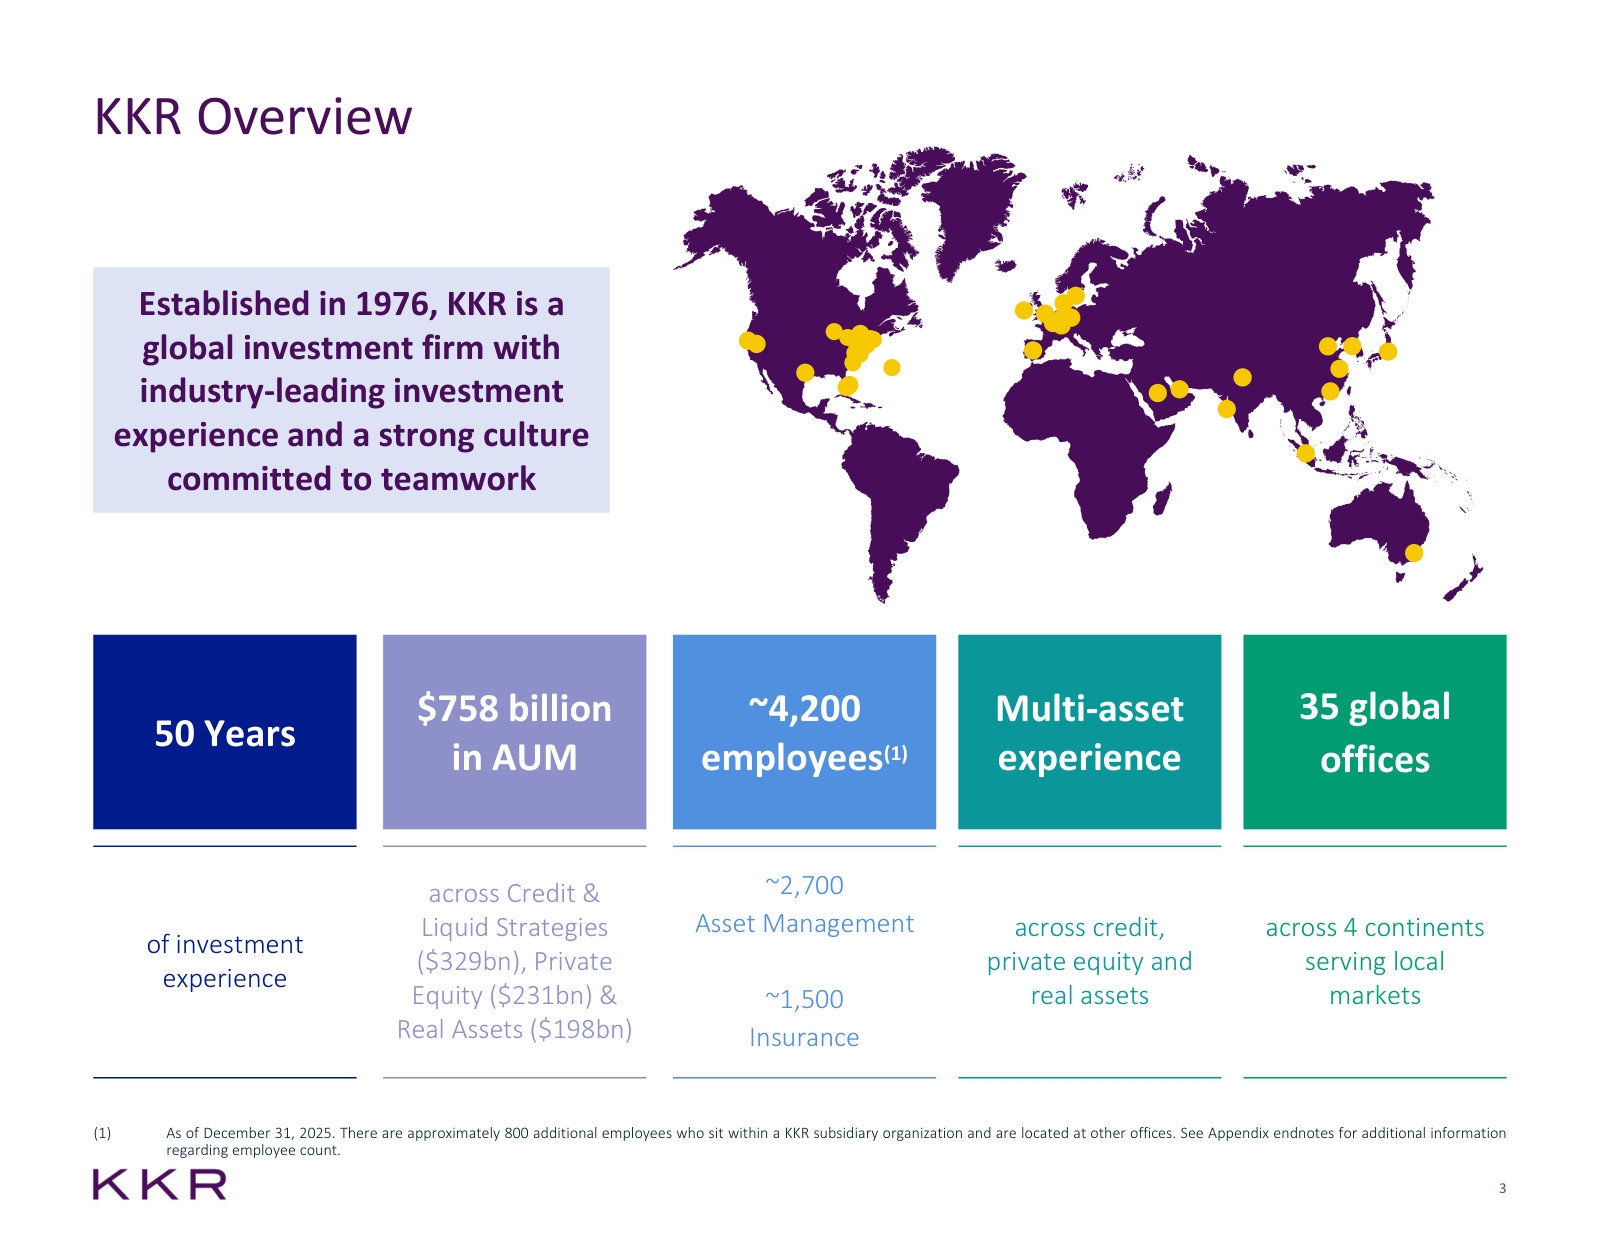
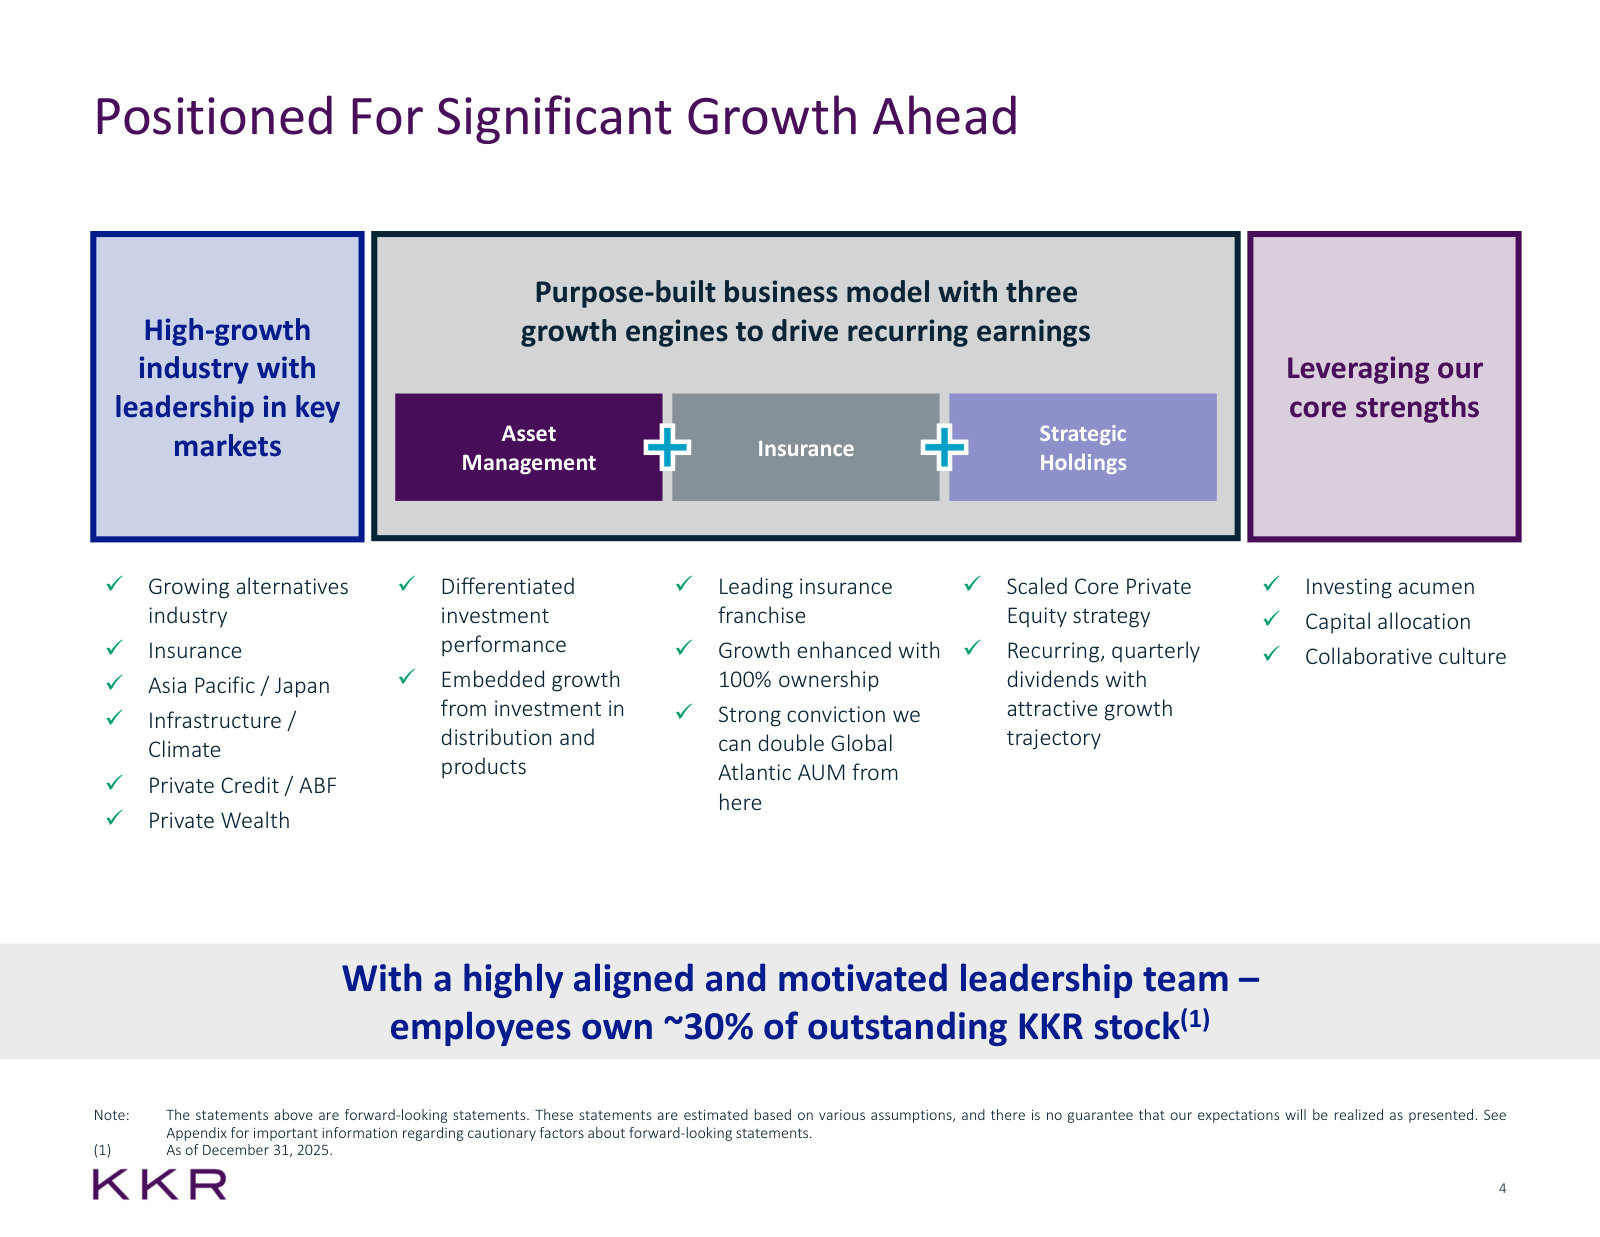
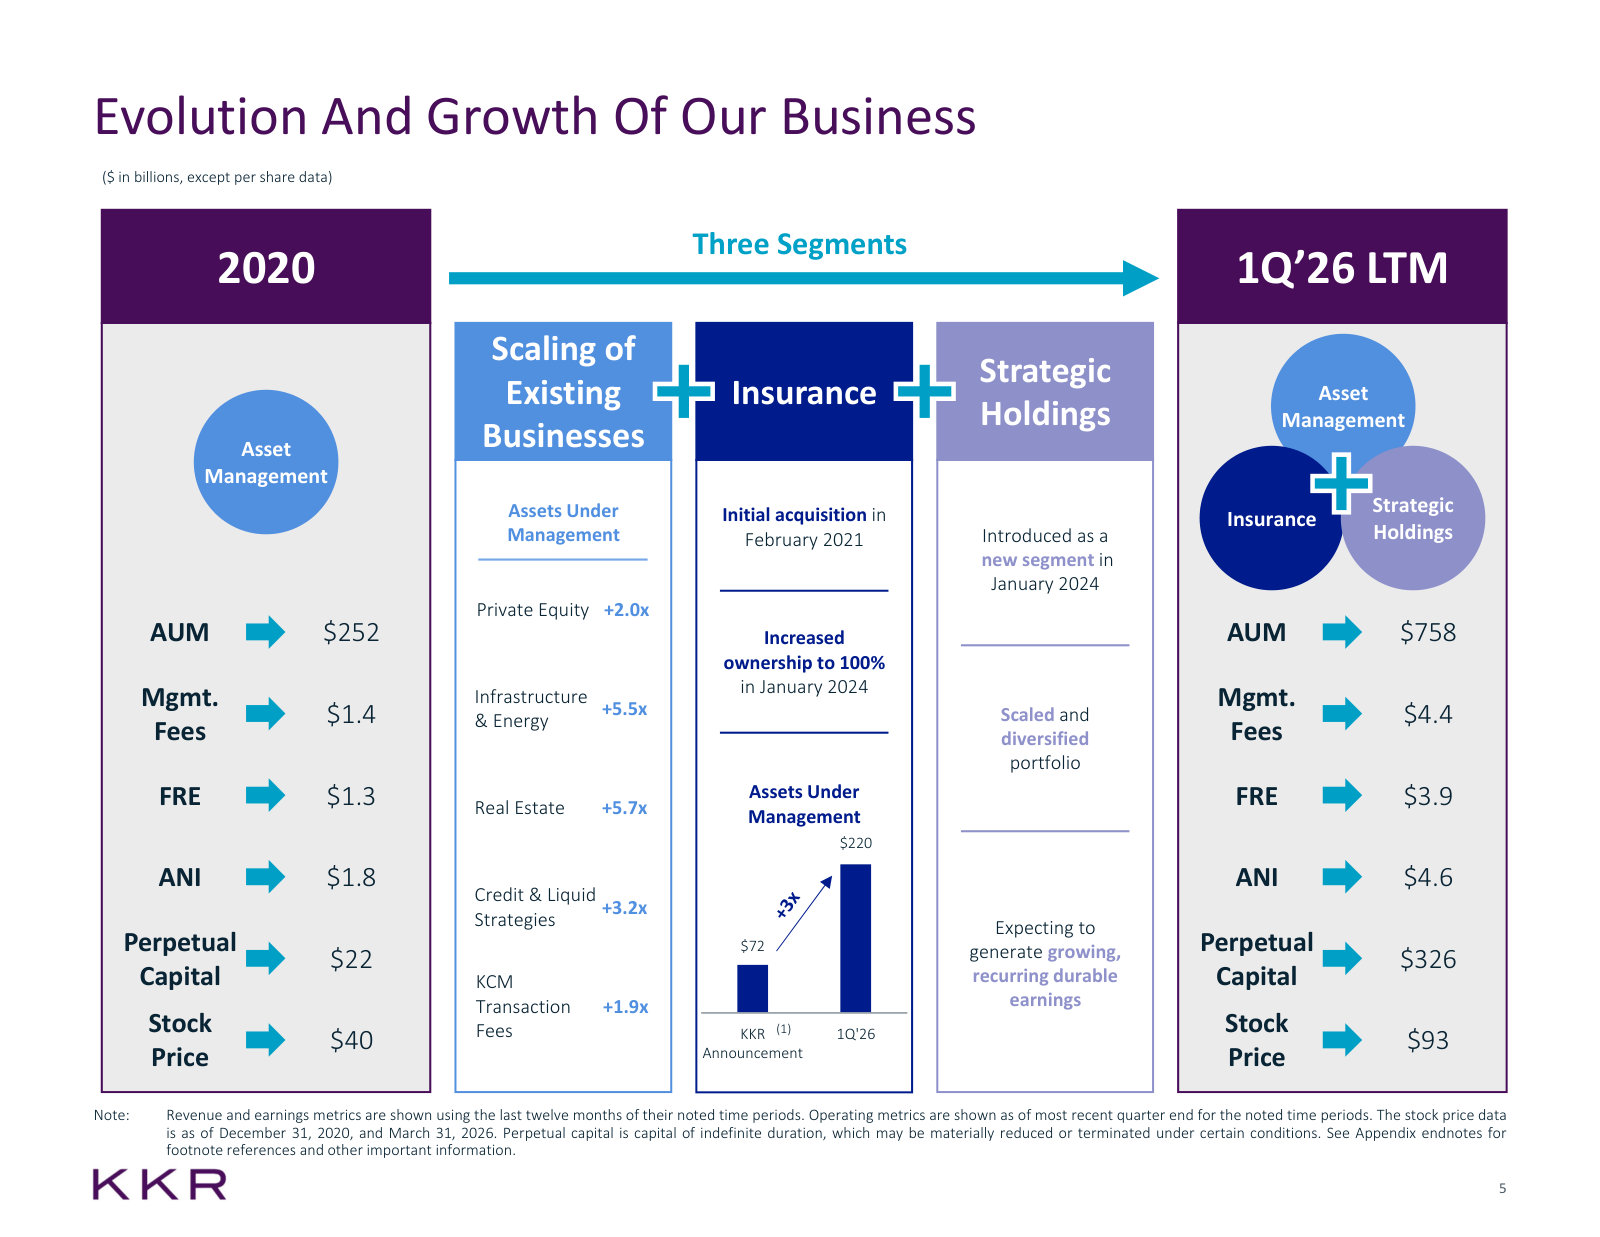
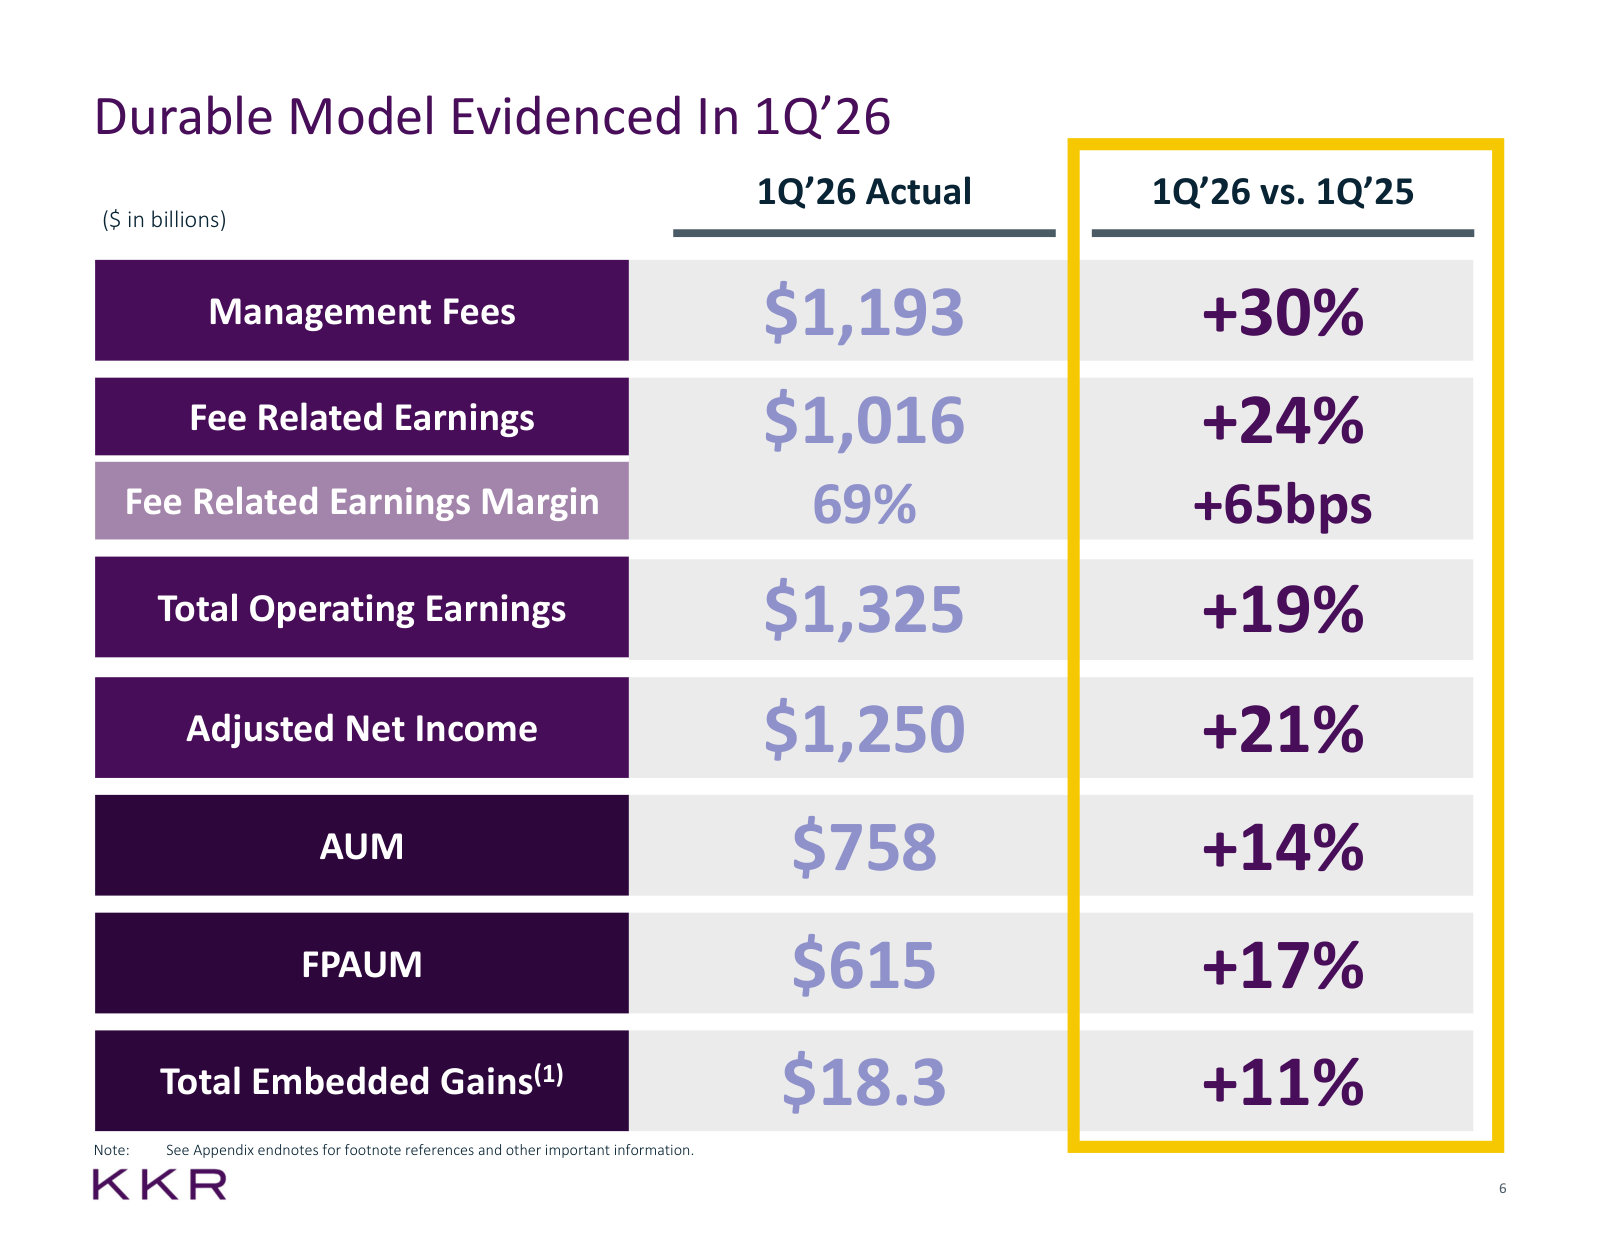
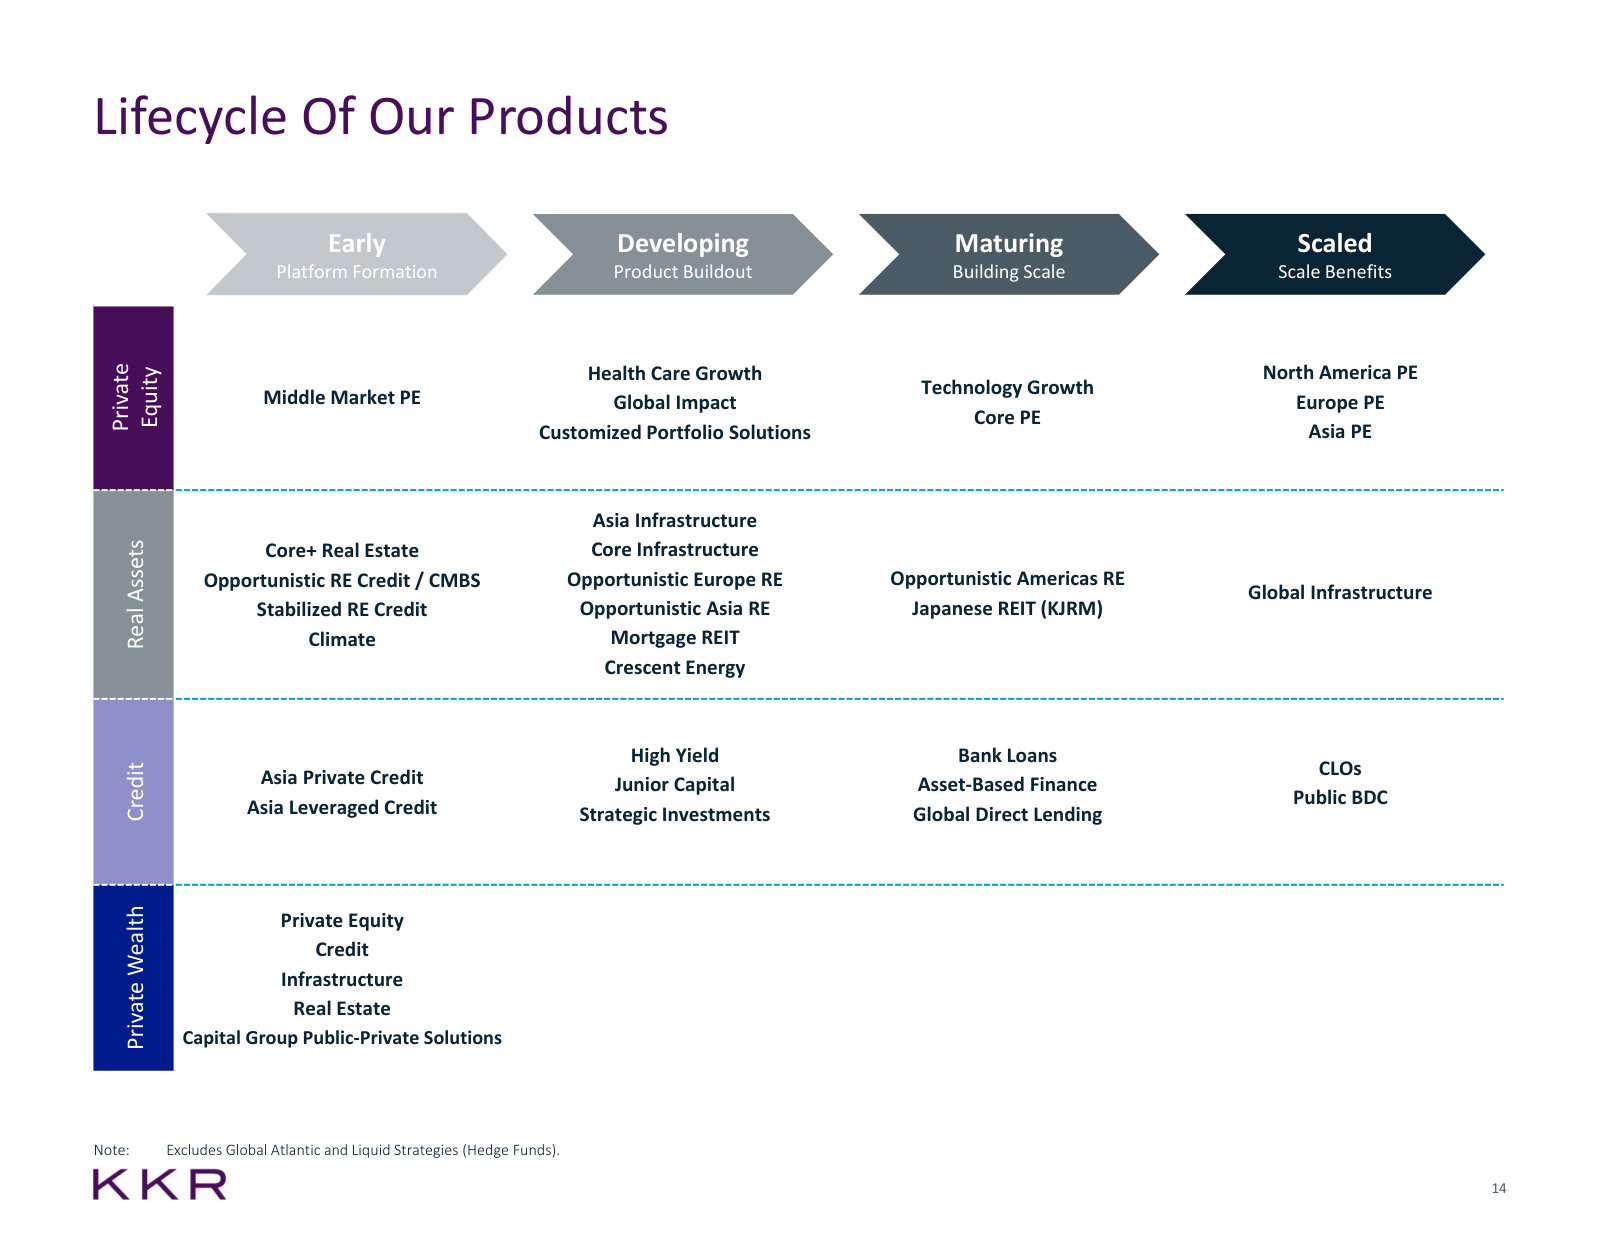
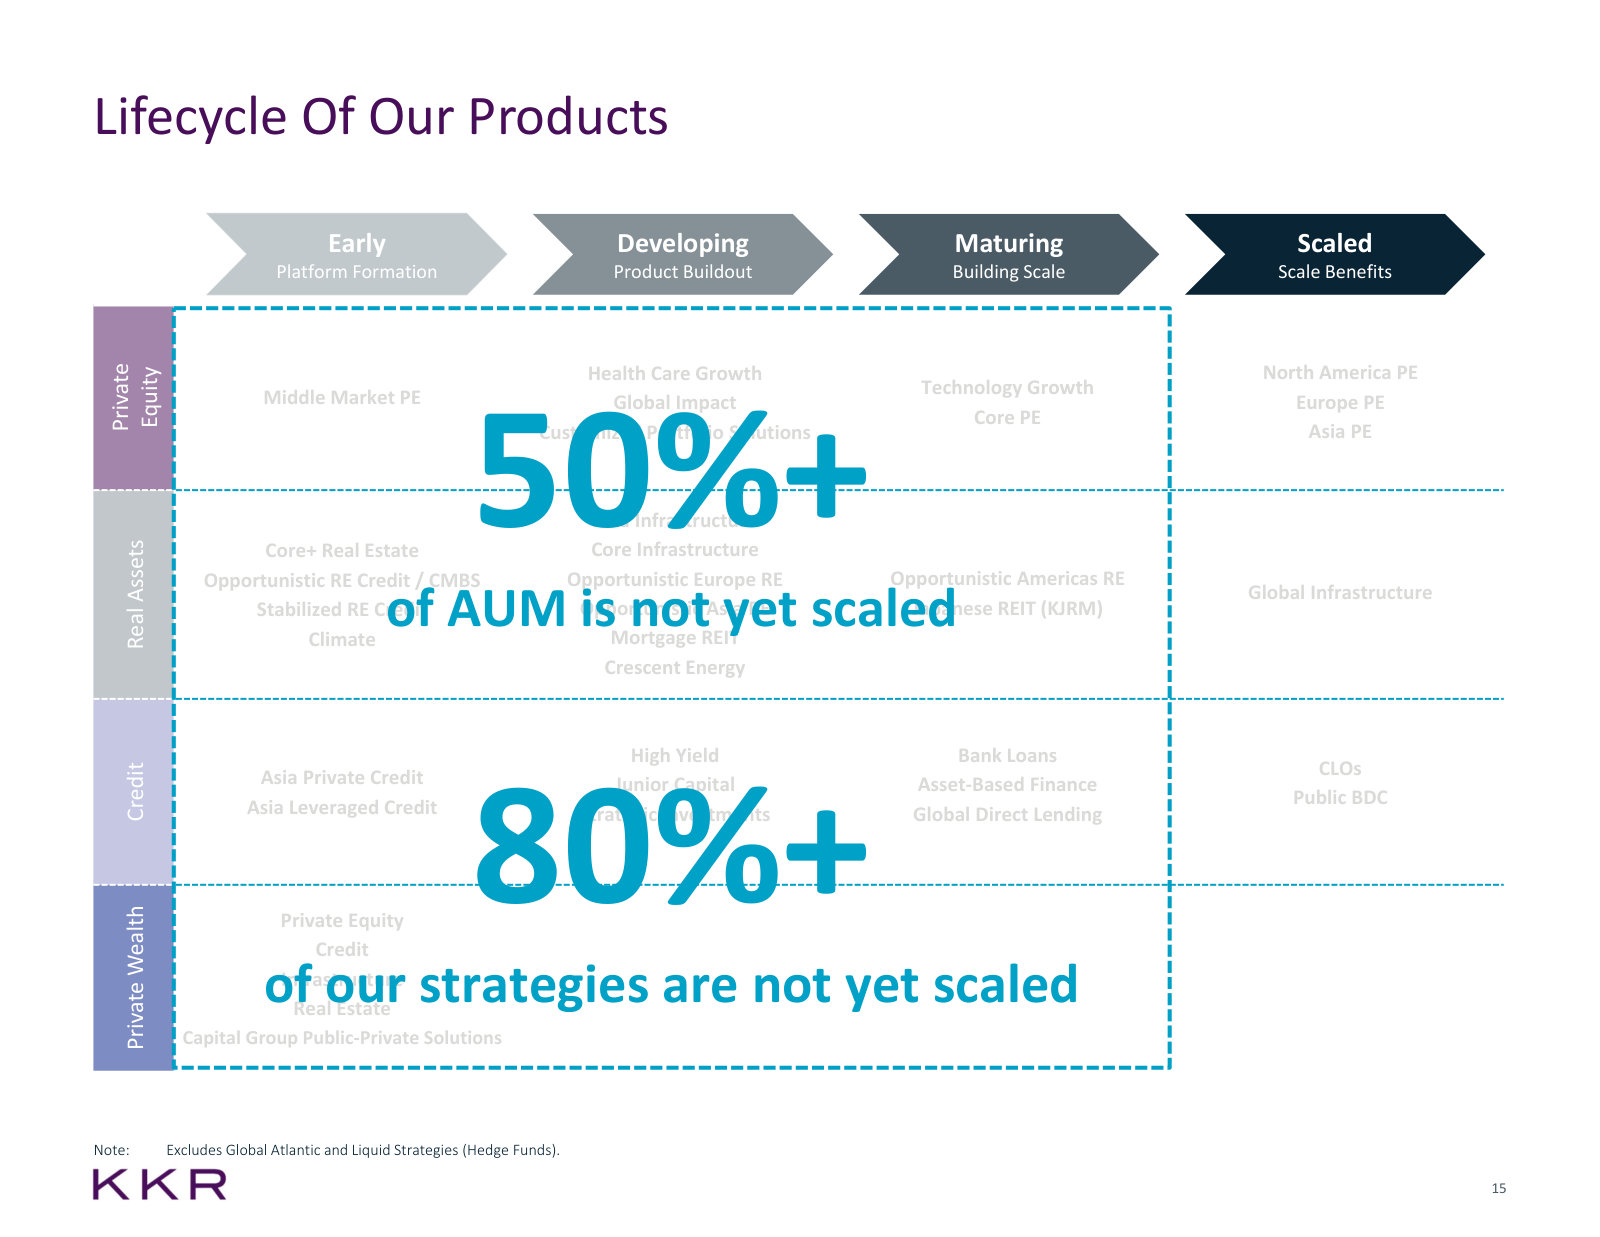
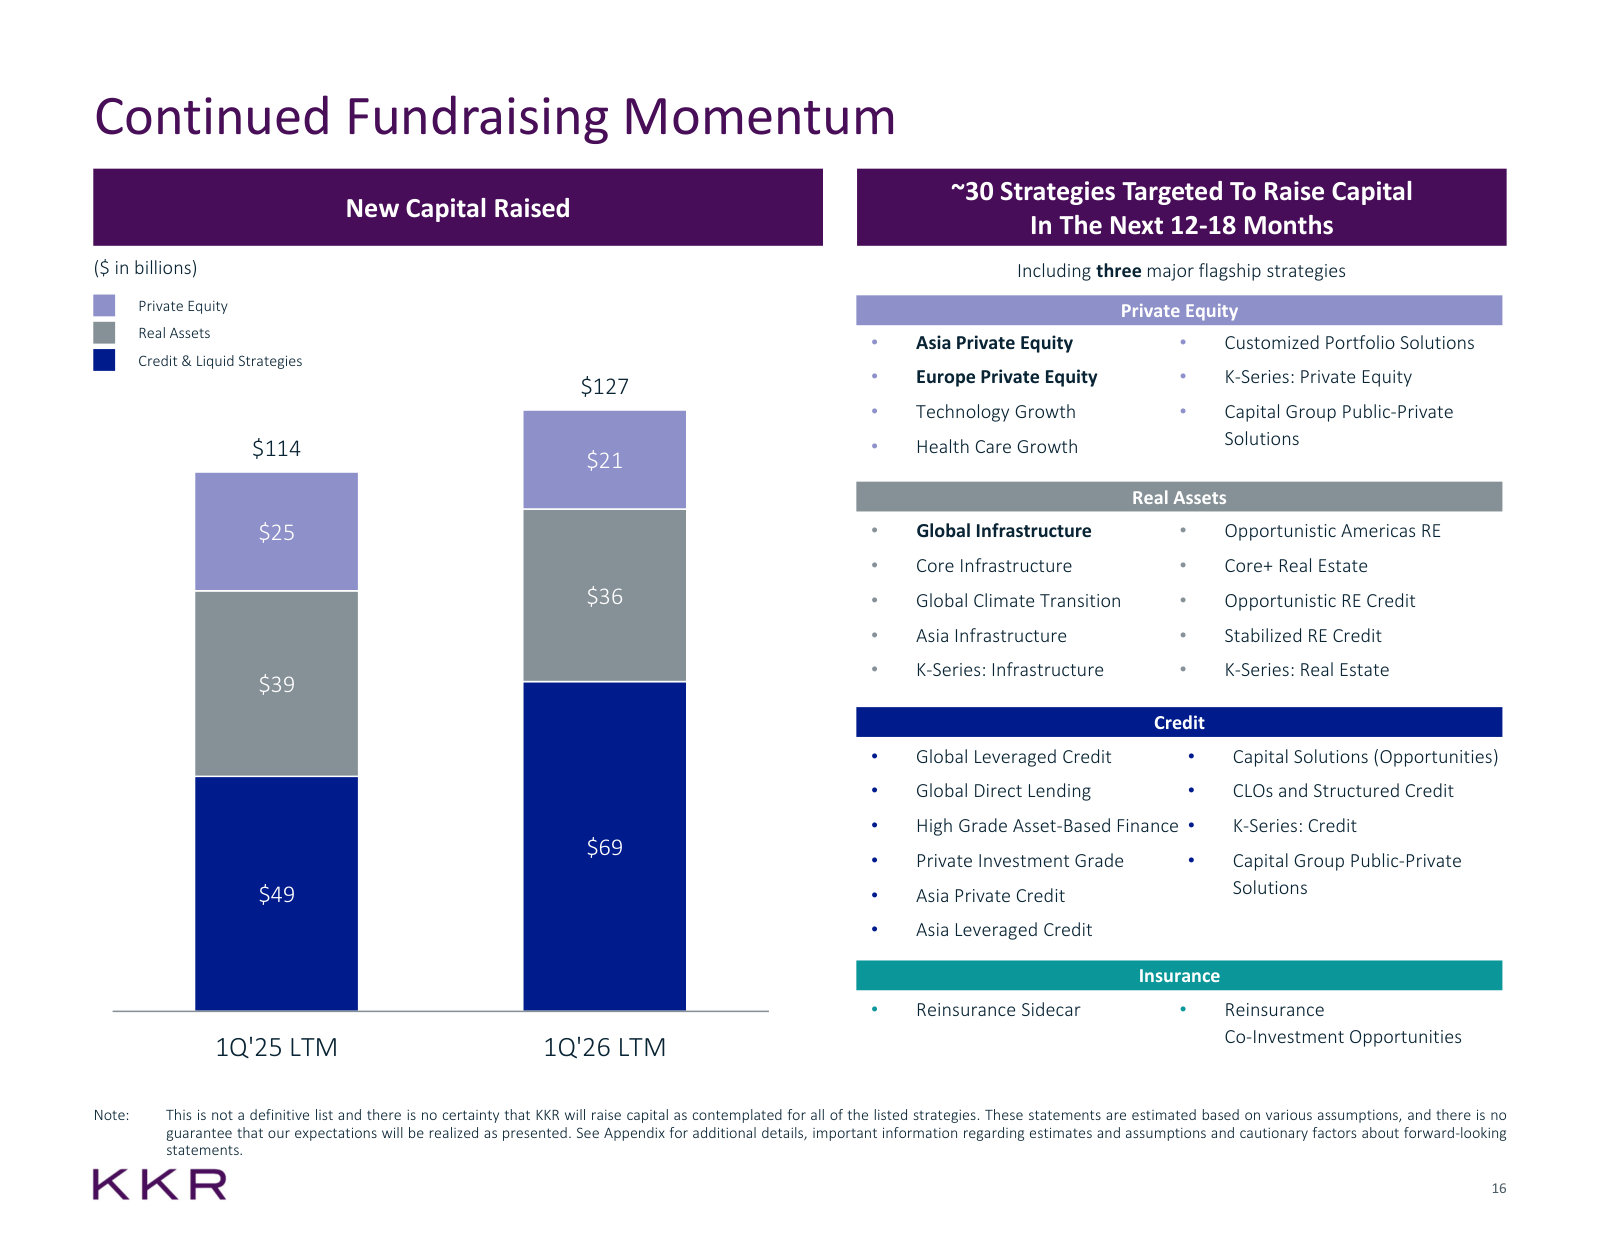
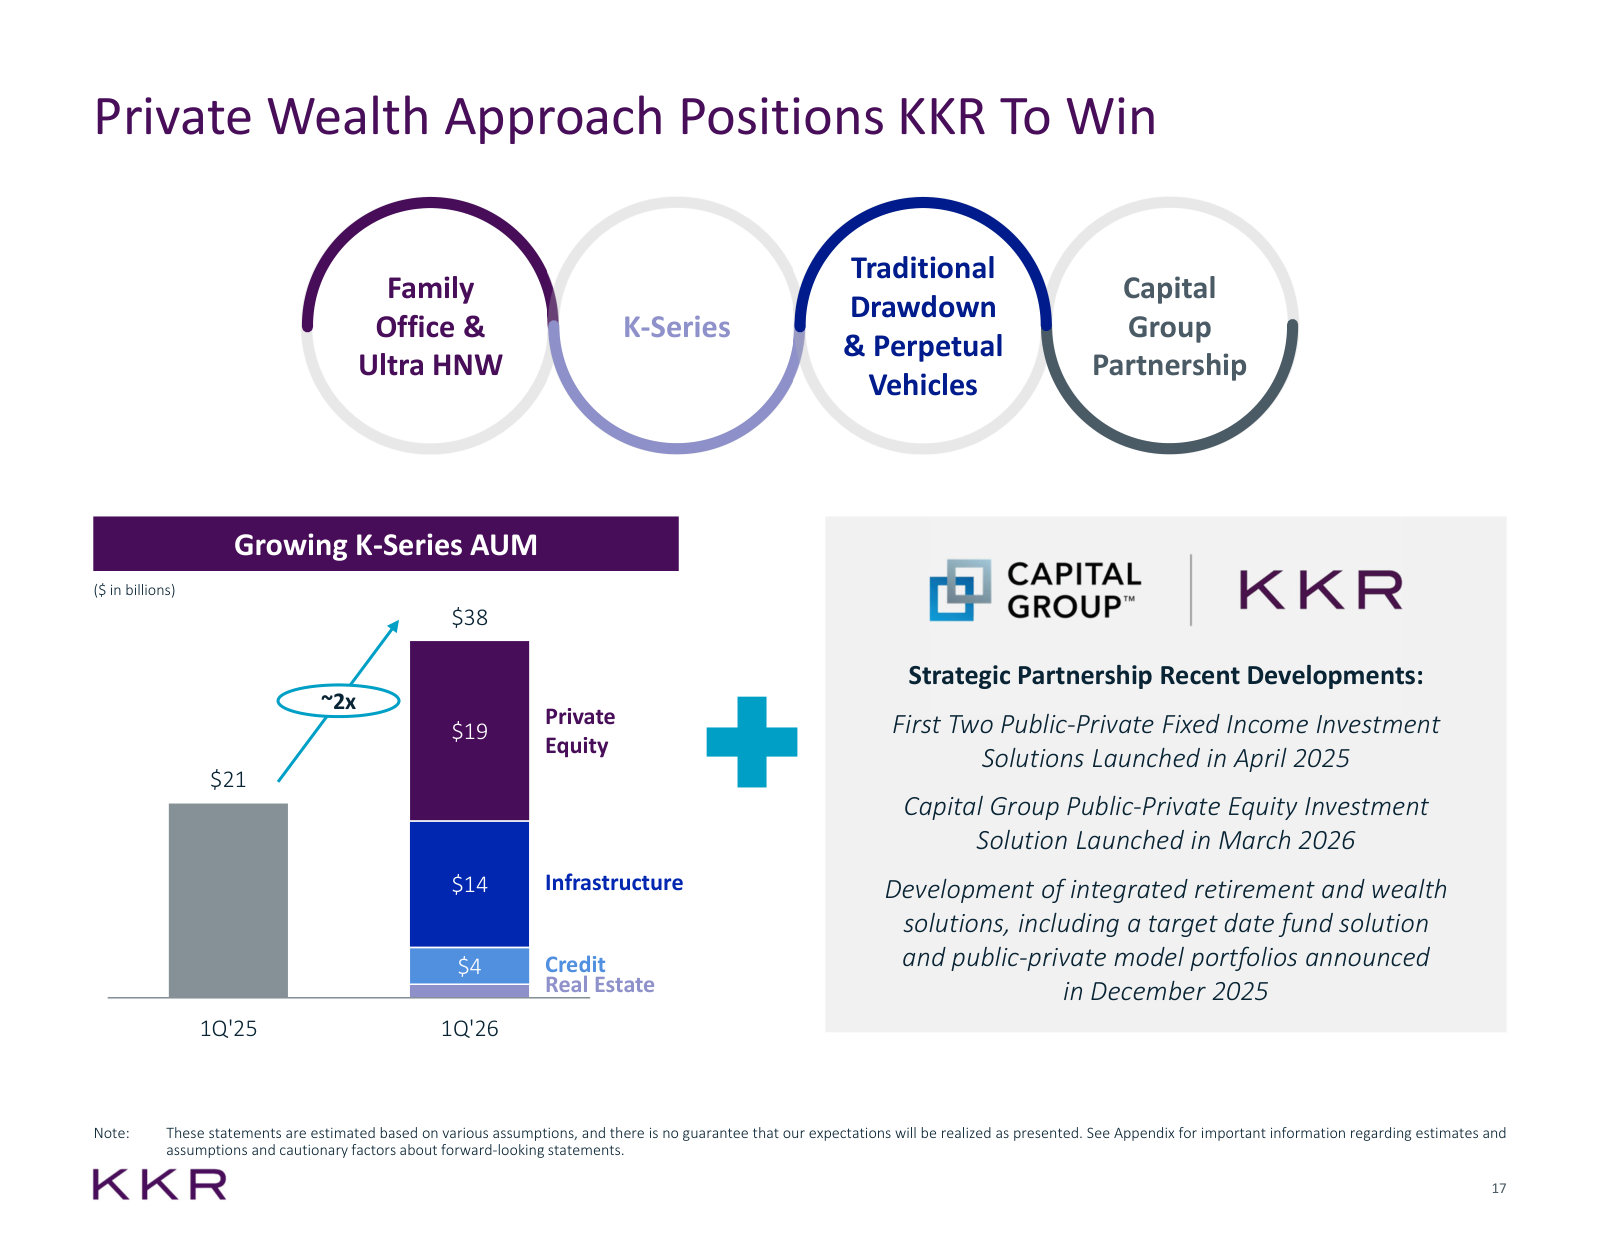
KKR & Co. Inc.'s management explains the business in its own materials. The slides below do the most of that work, pulled from the documents preserved in Sources. Each source link opens the complete presentation at that slide in a new tab.
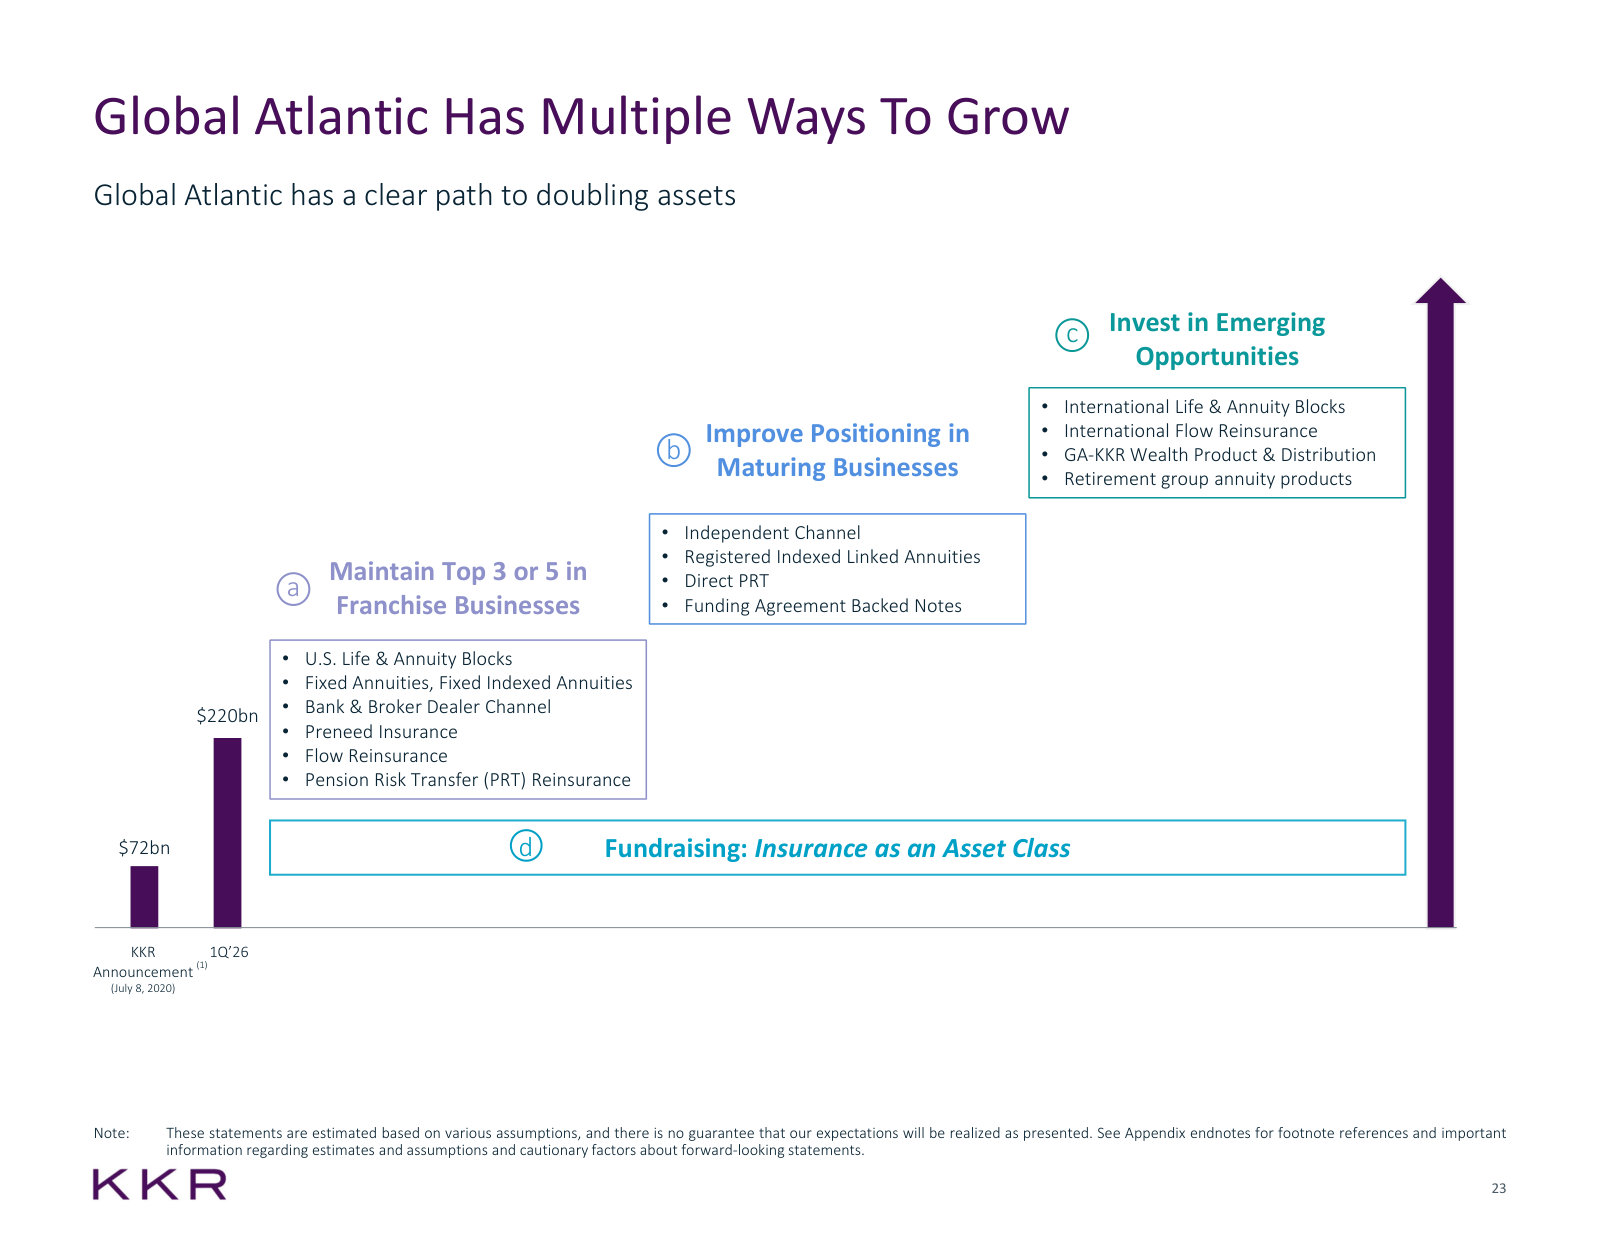
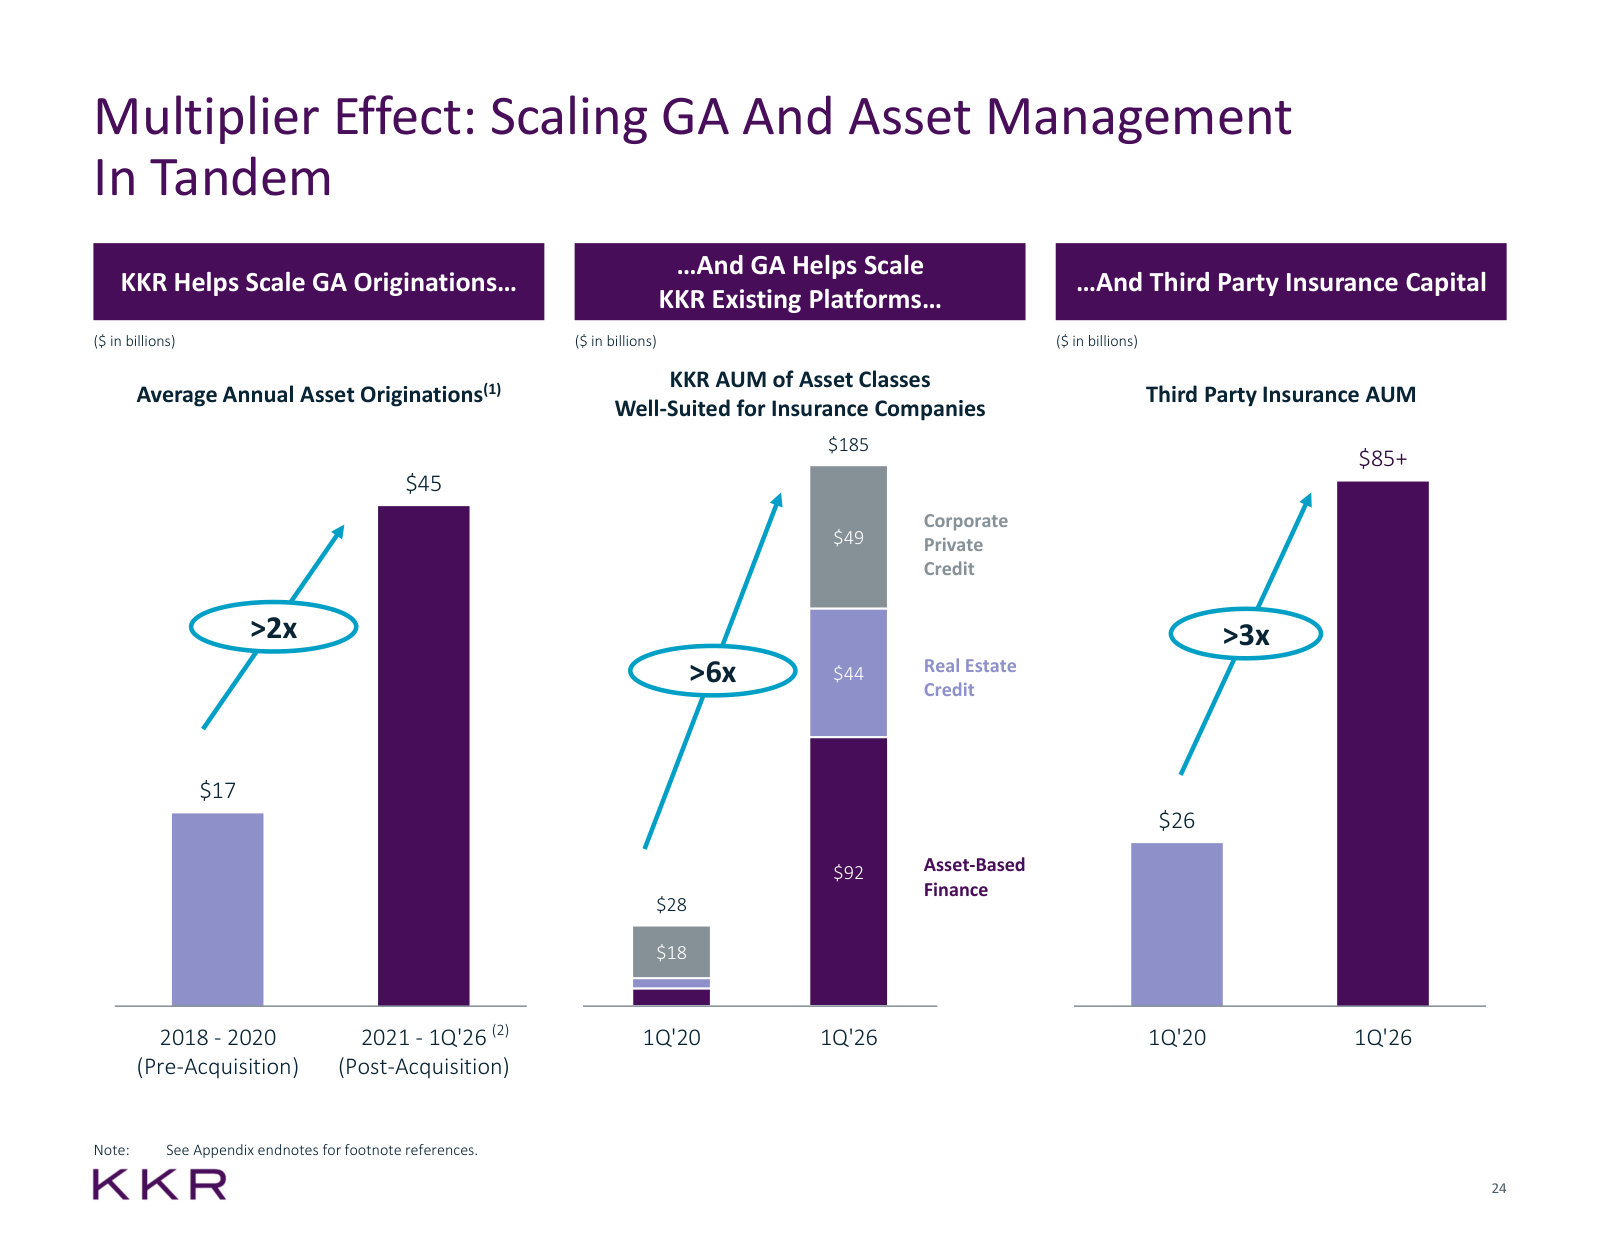
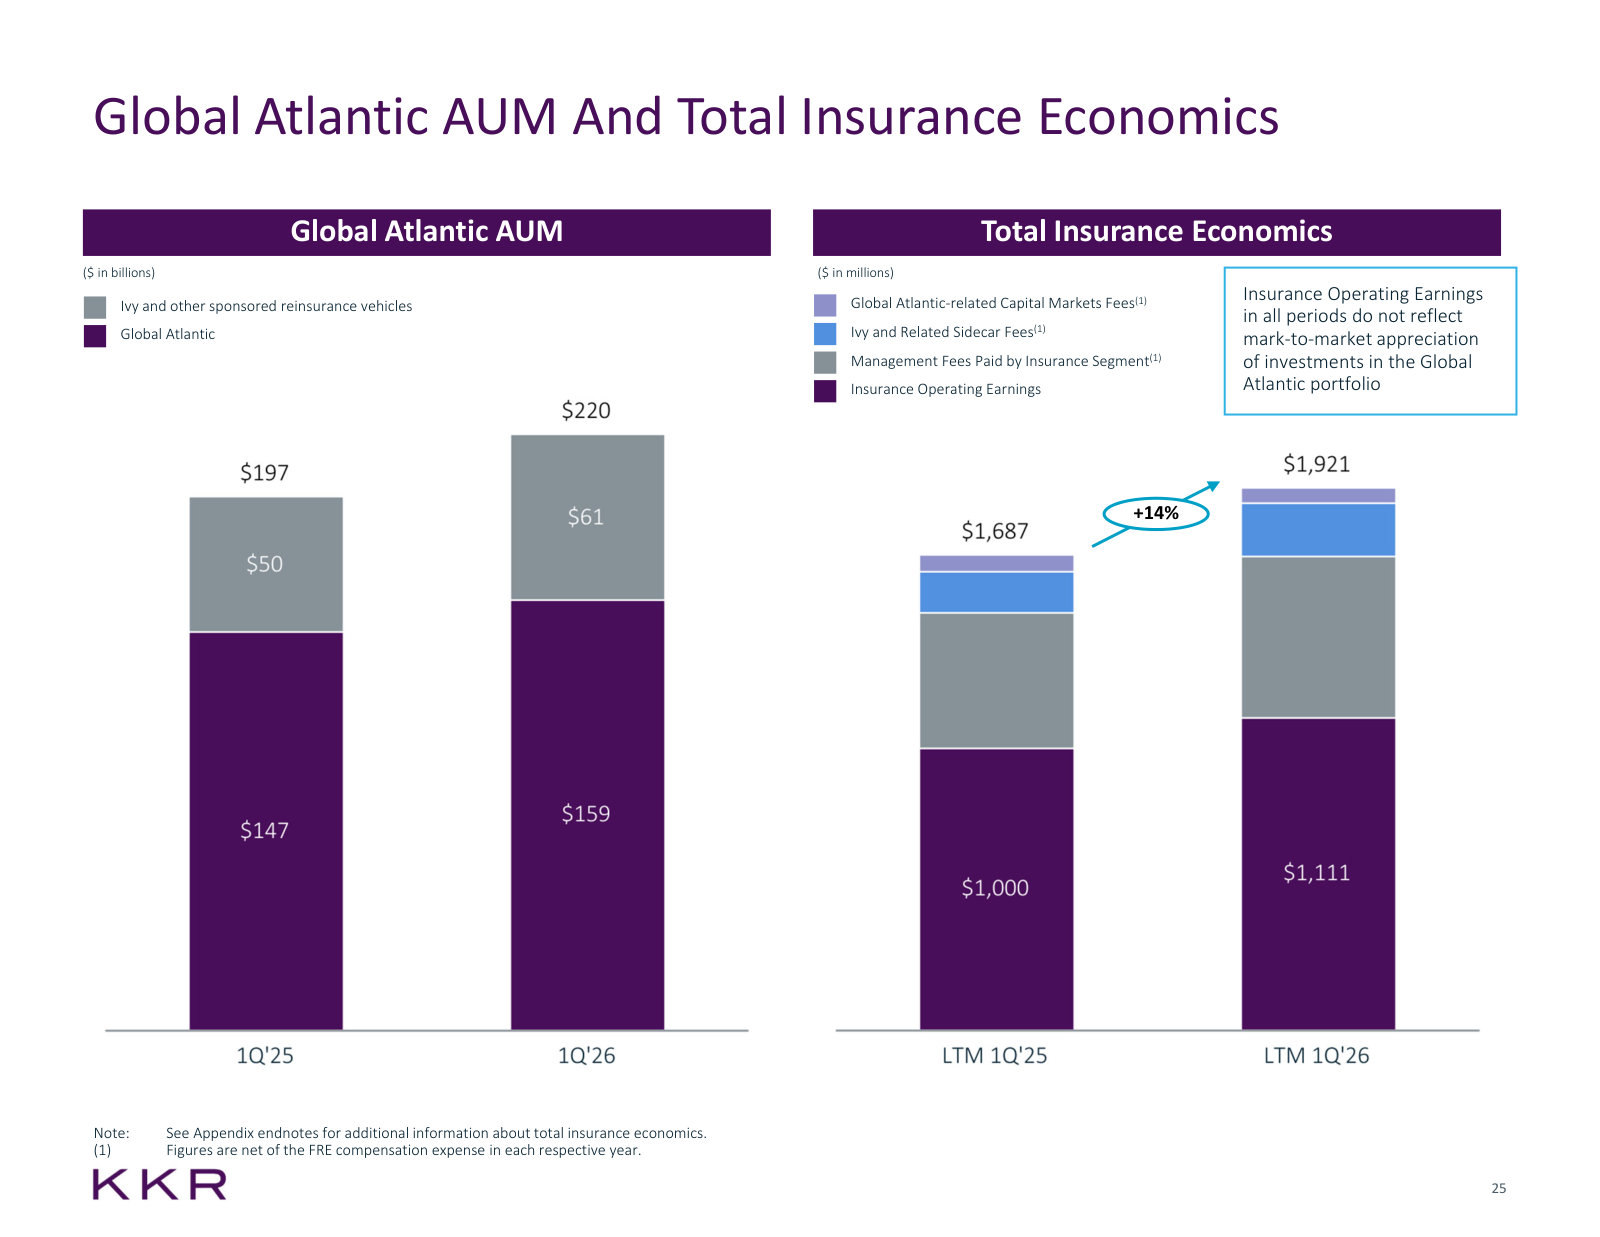
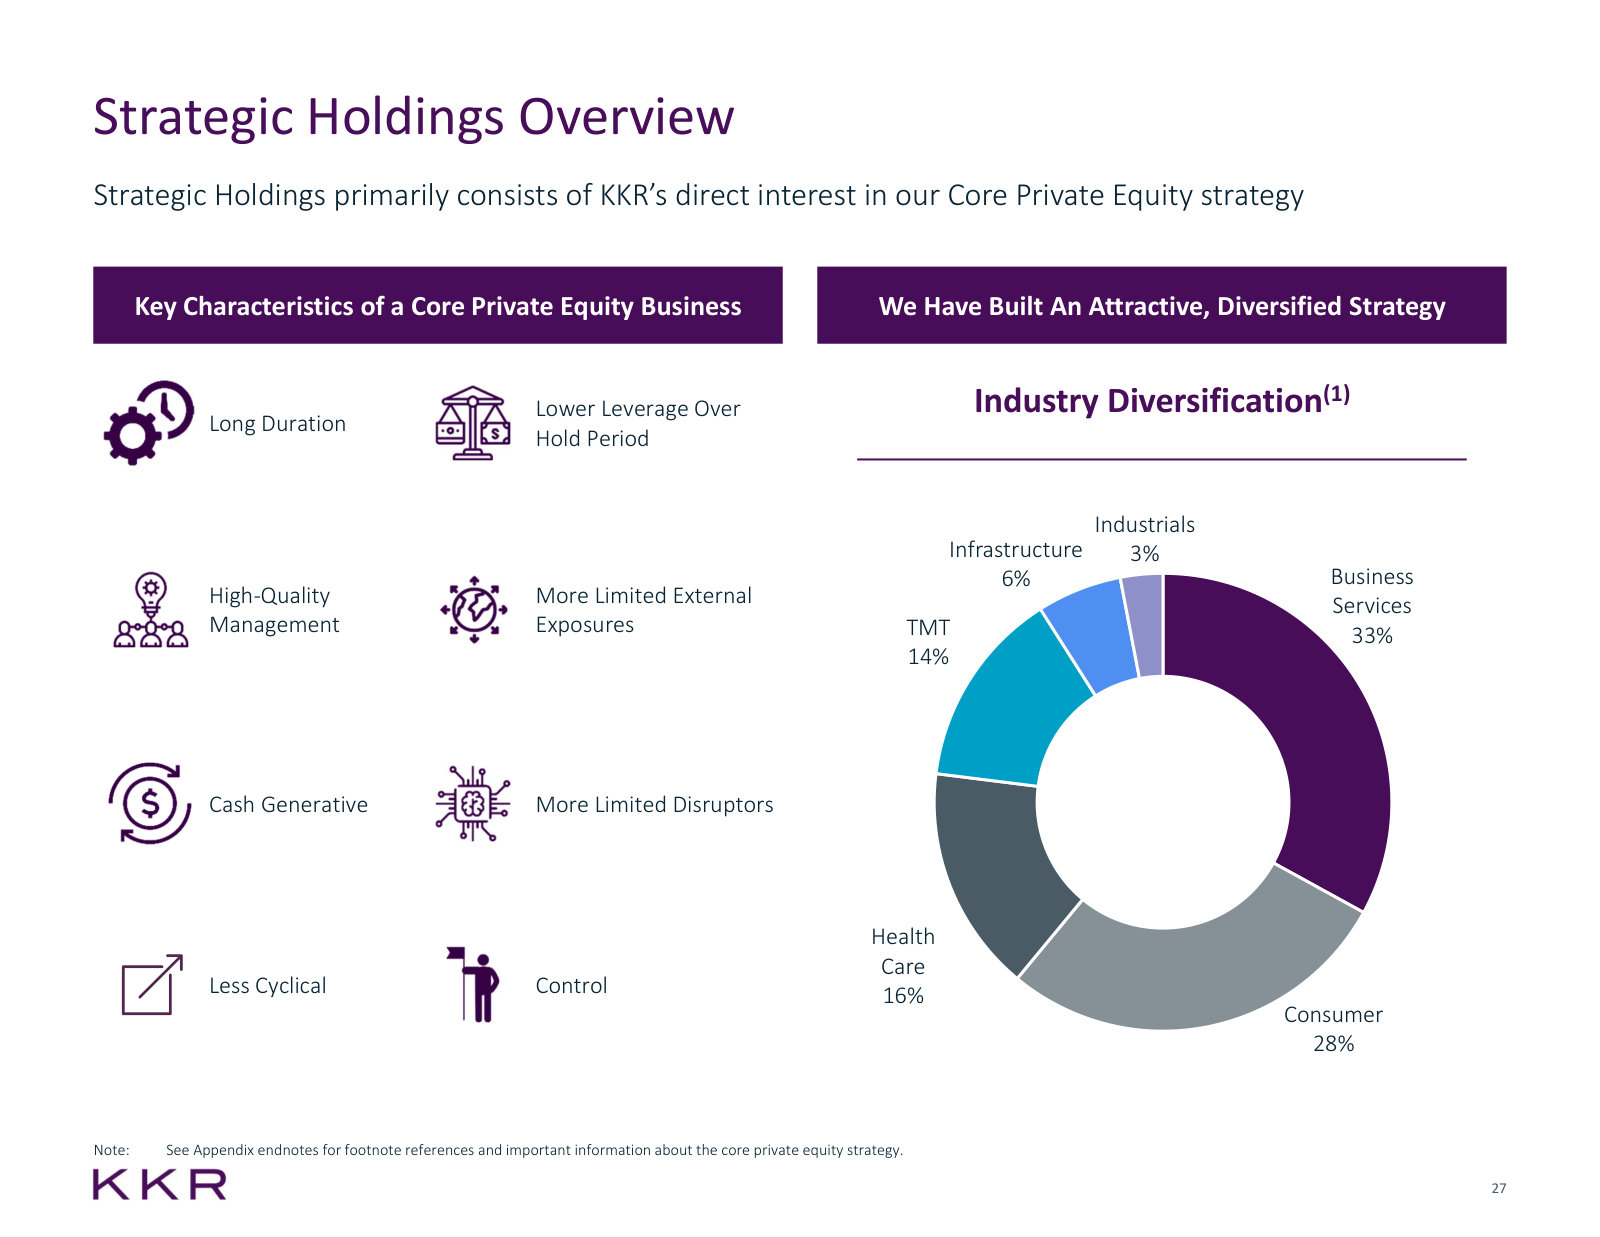
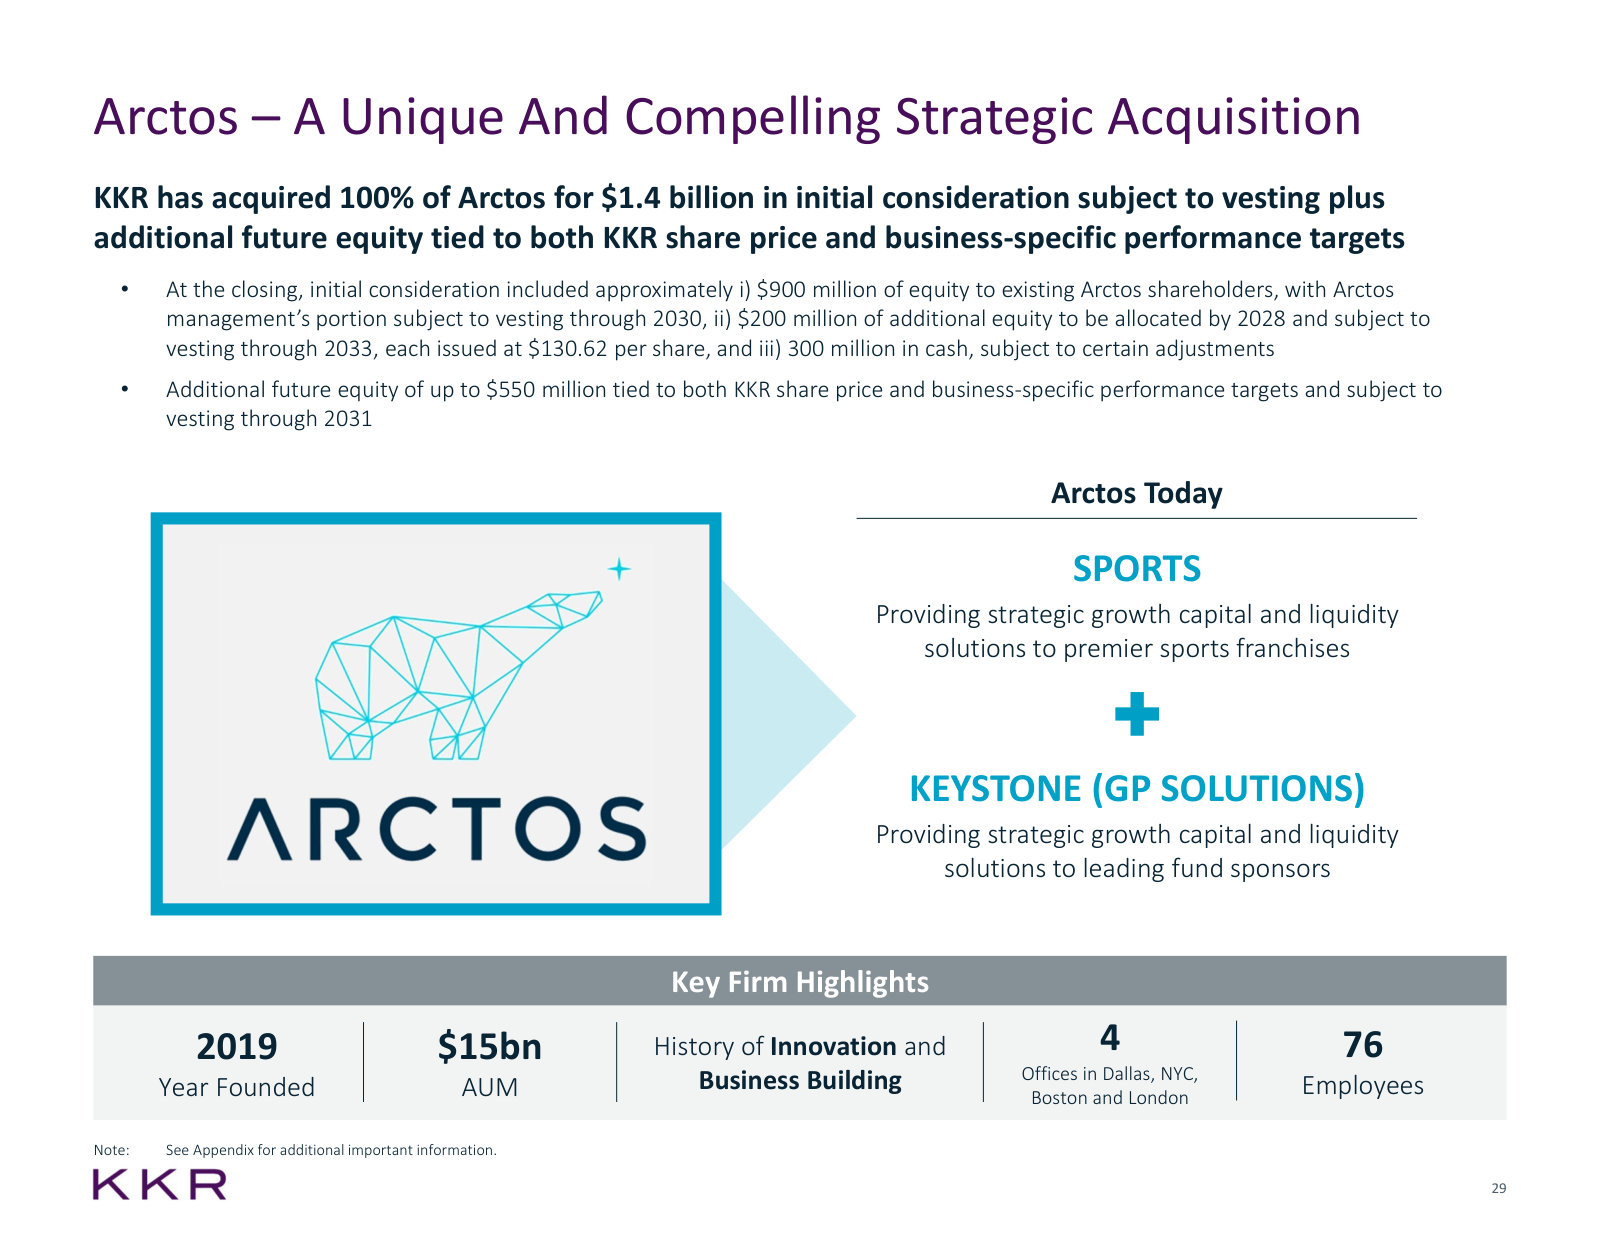
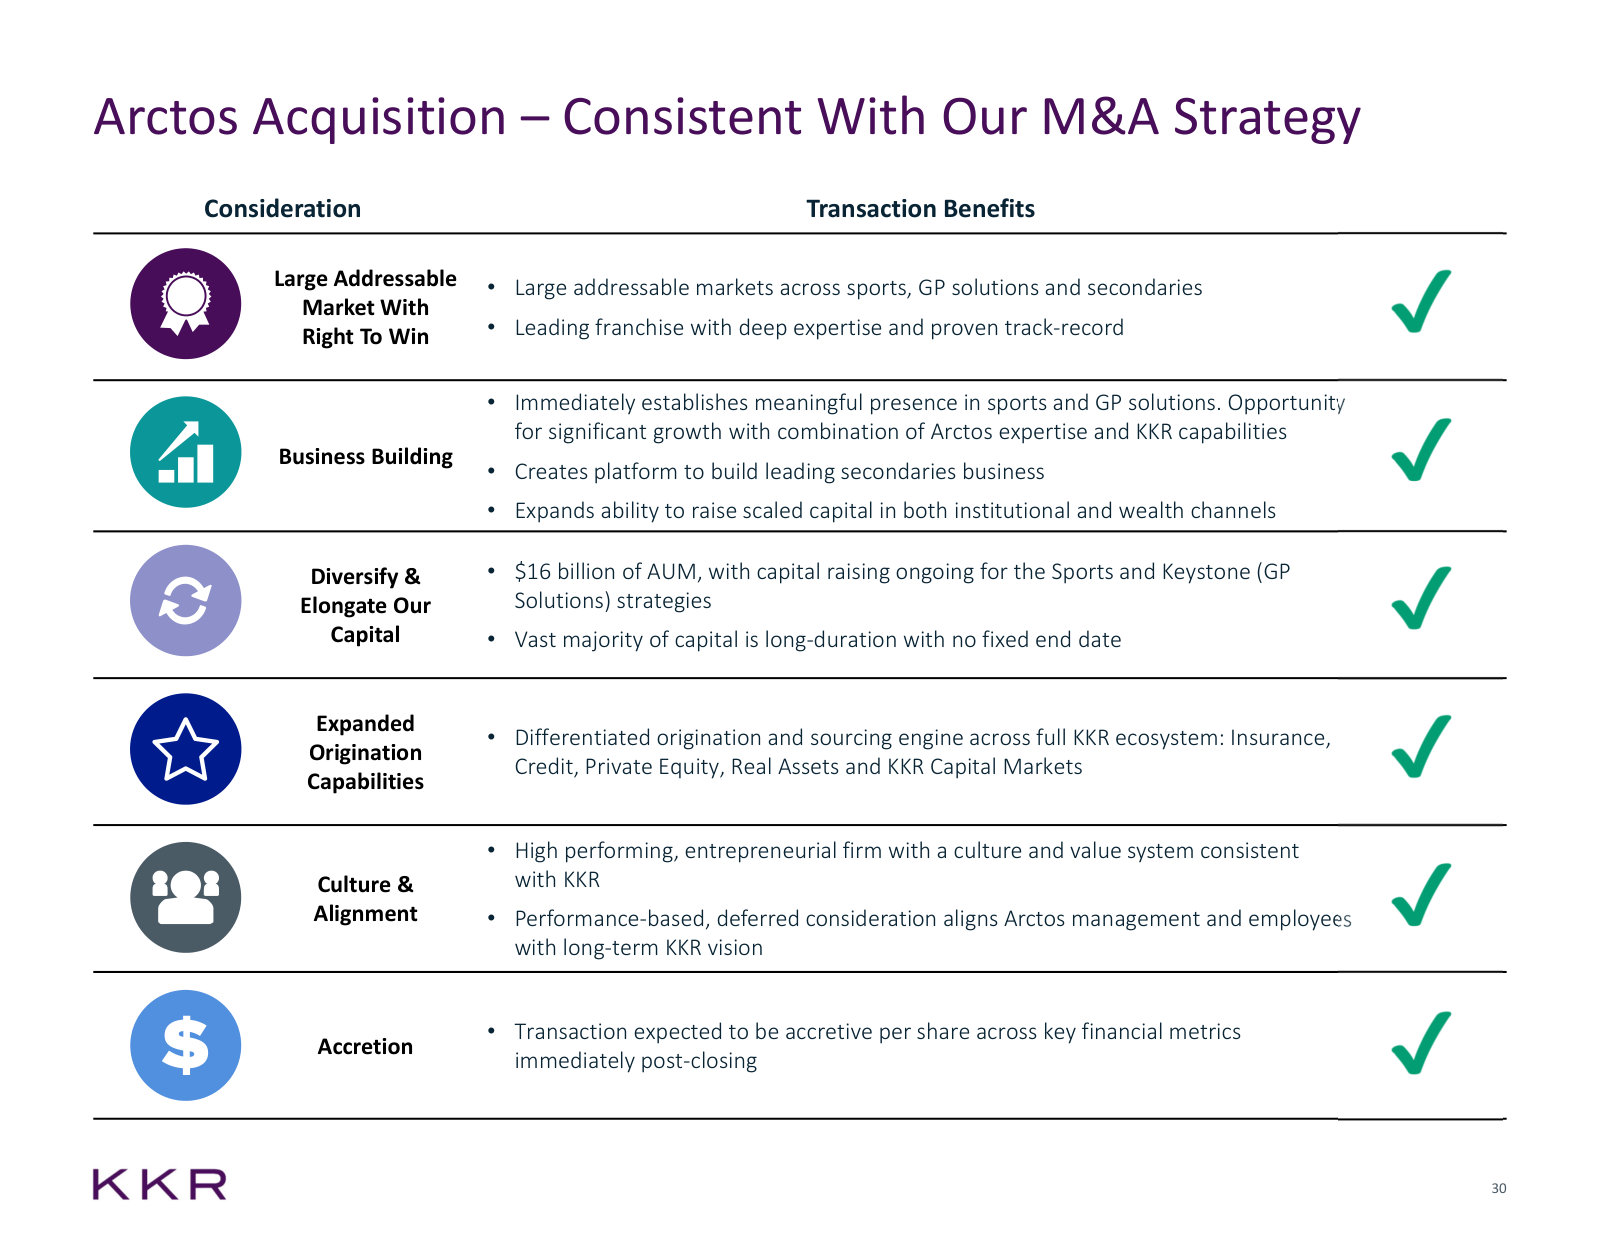
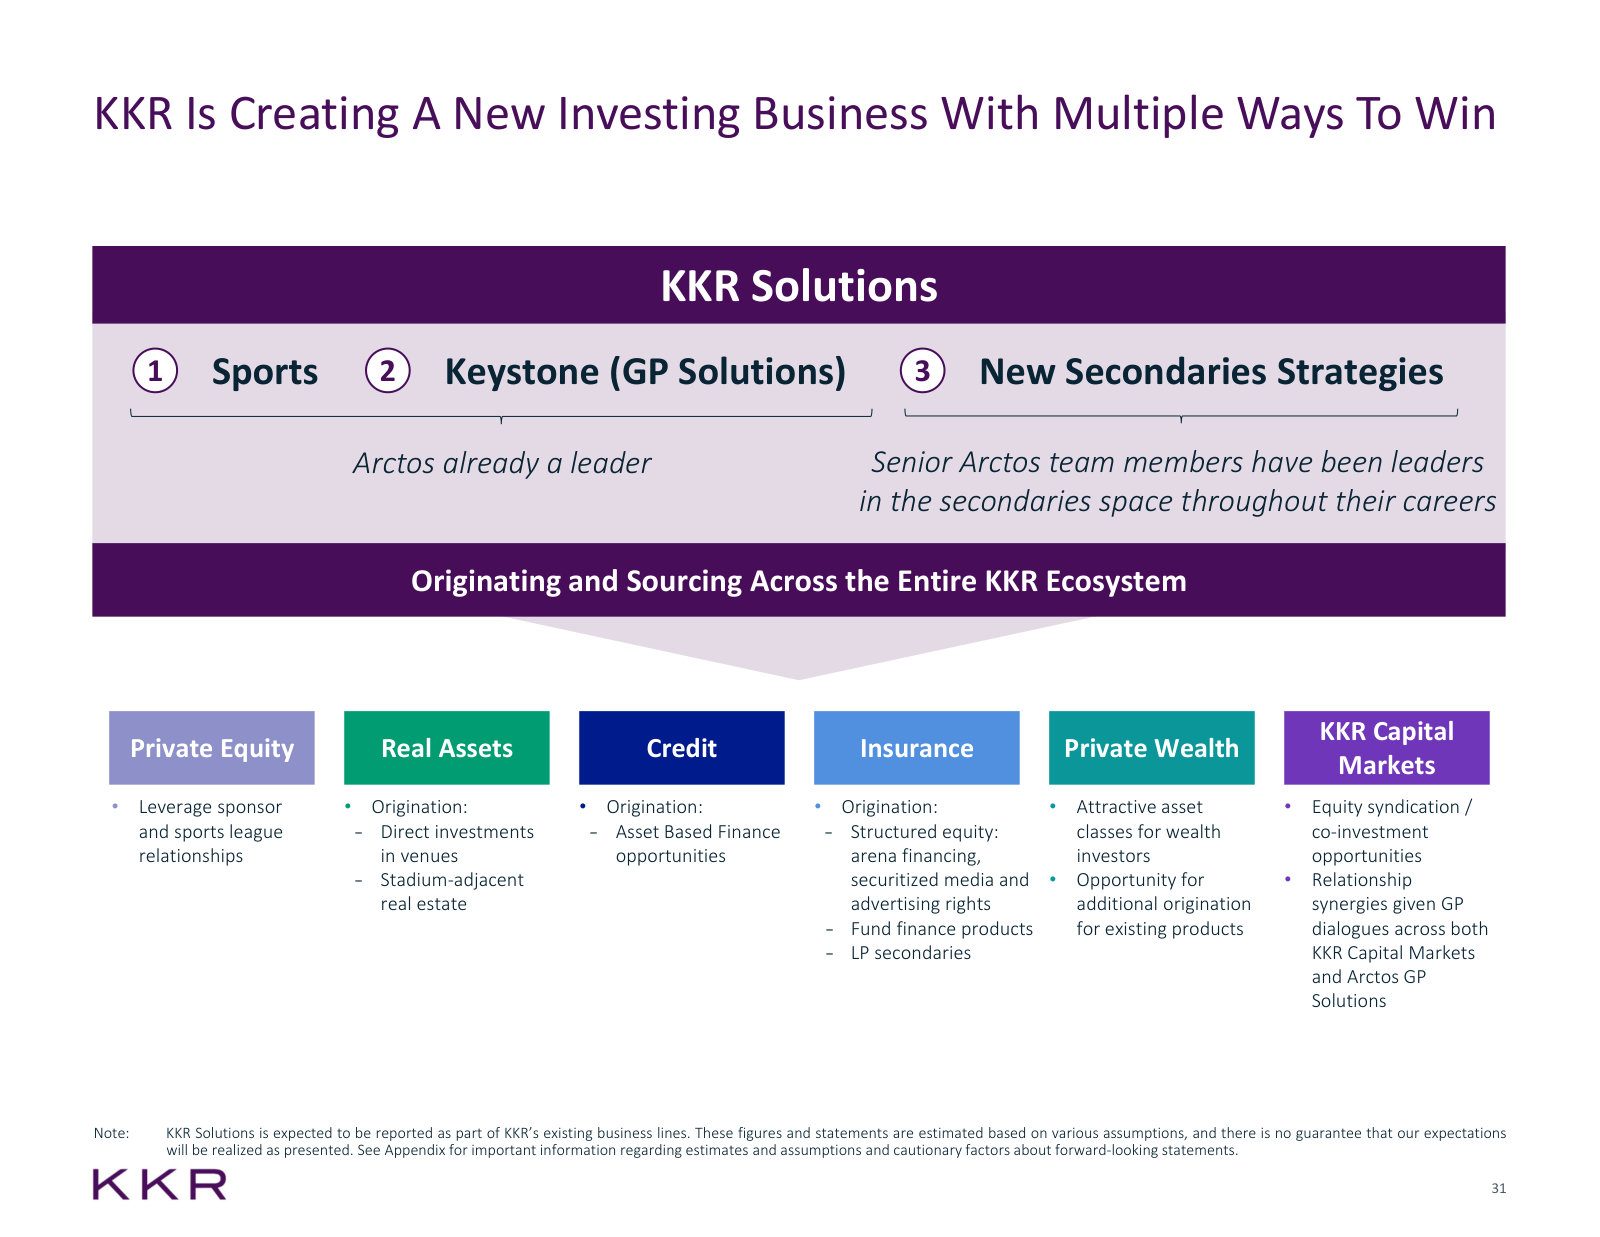
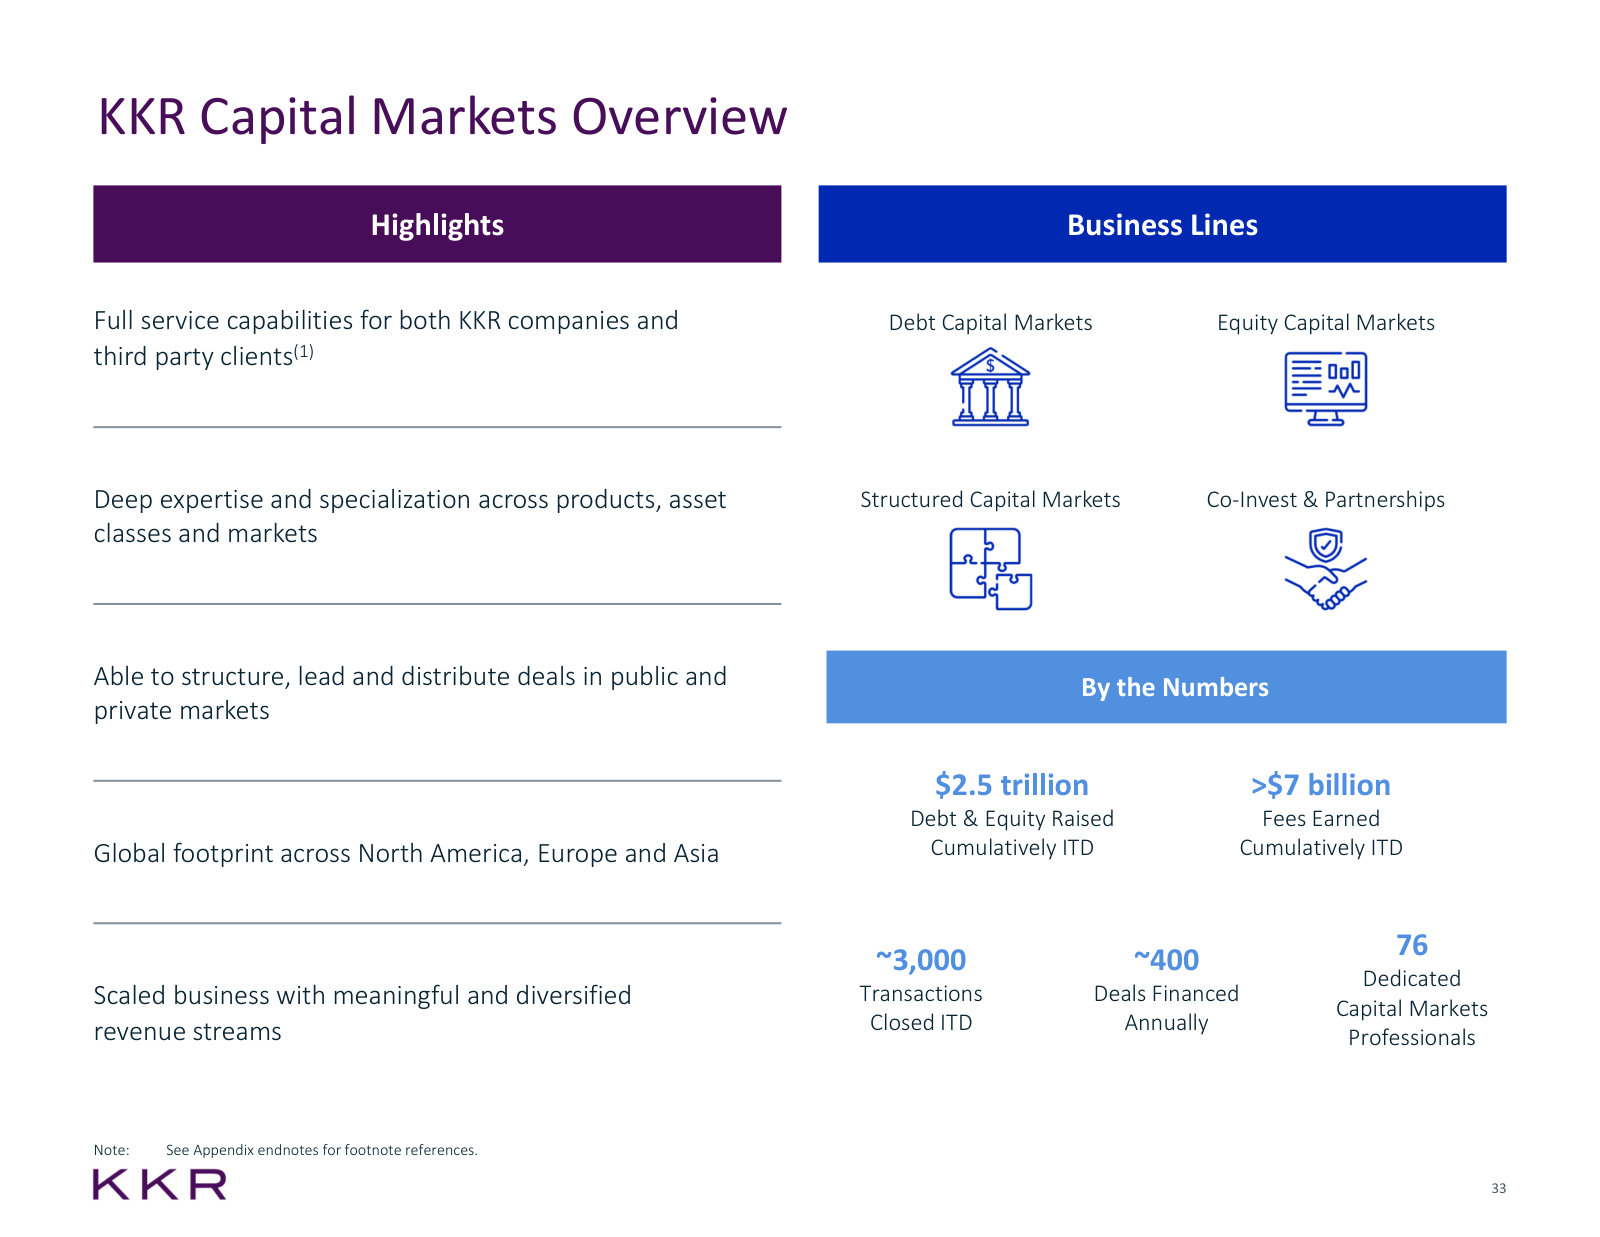
Overview Presentation – 1Q'26 — 1Q'26
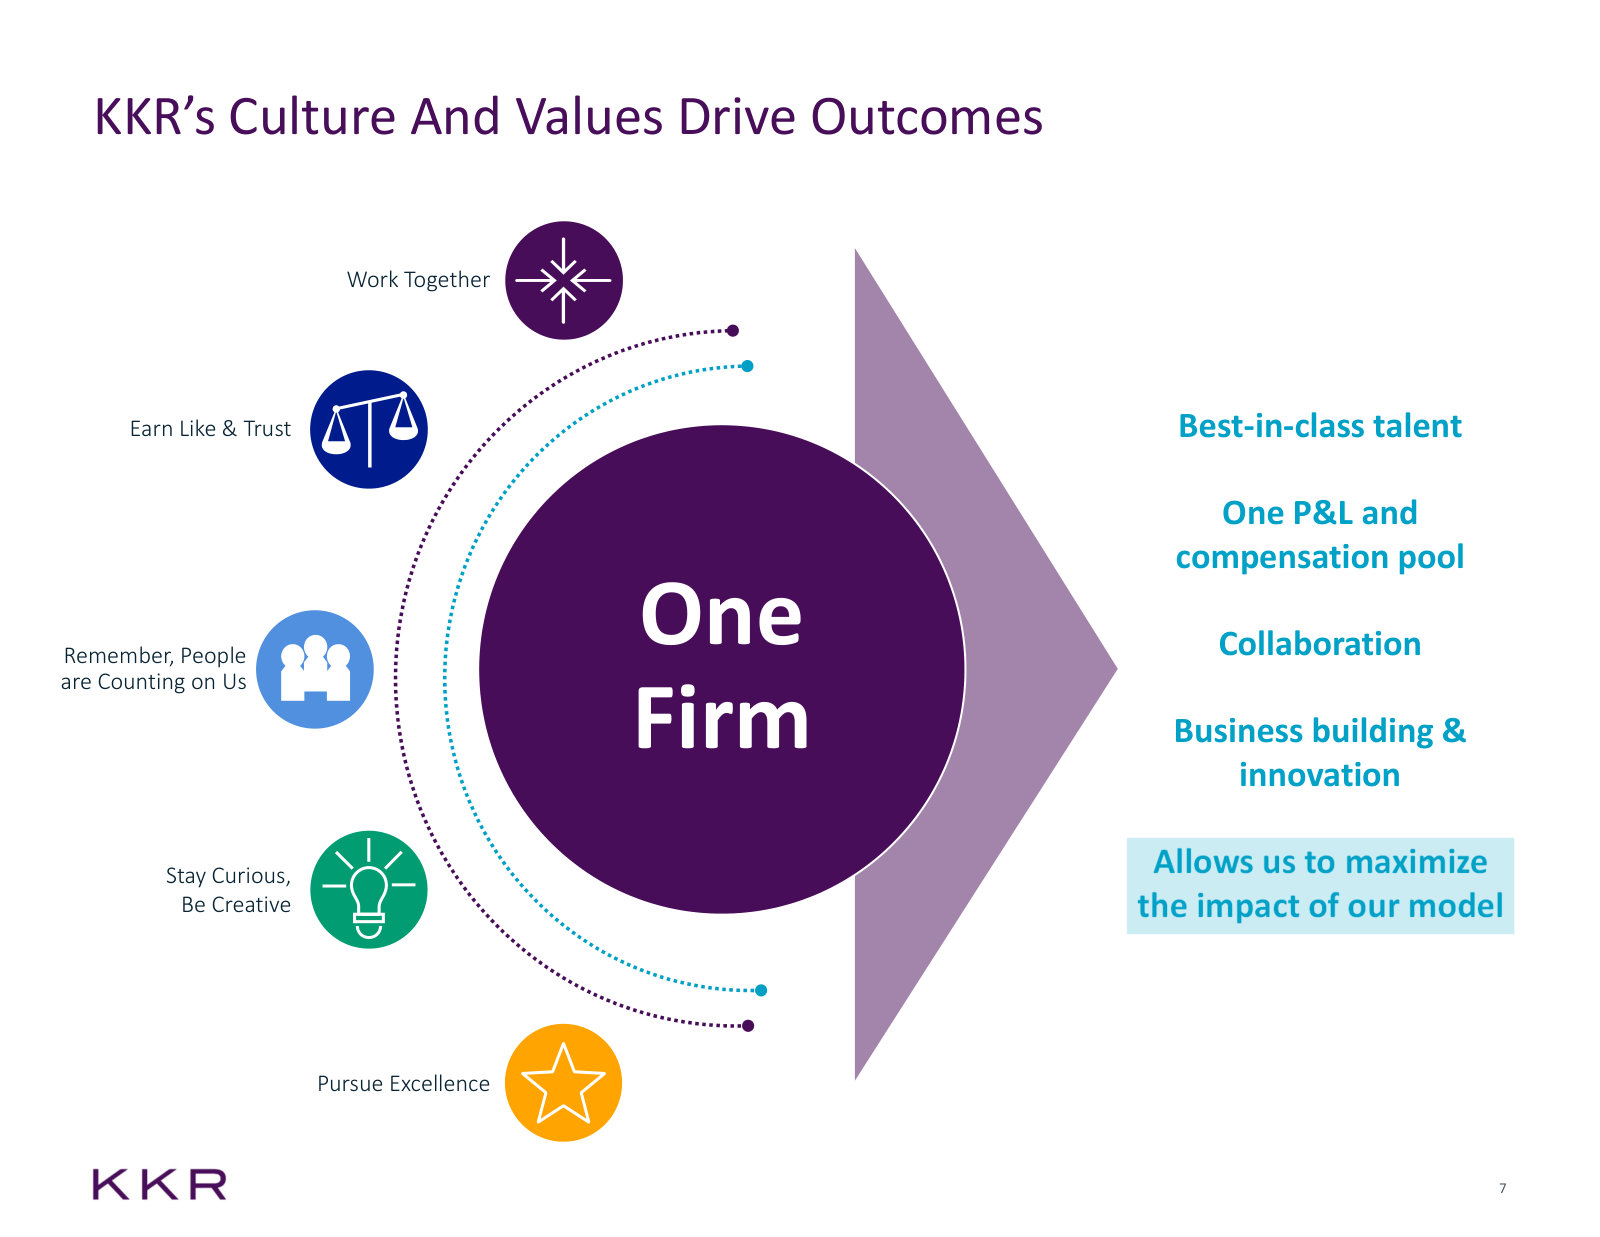
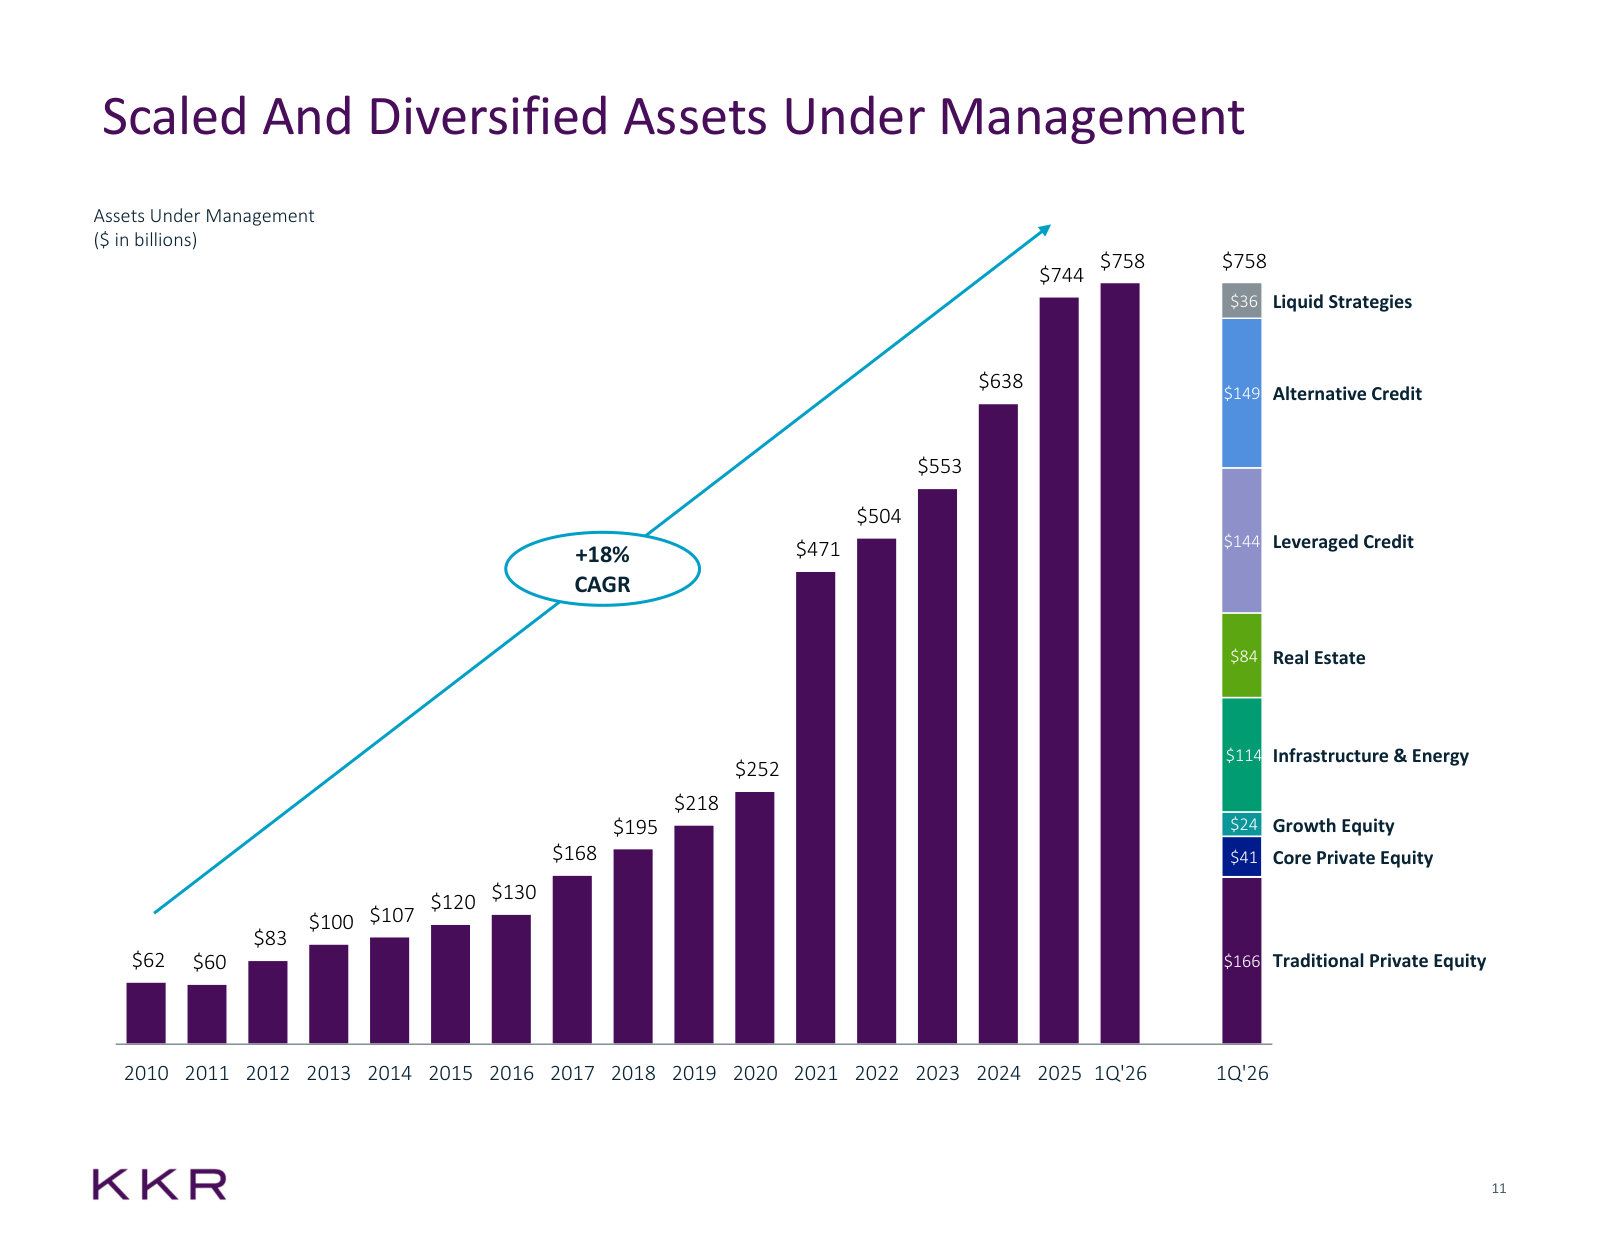
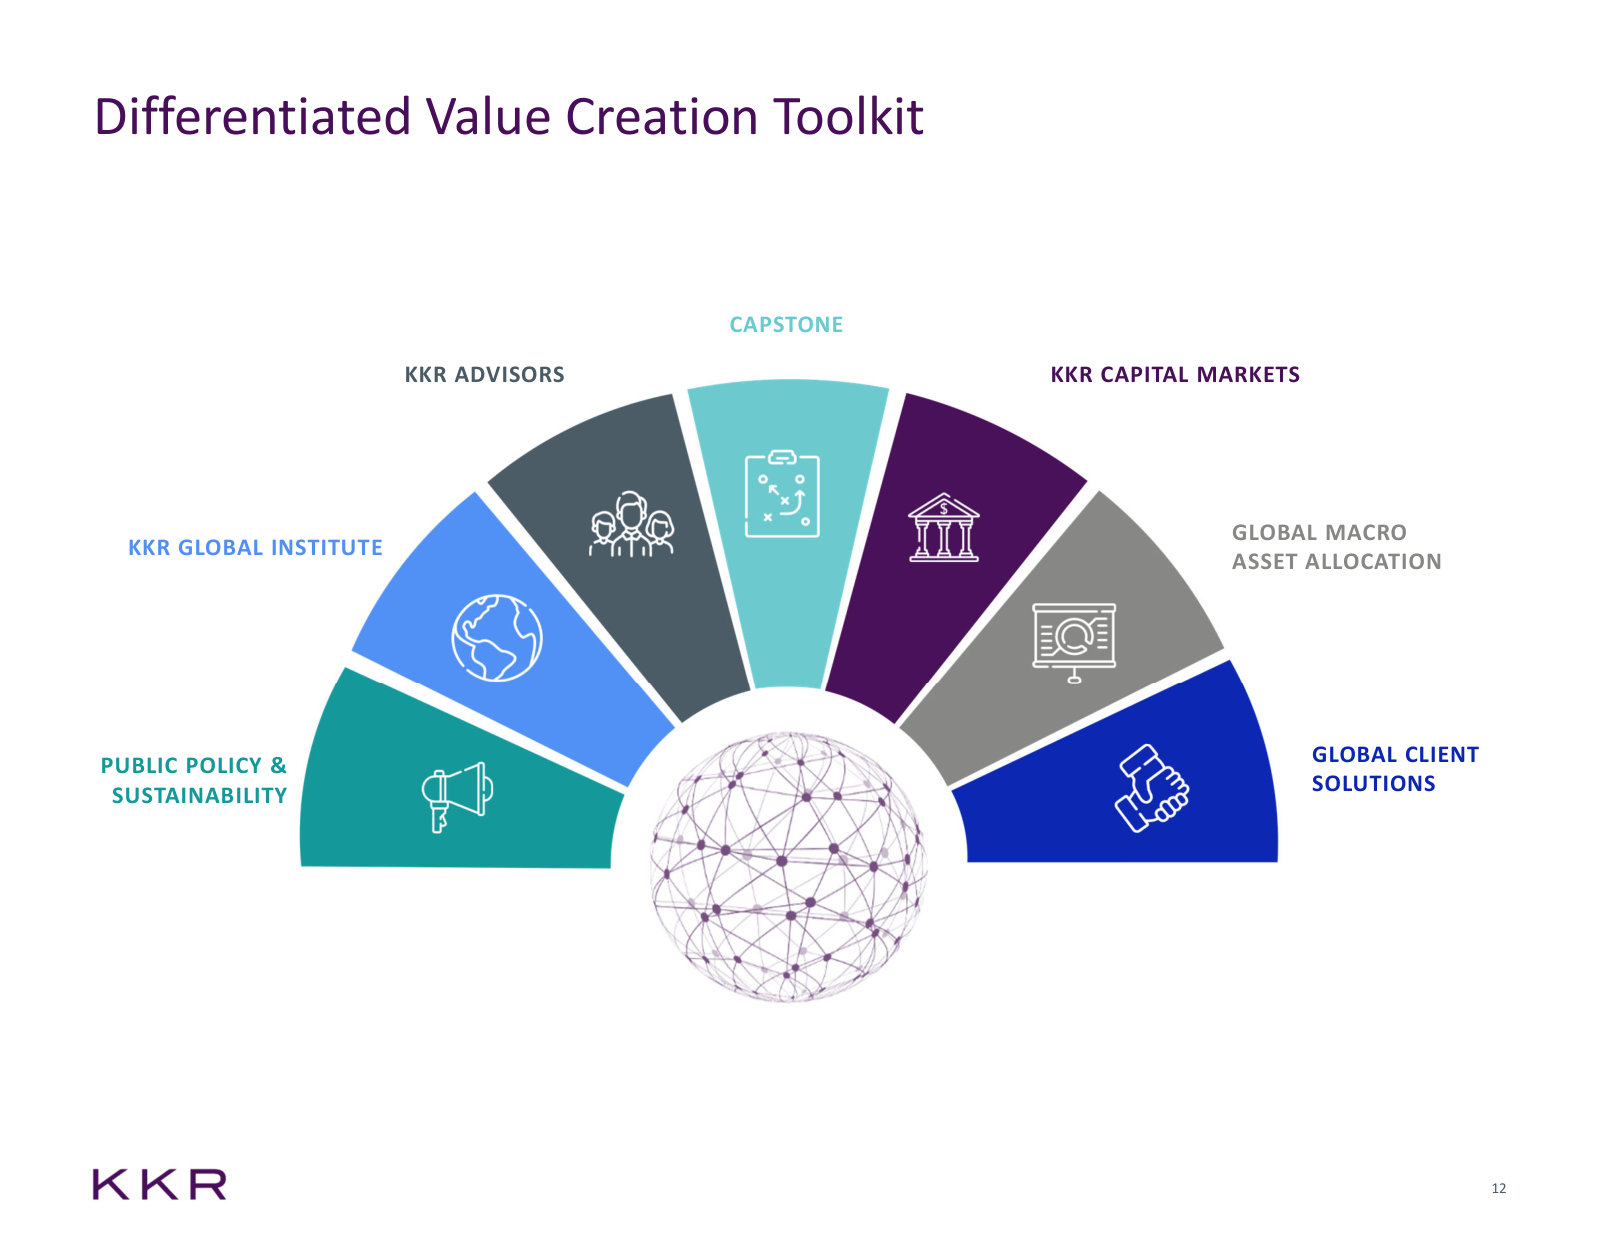
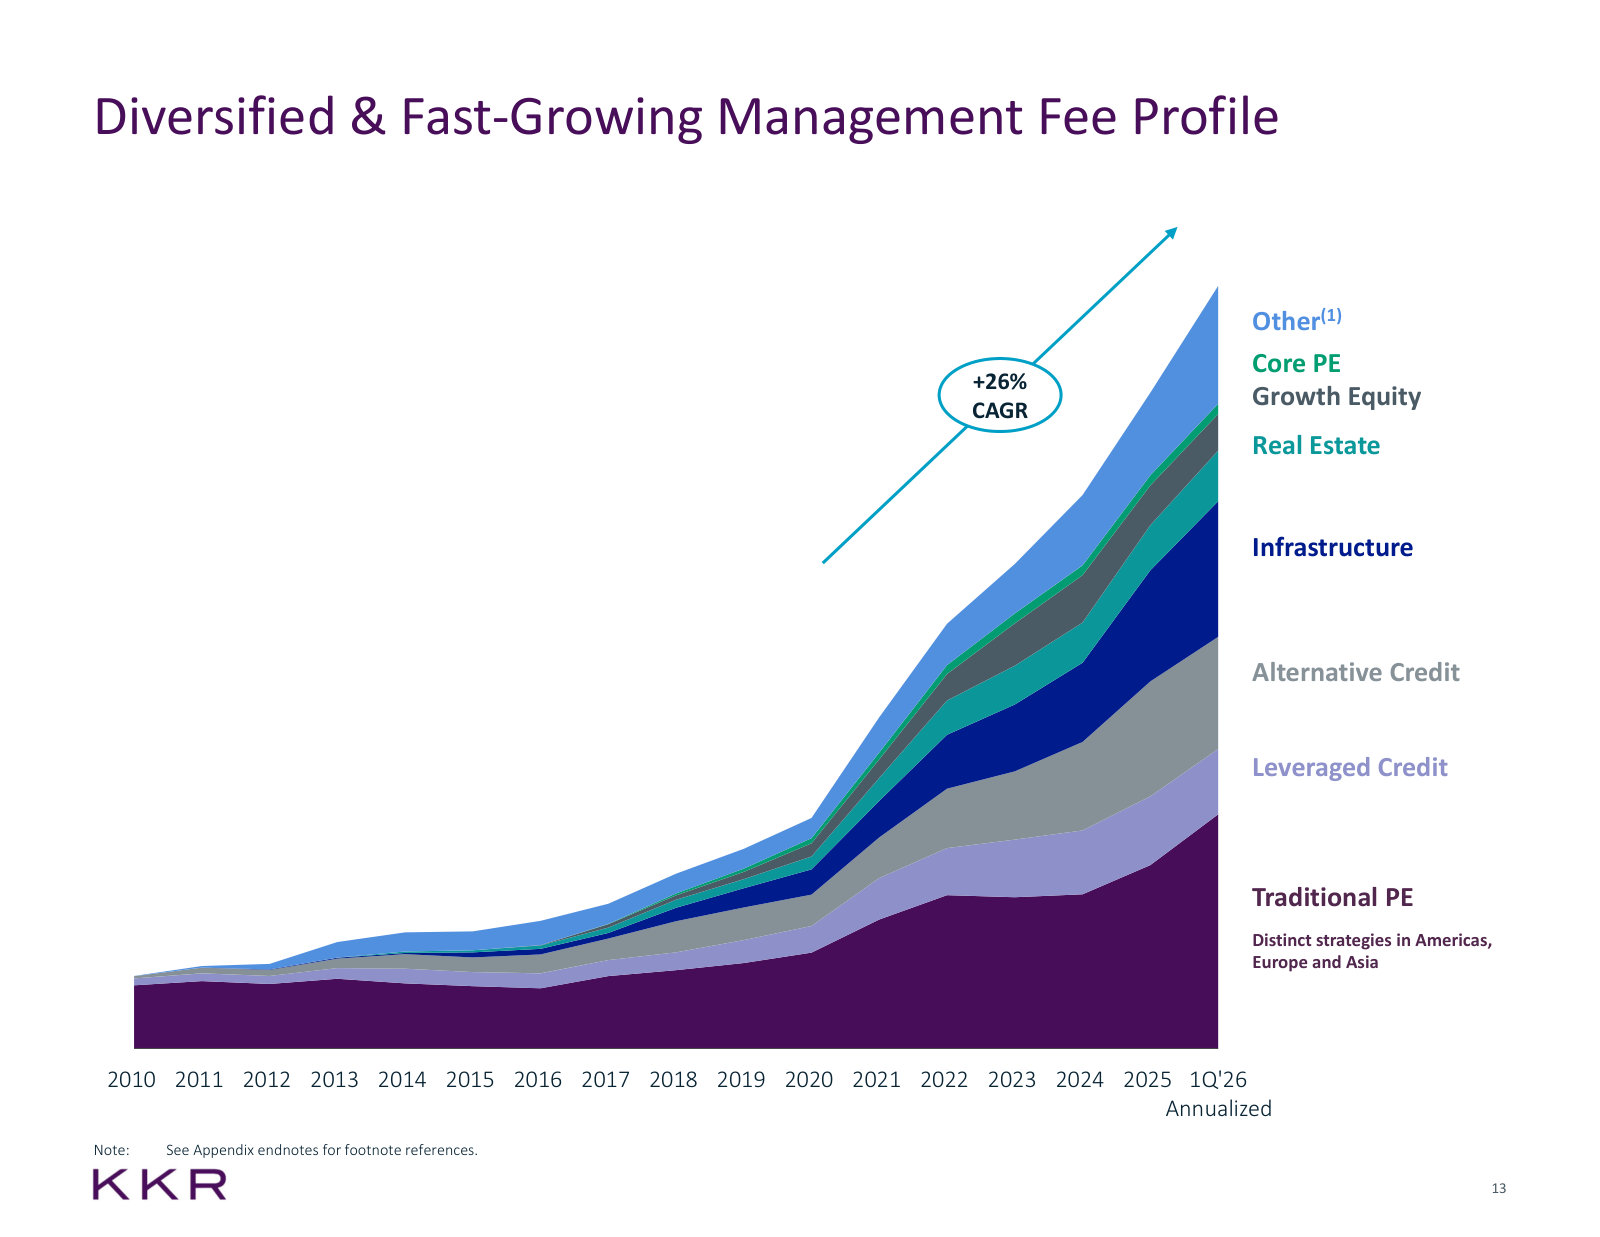
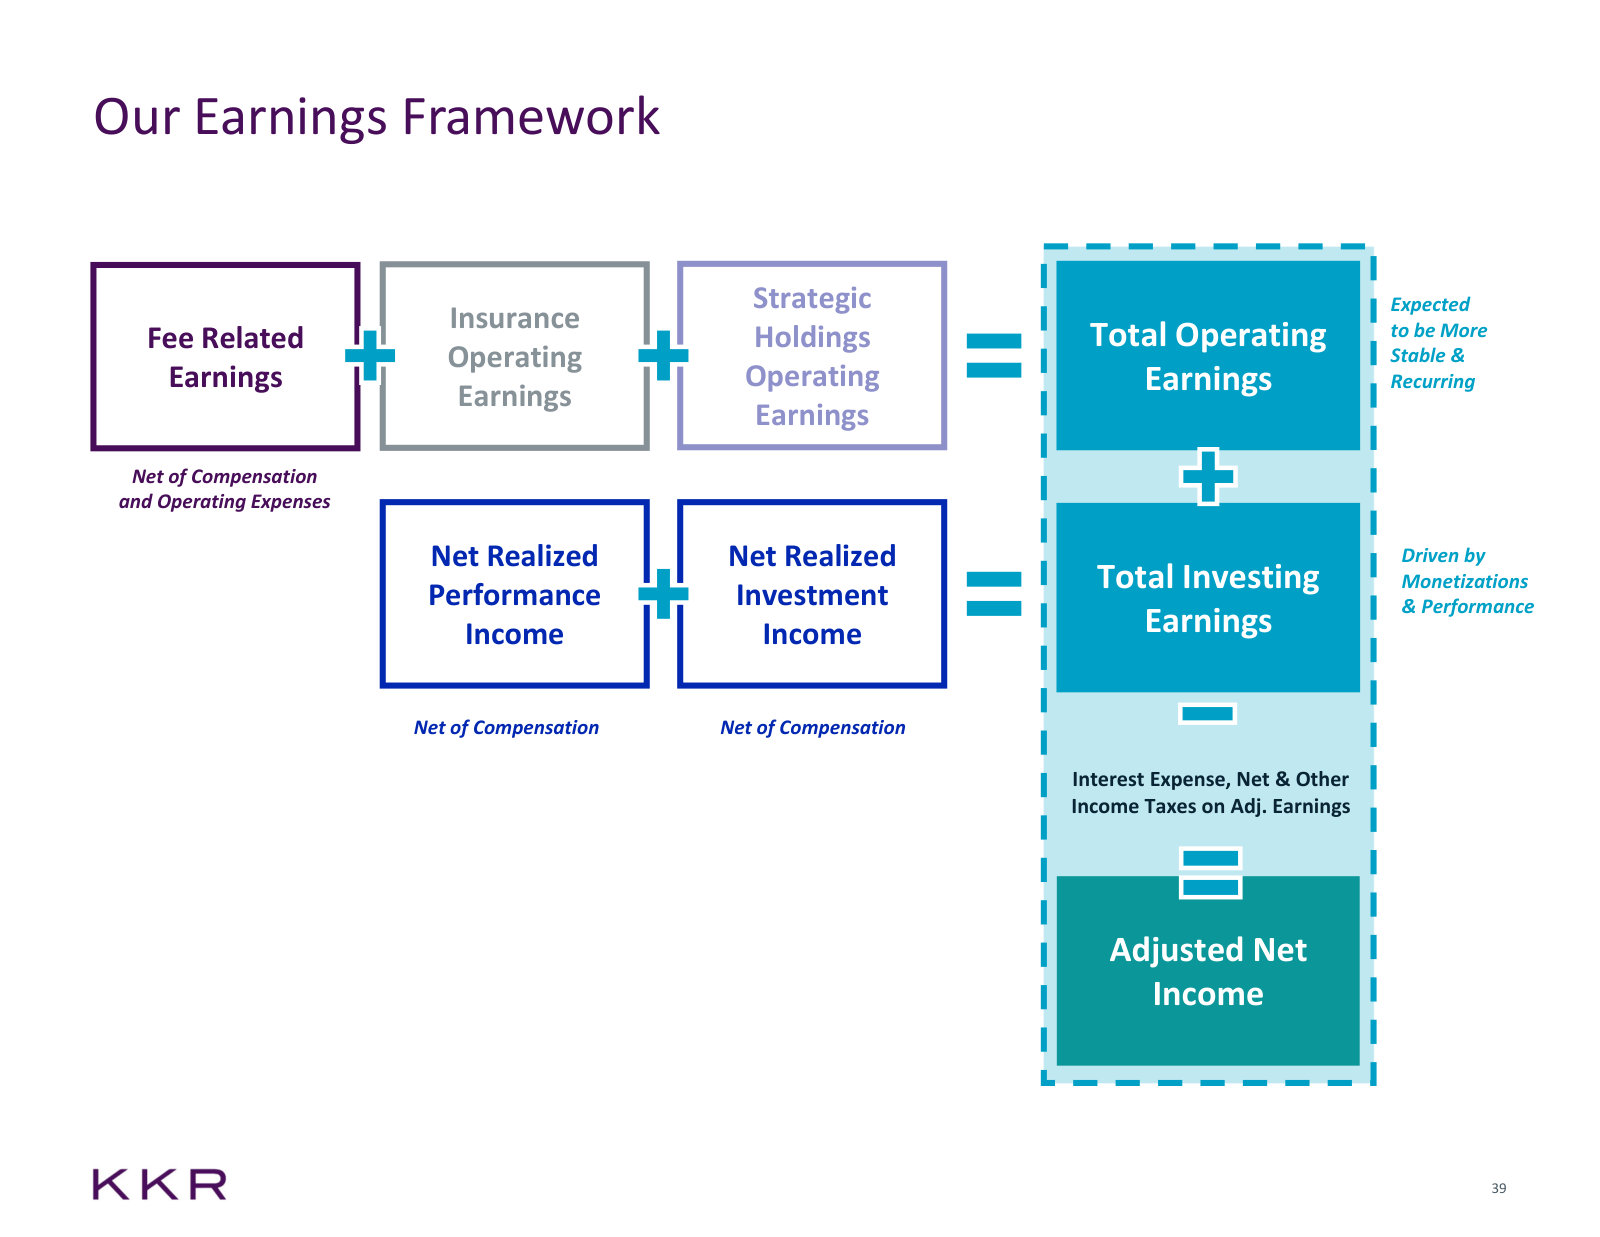
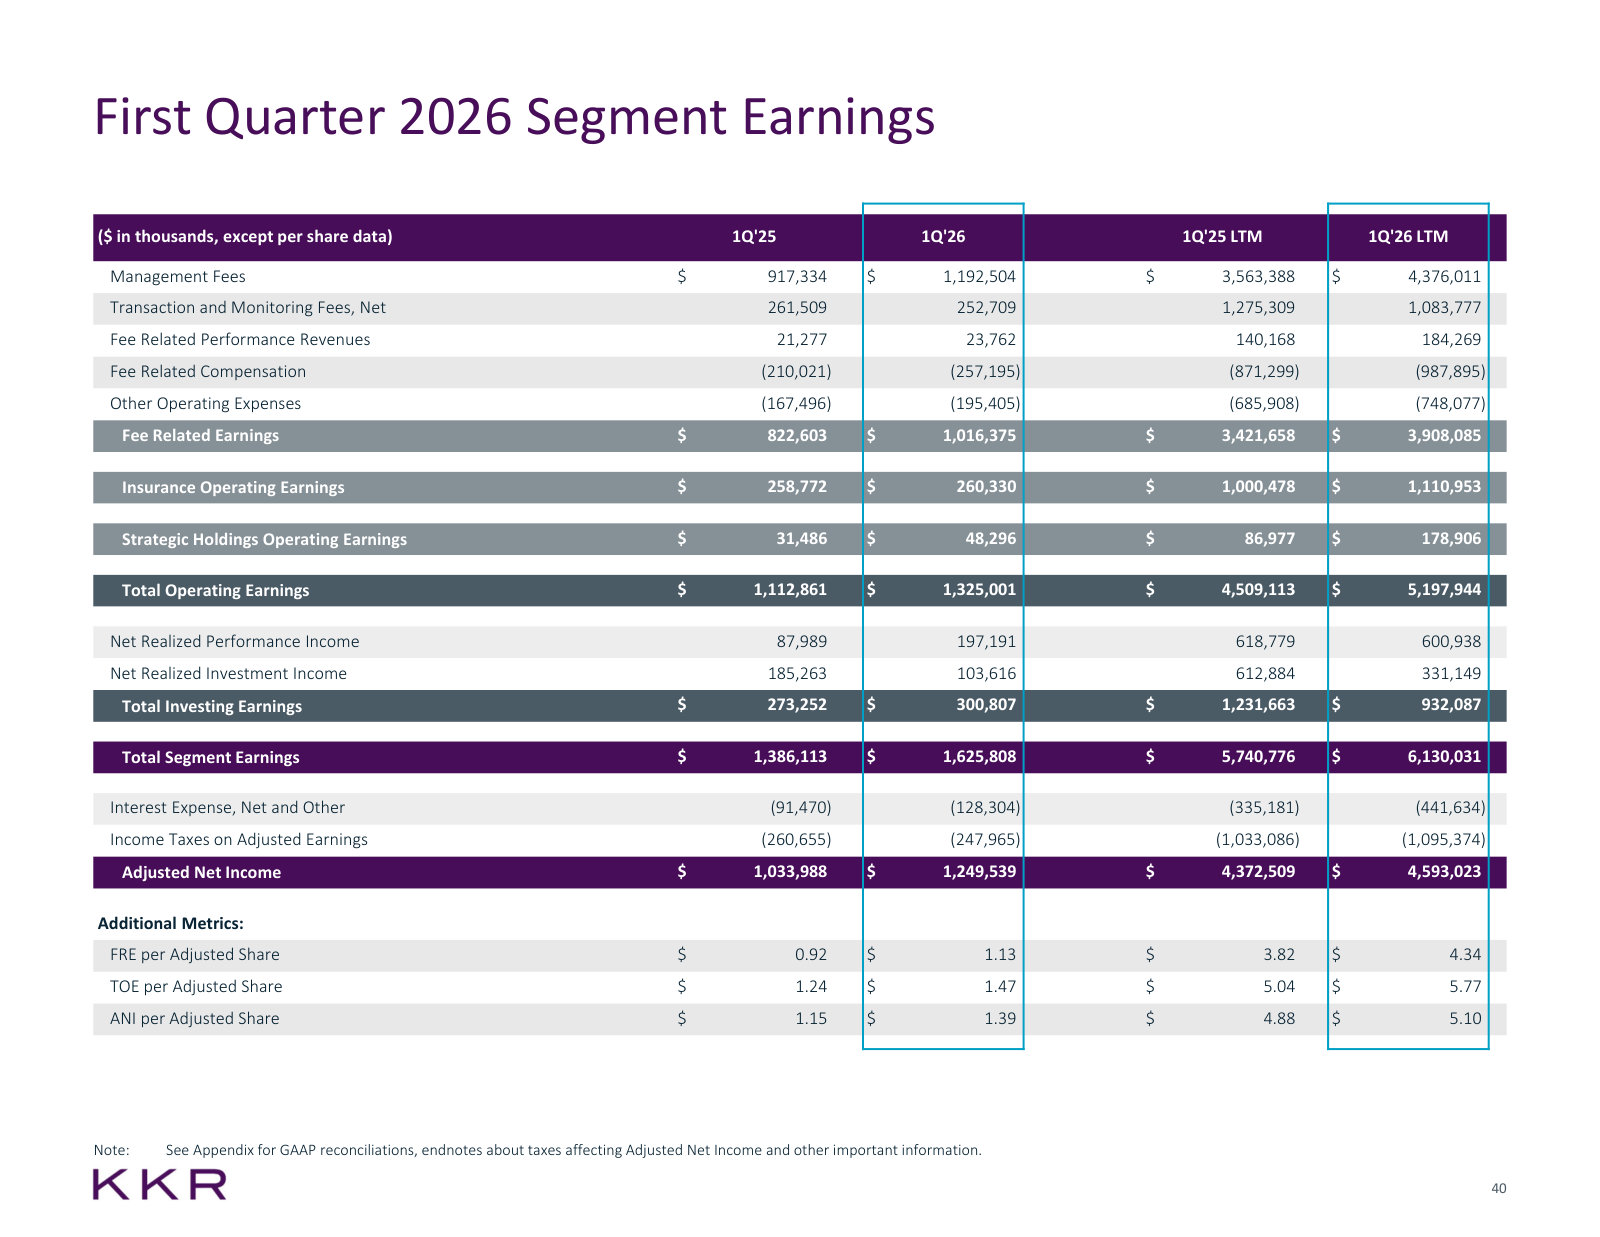
KKR's current standing overview deck: what the firm owns, how the three segments earn, and where management says growth comes from. · Open the full document →
Investor Day 2024 — 2024
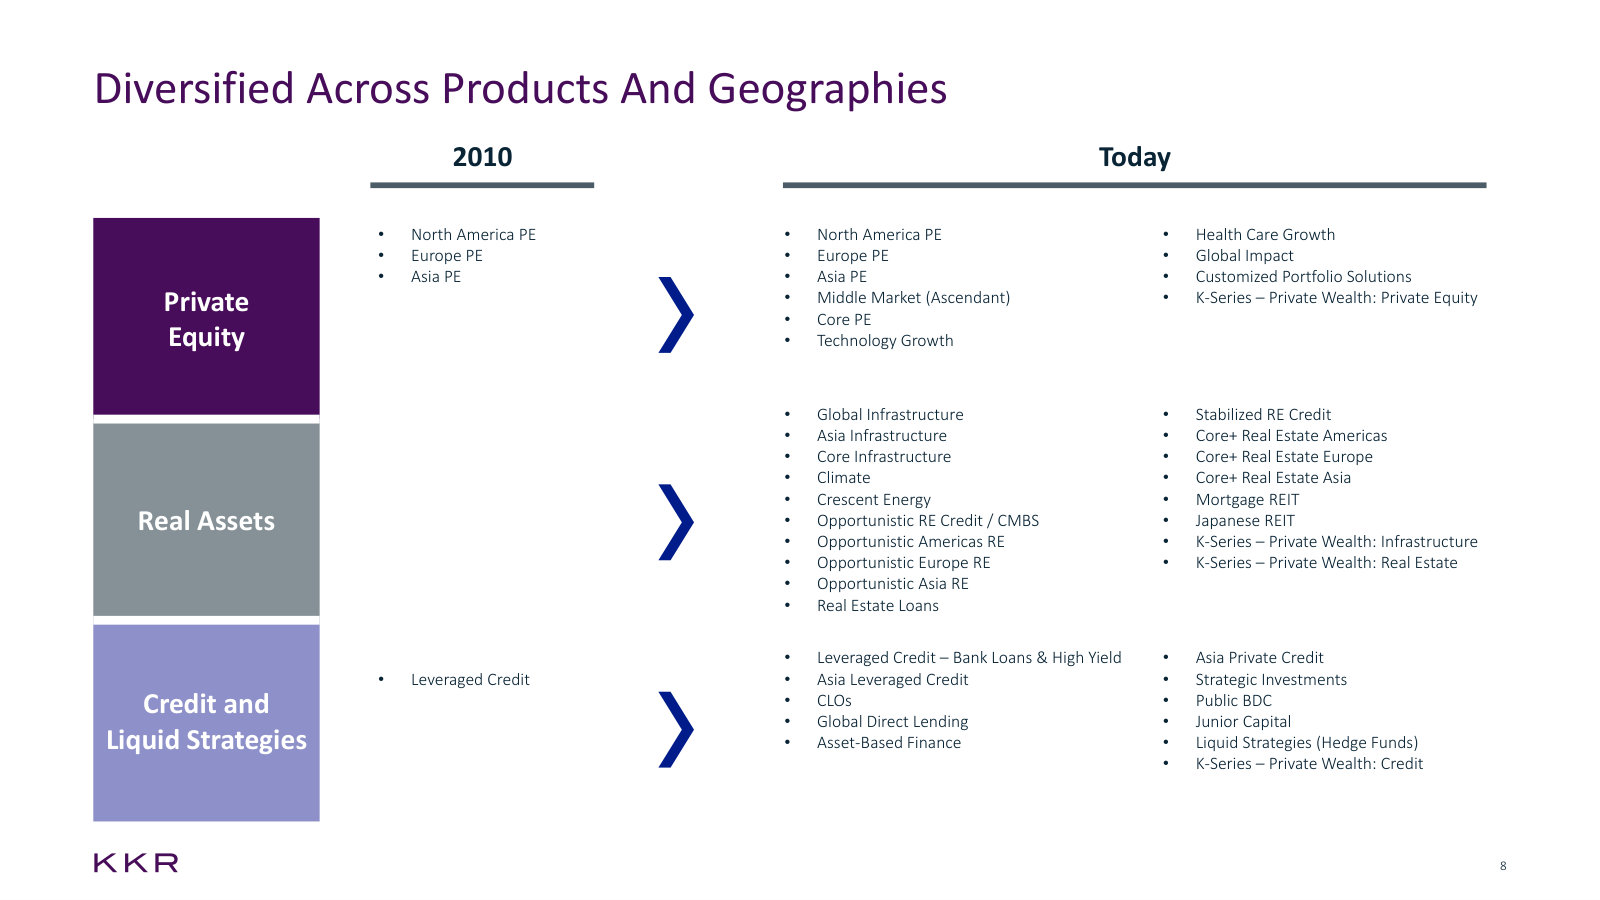
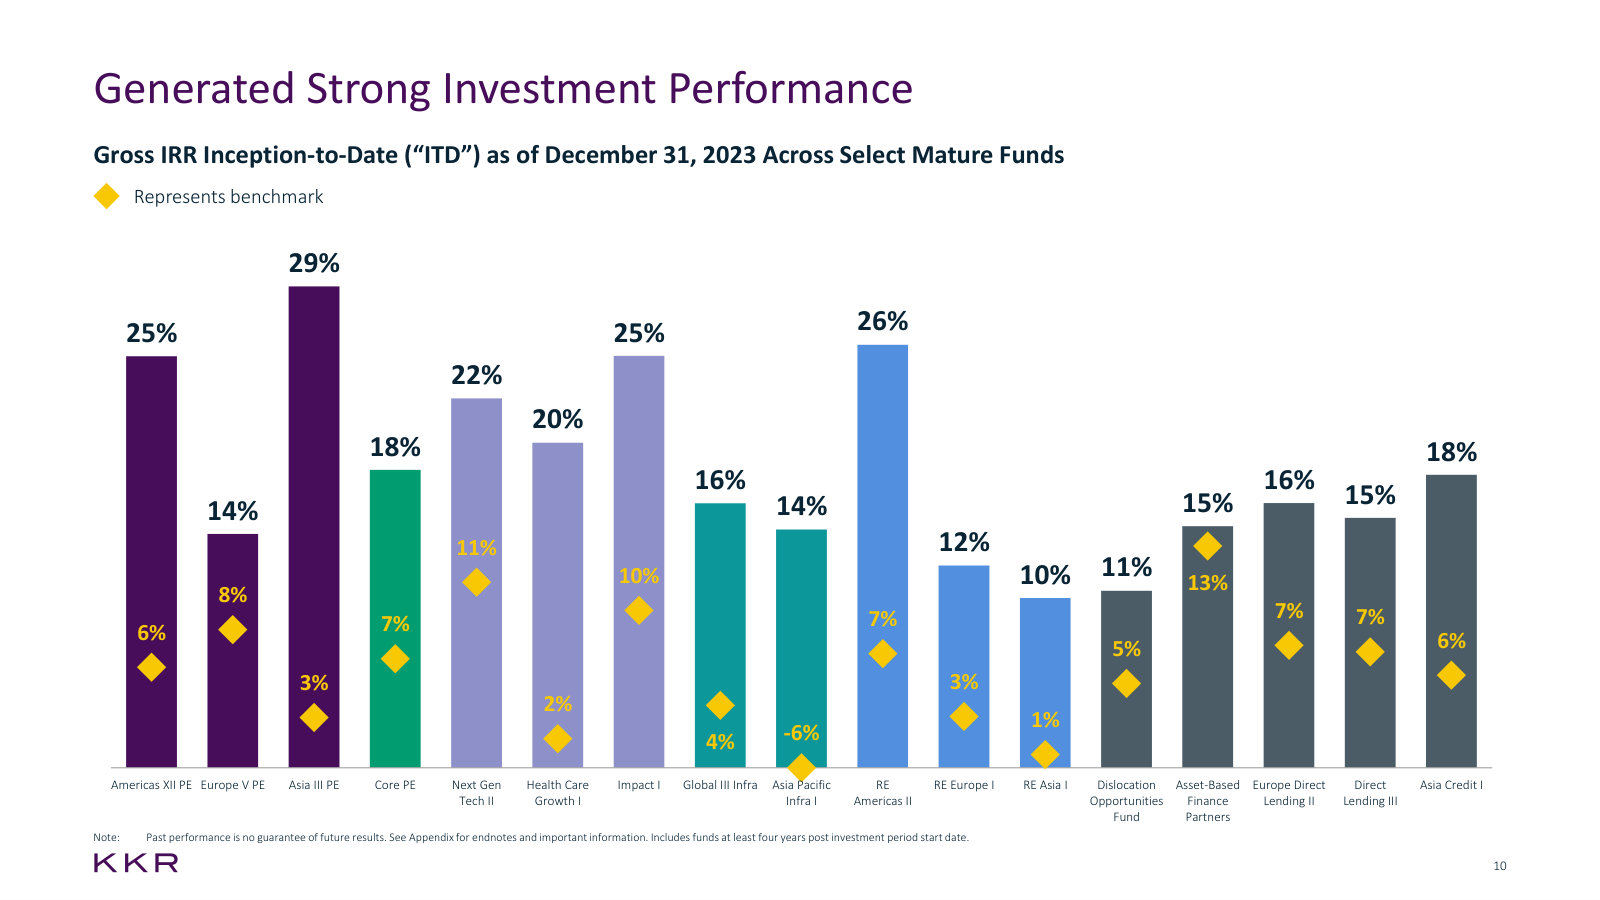
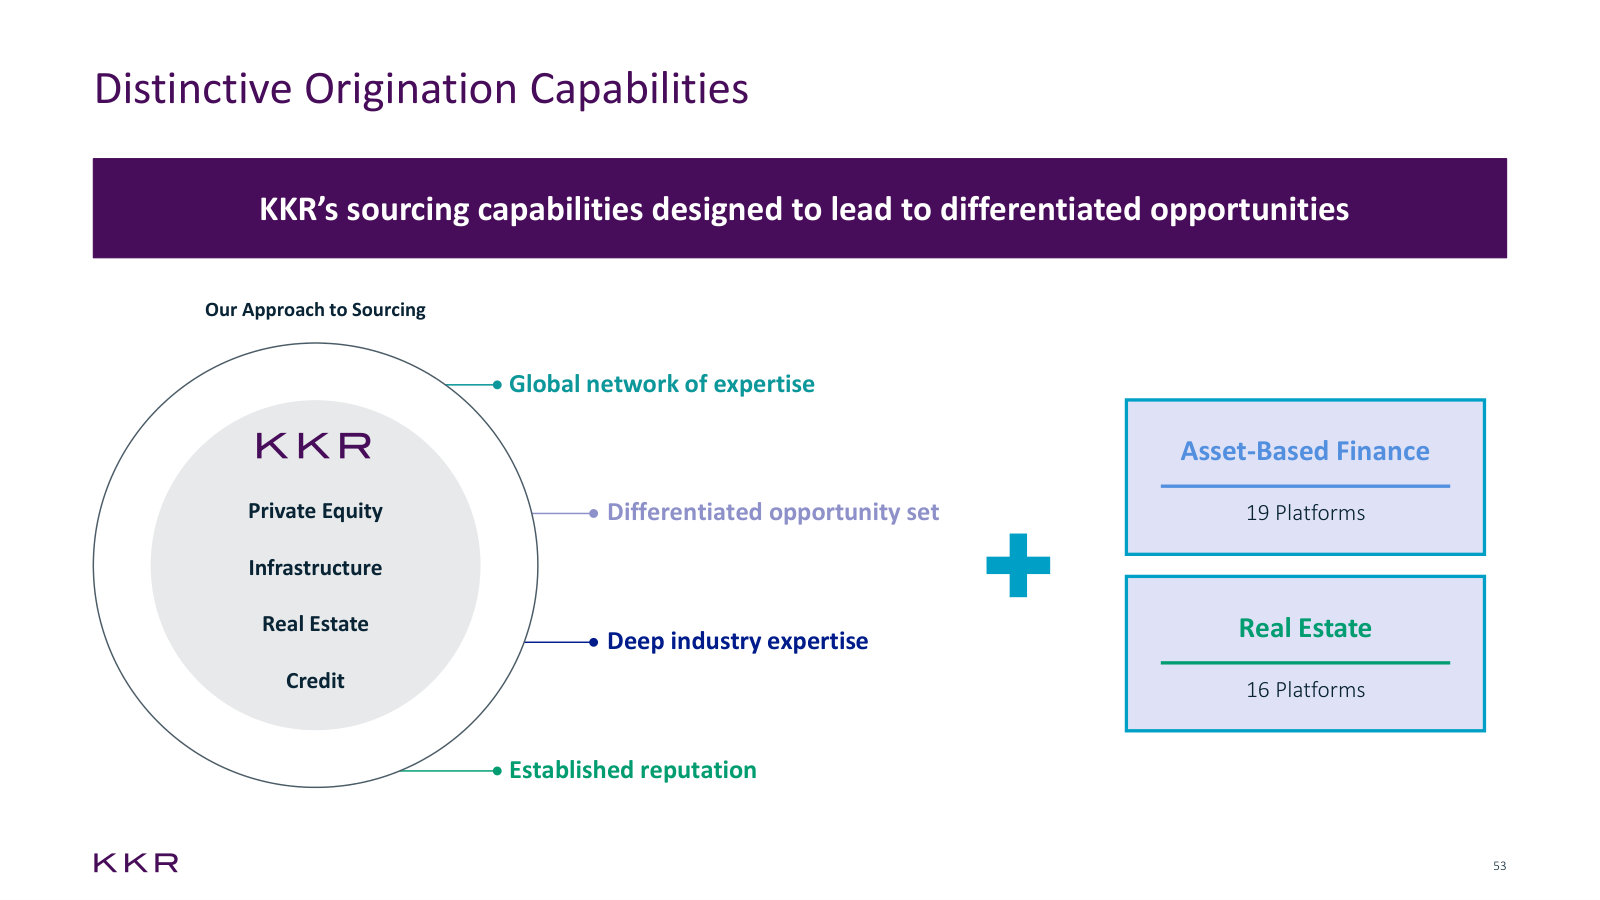
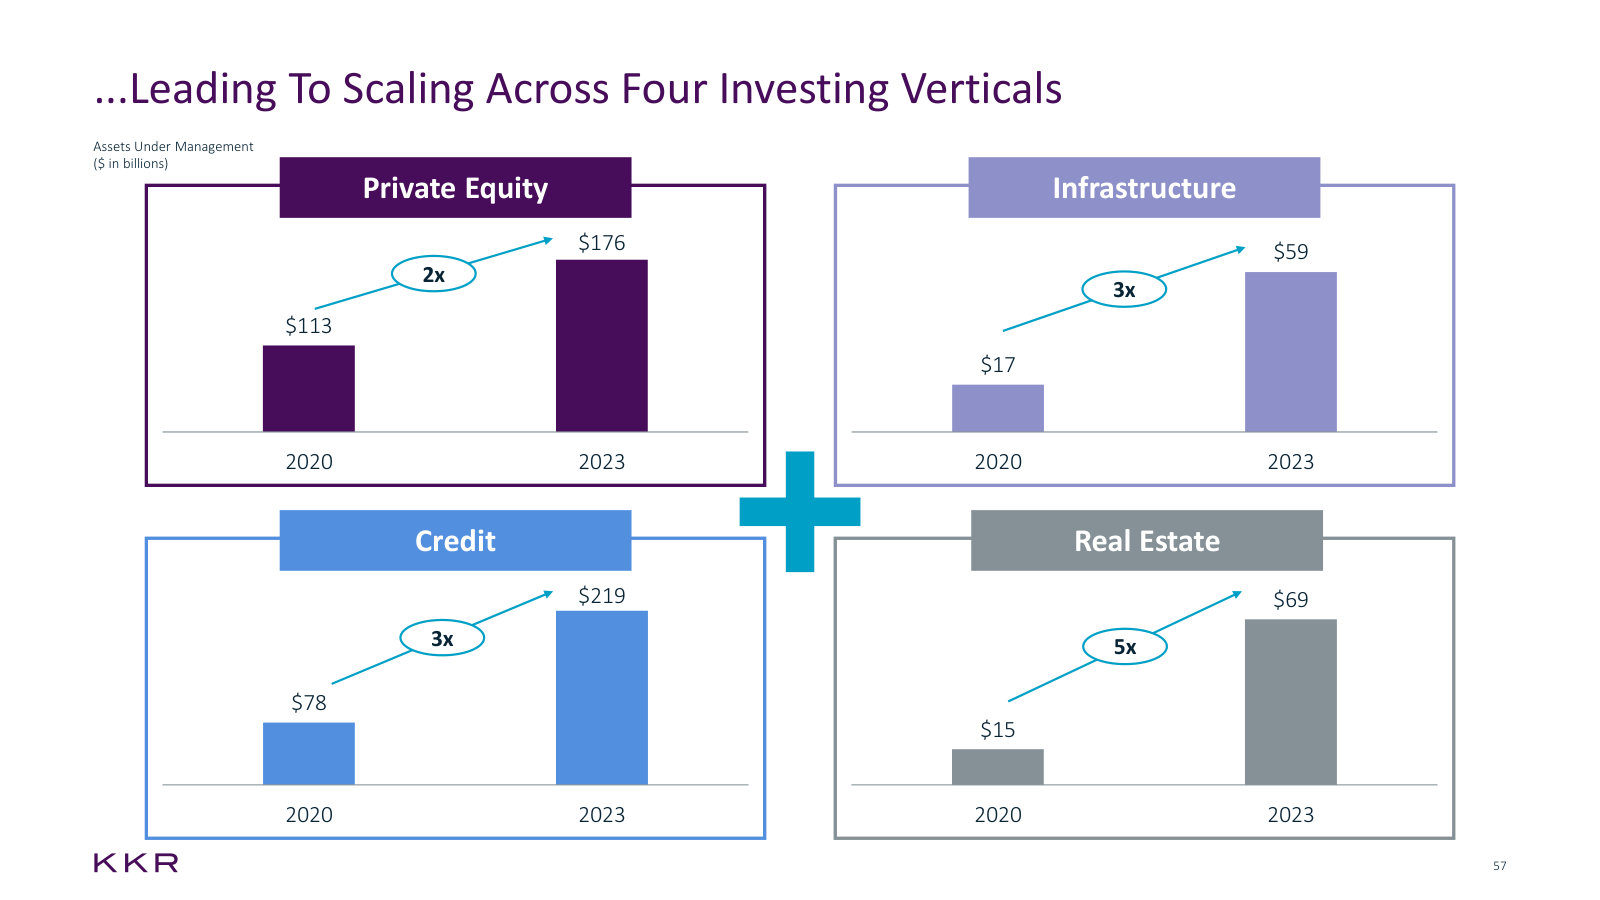
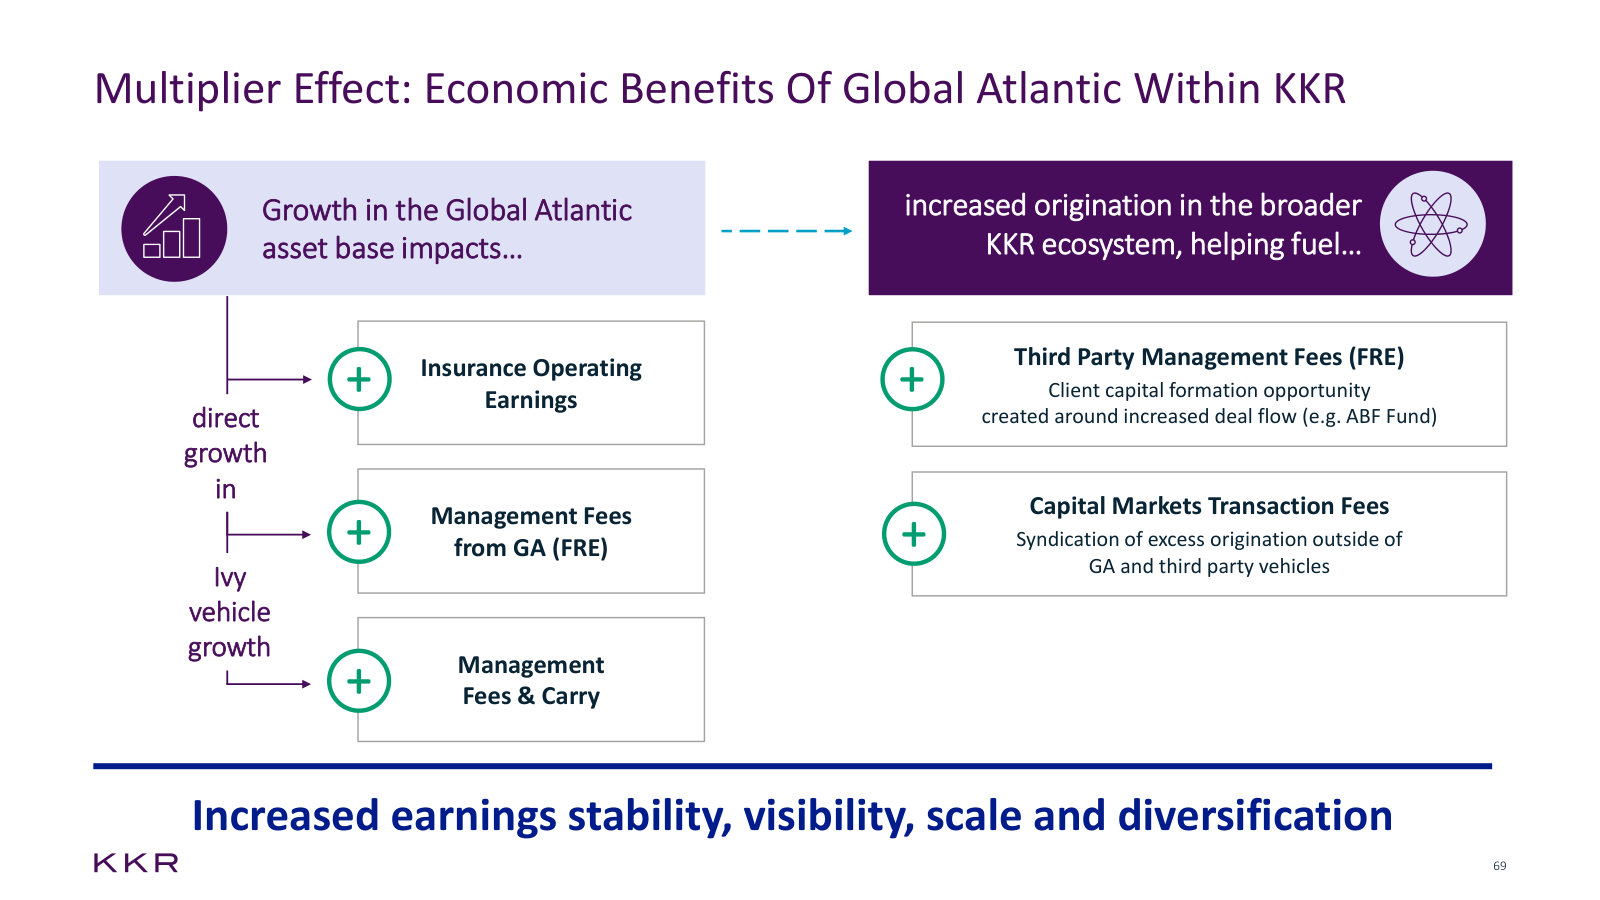
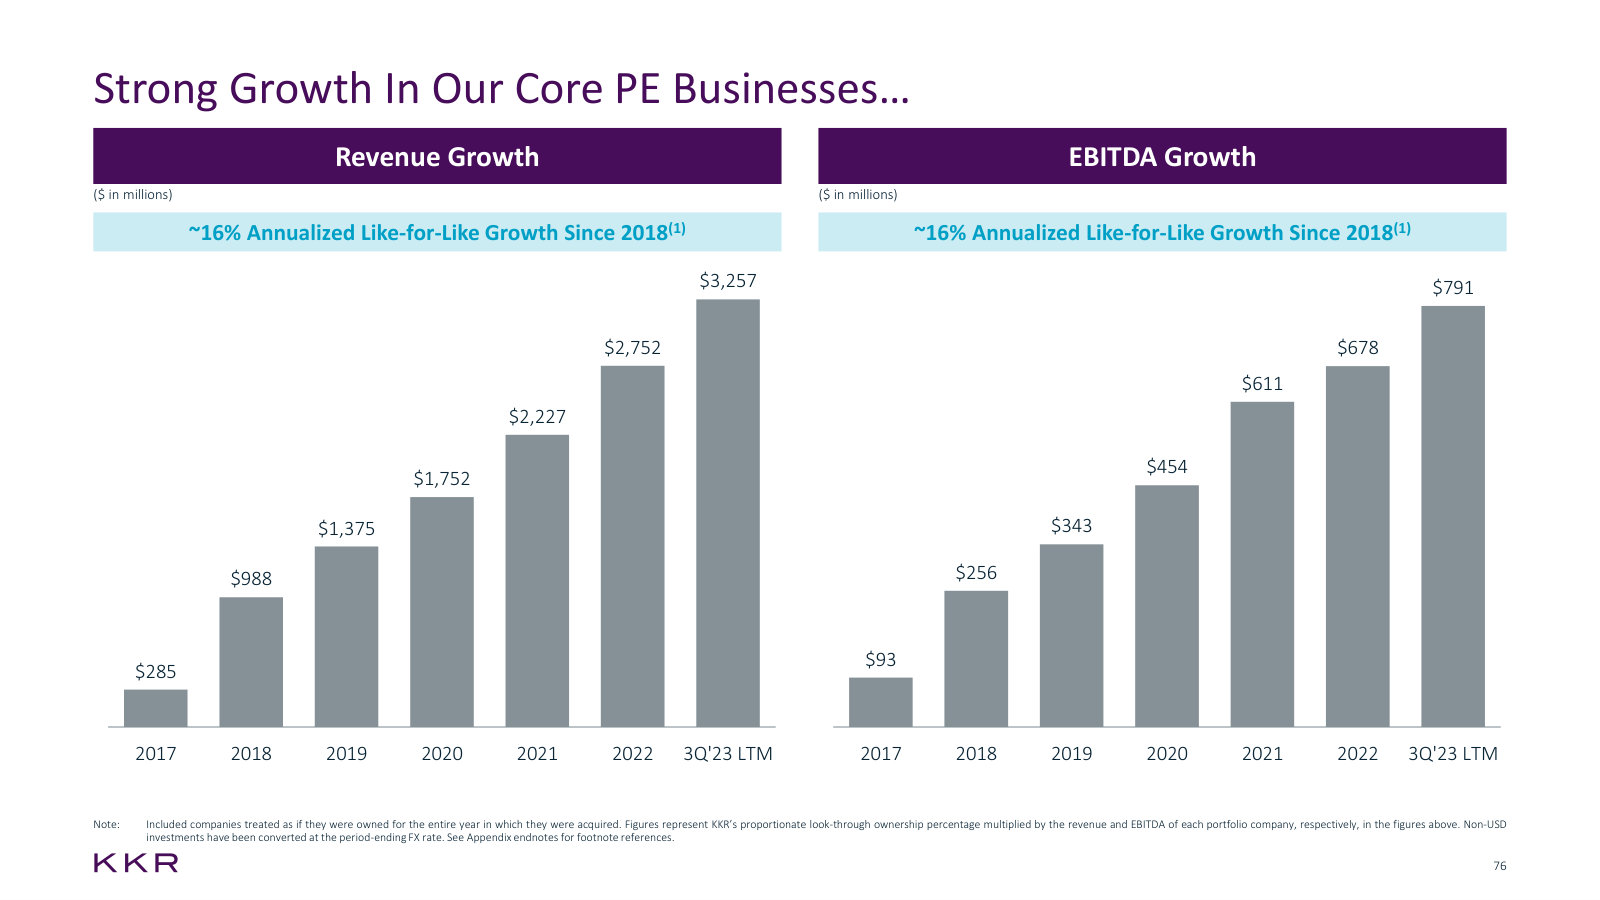
KKR's most recent investor day — 302 pages of segment-by-segment detail and the medium-term targets management set for itself. · Open the full document →
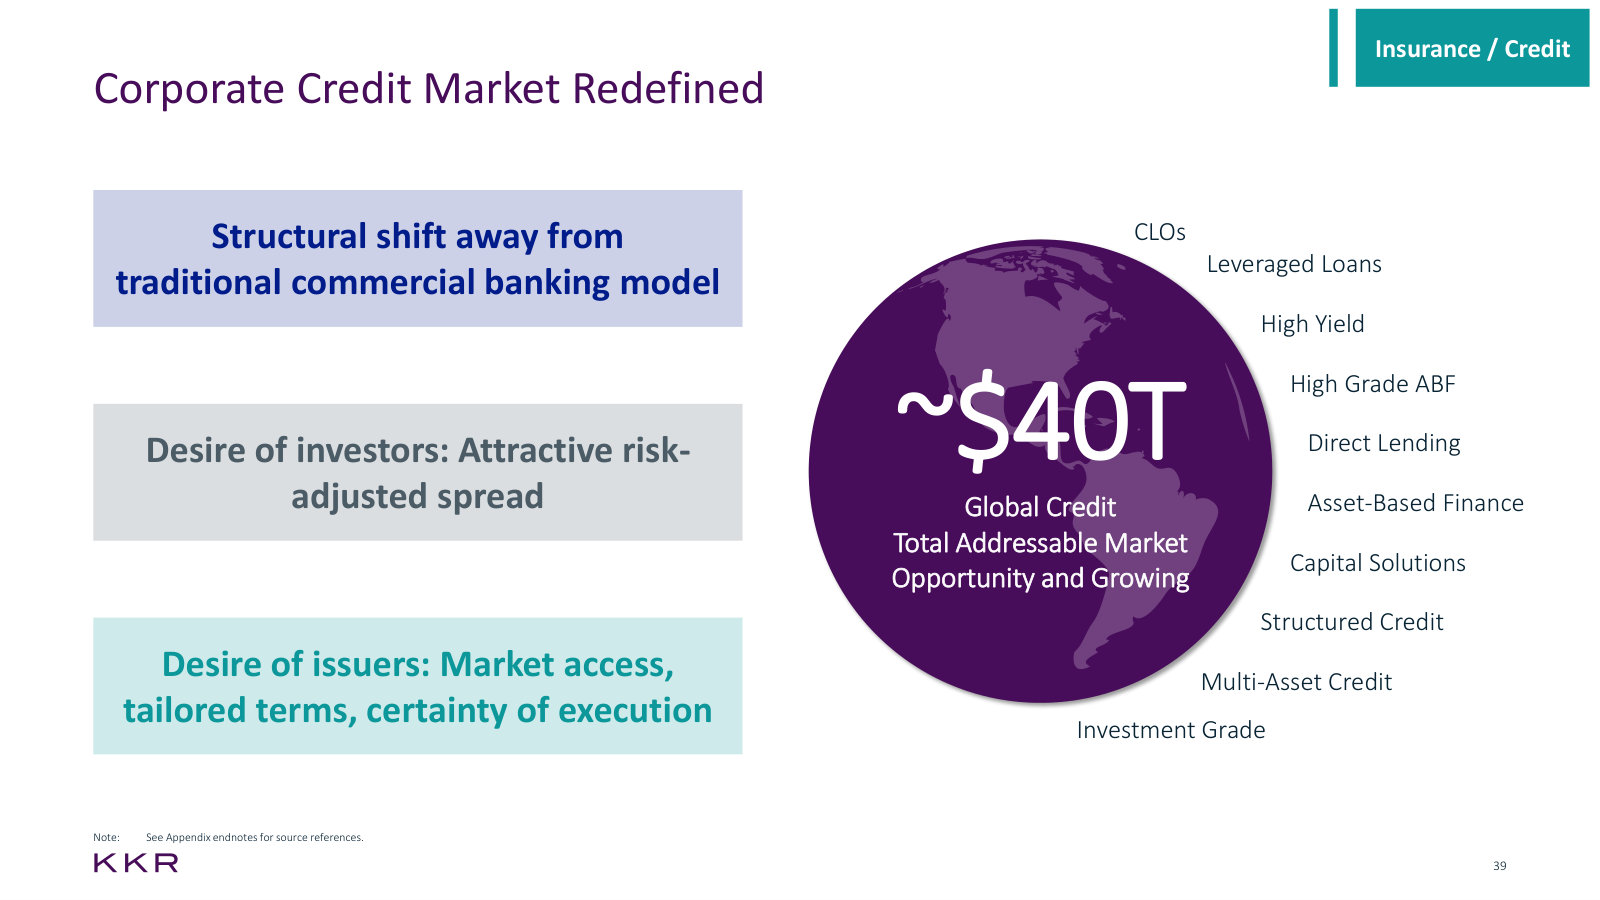
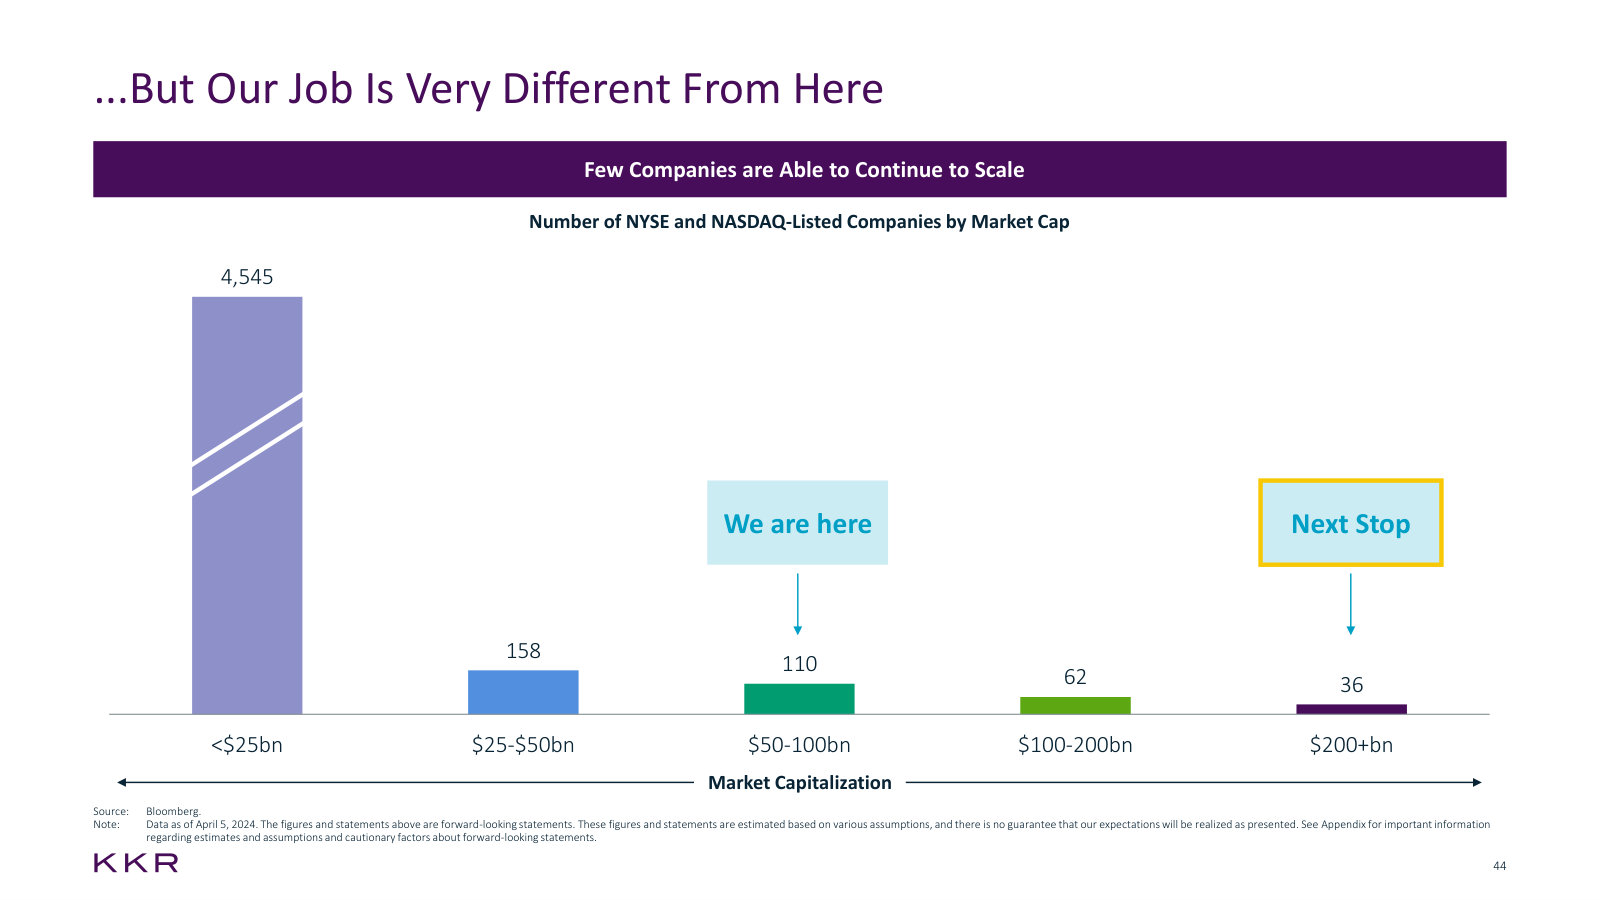
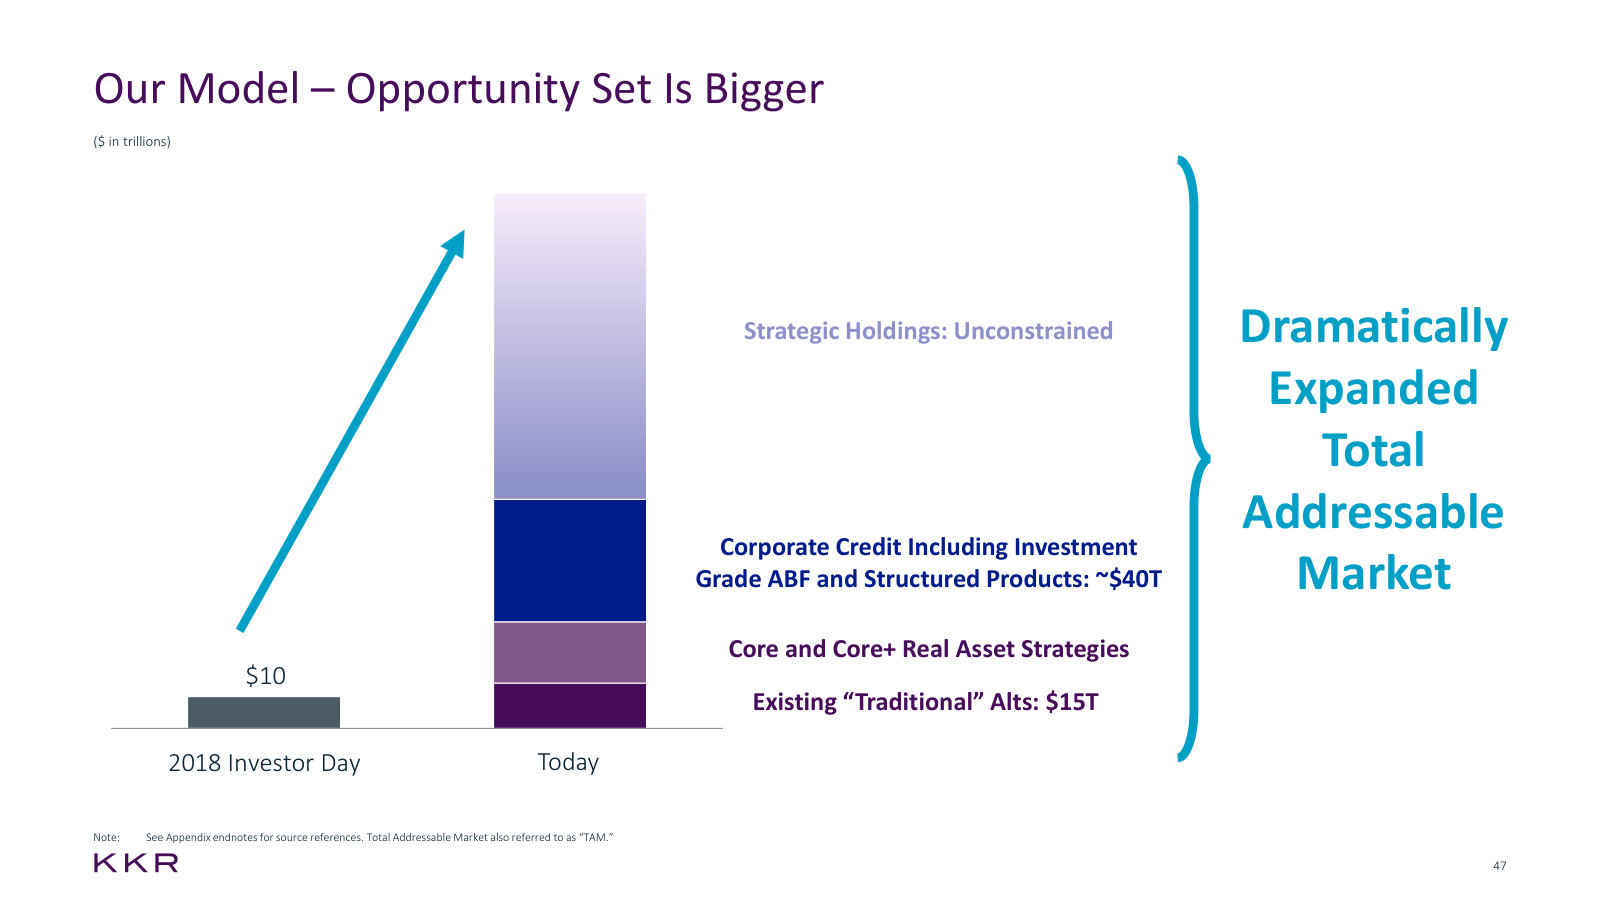
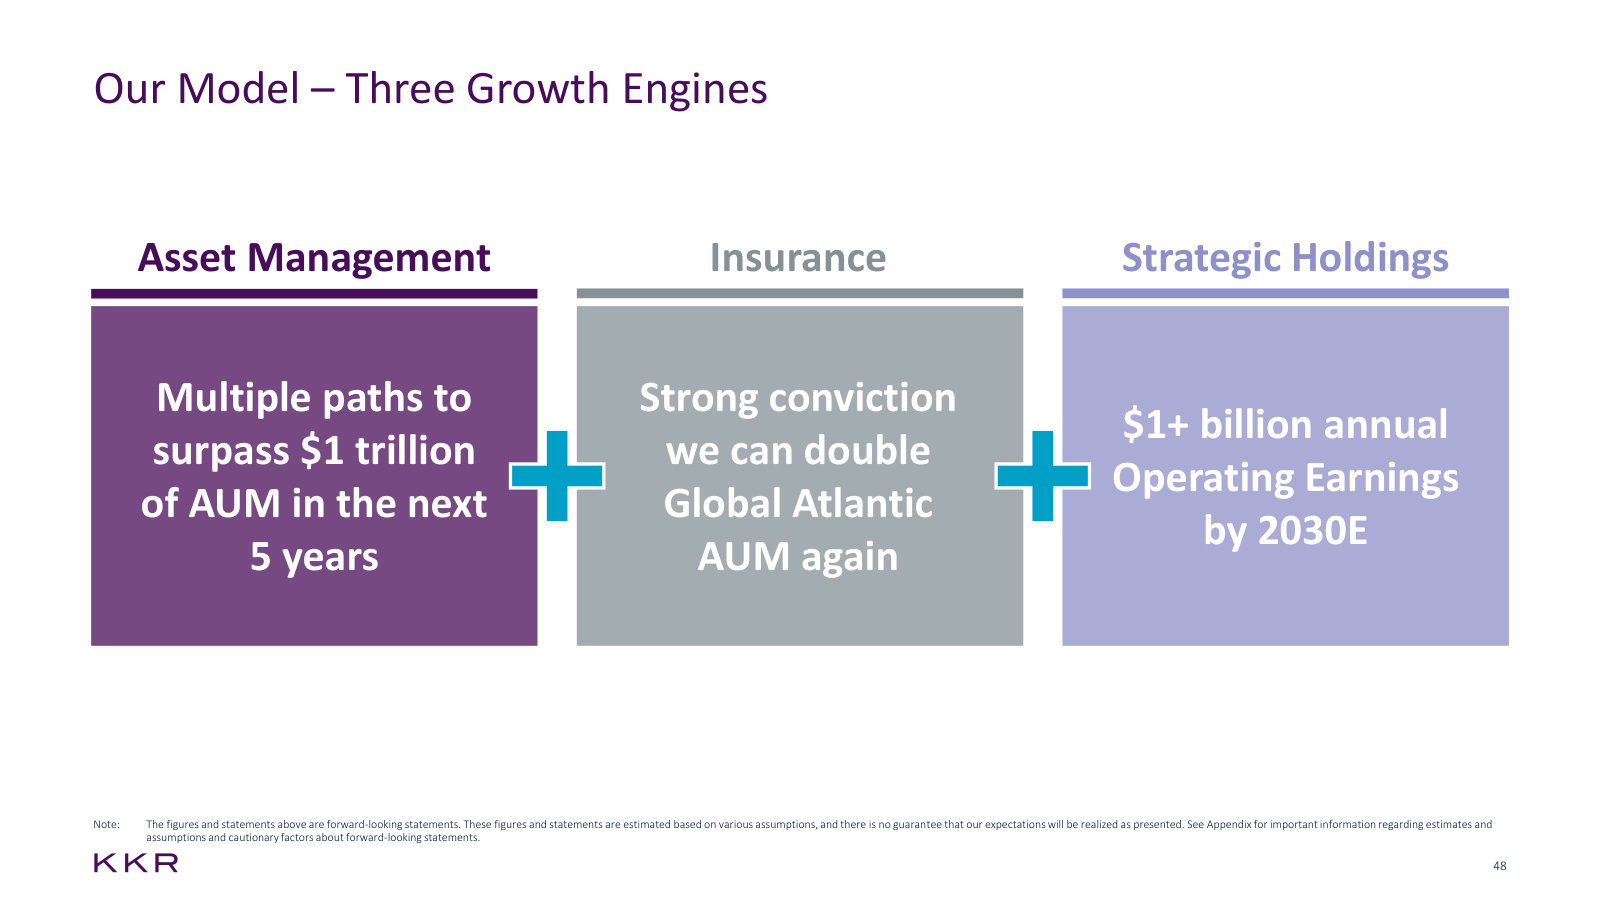
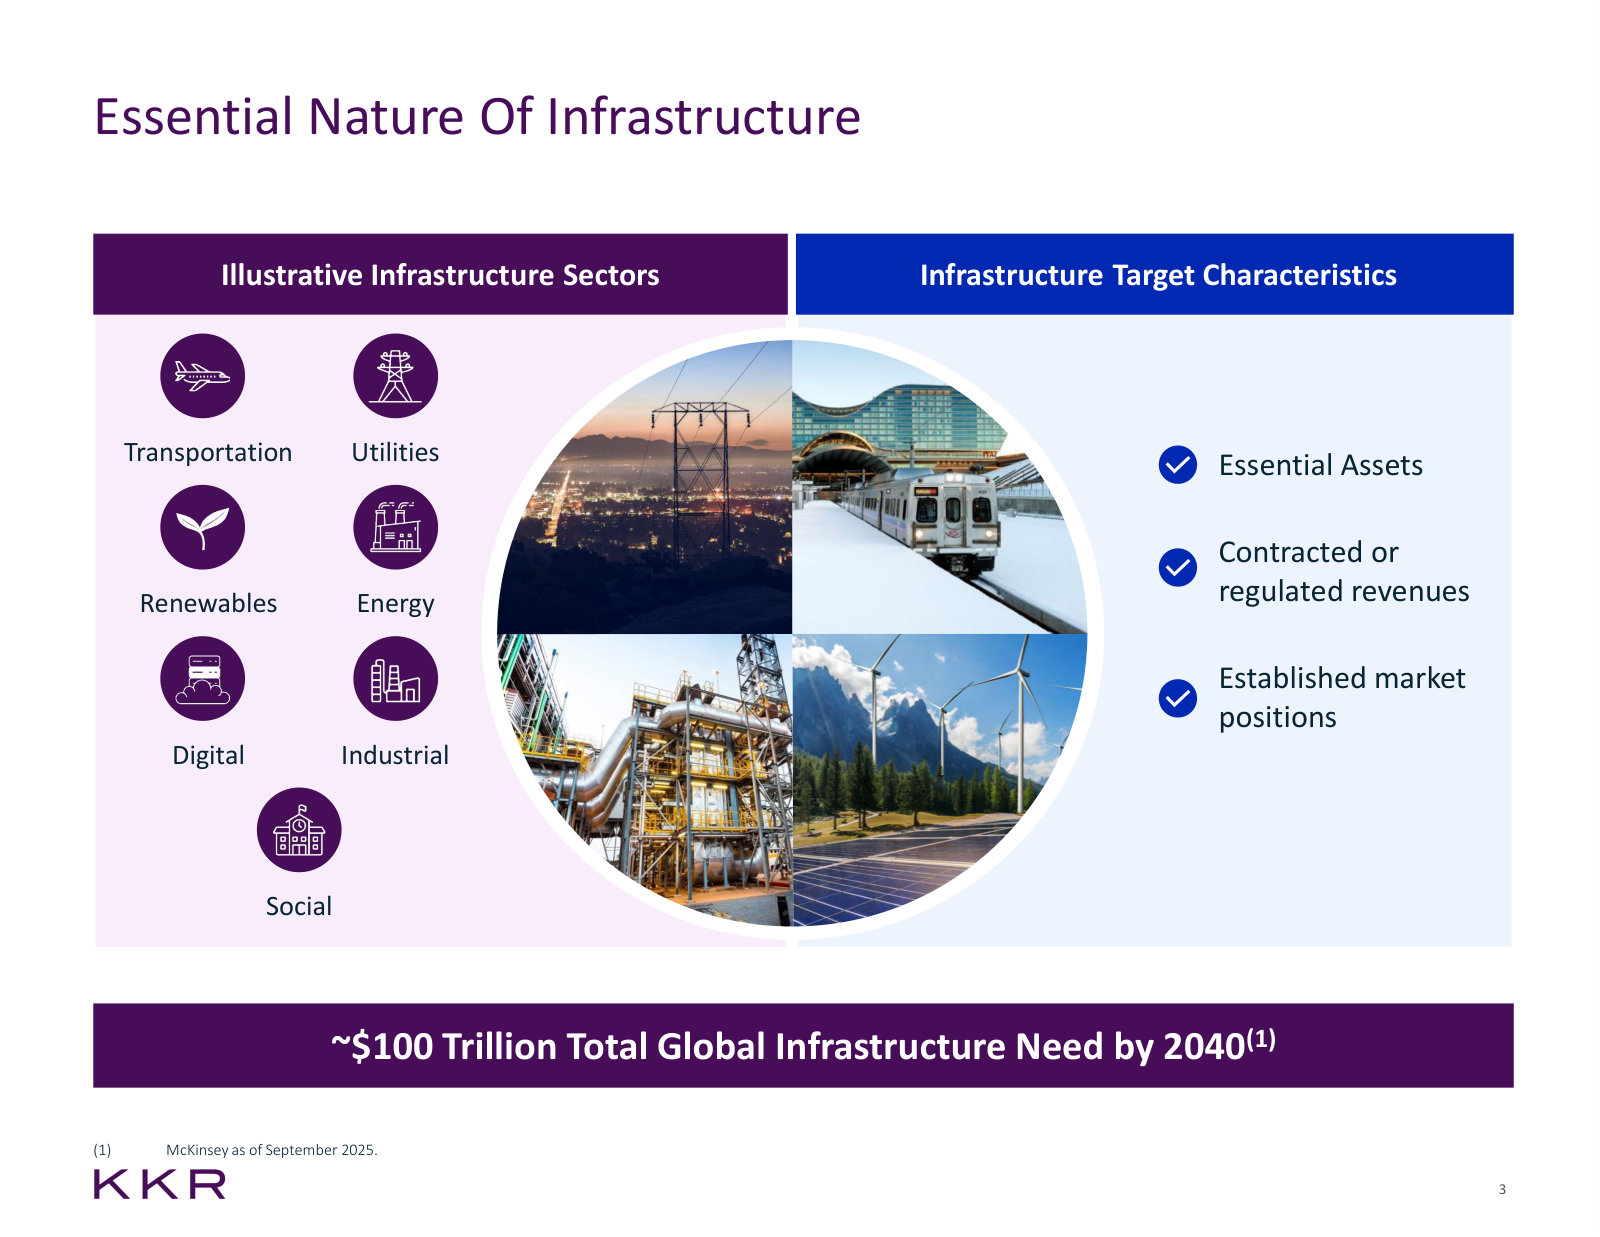
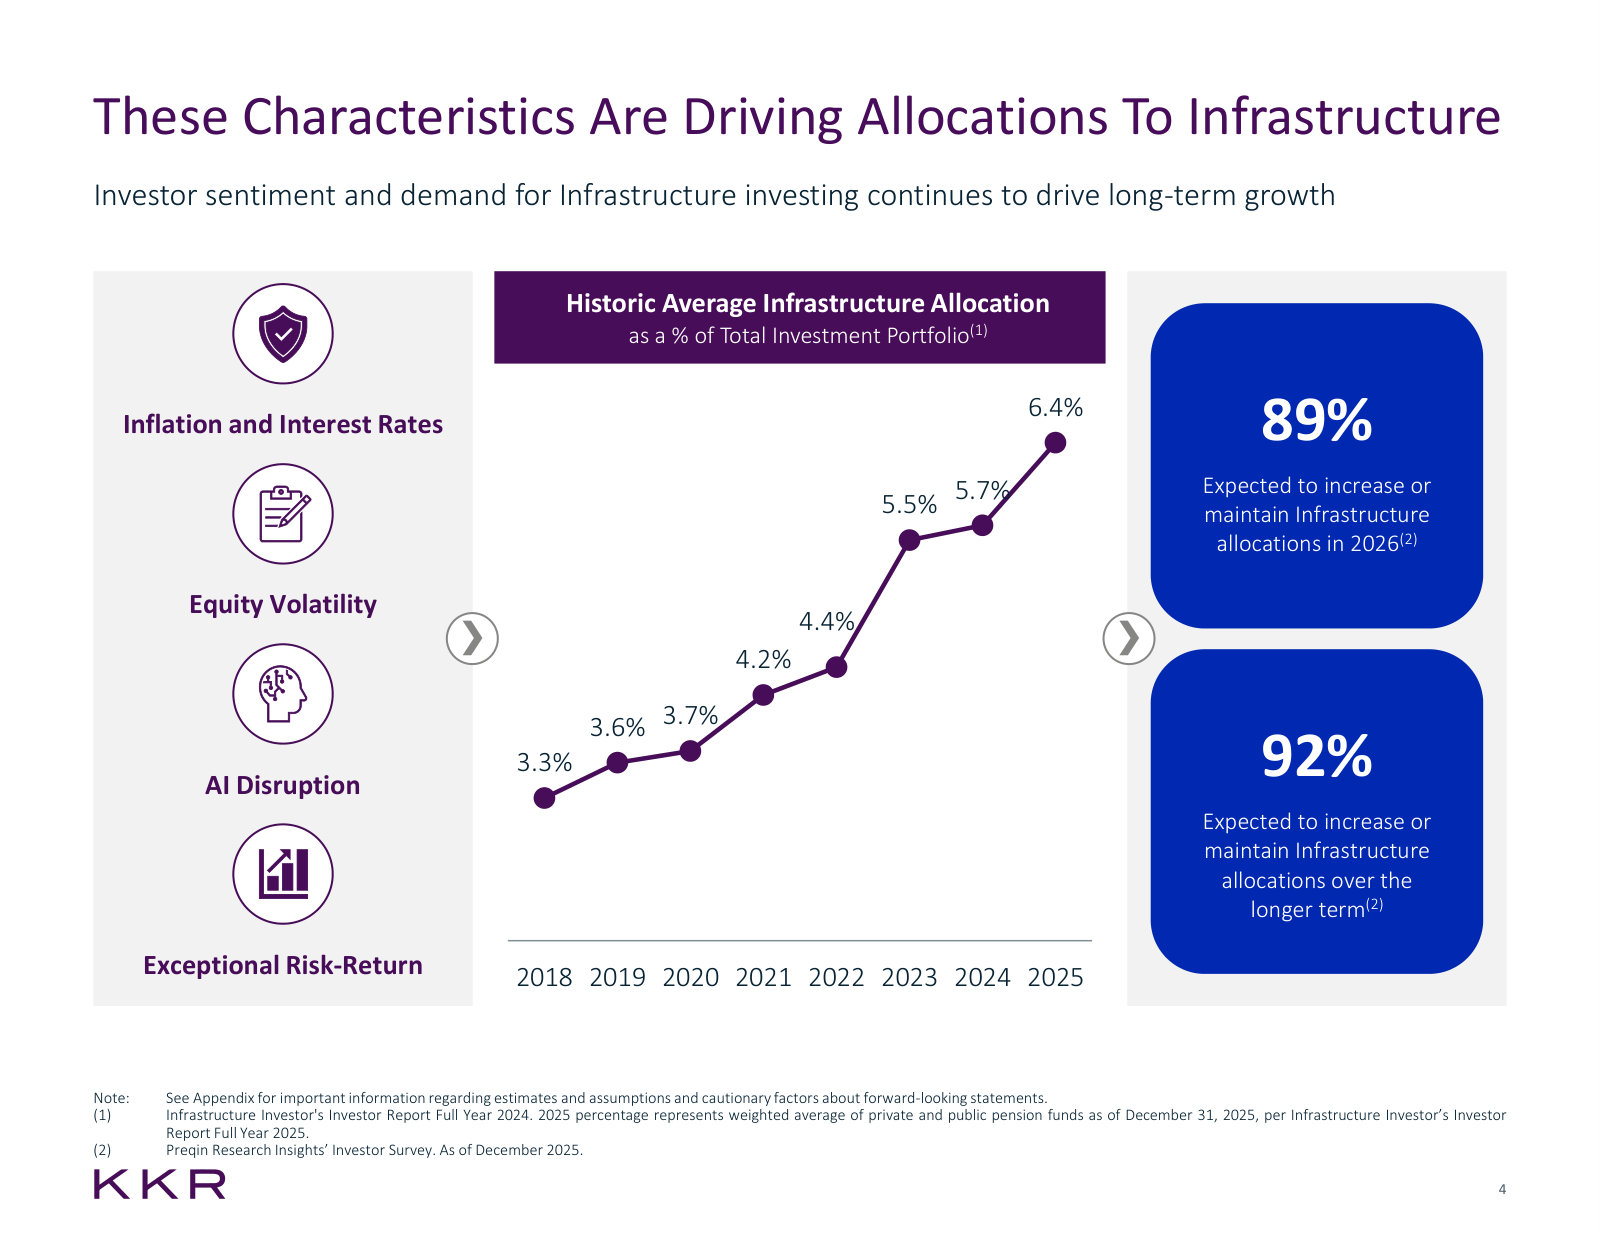
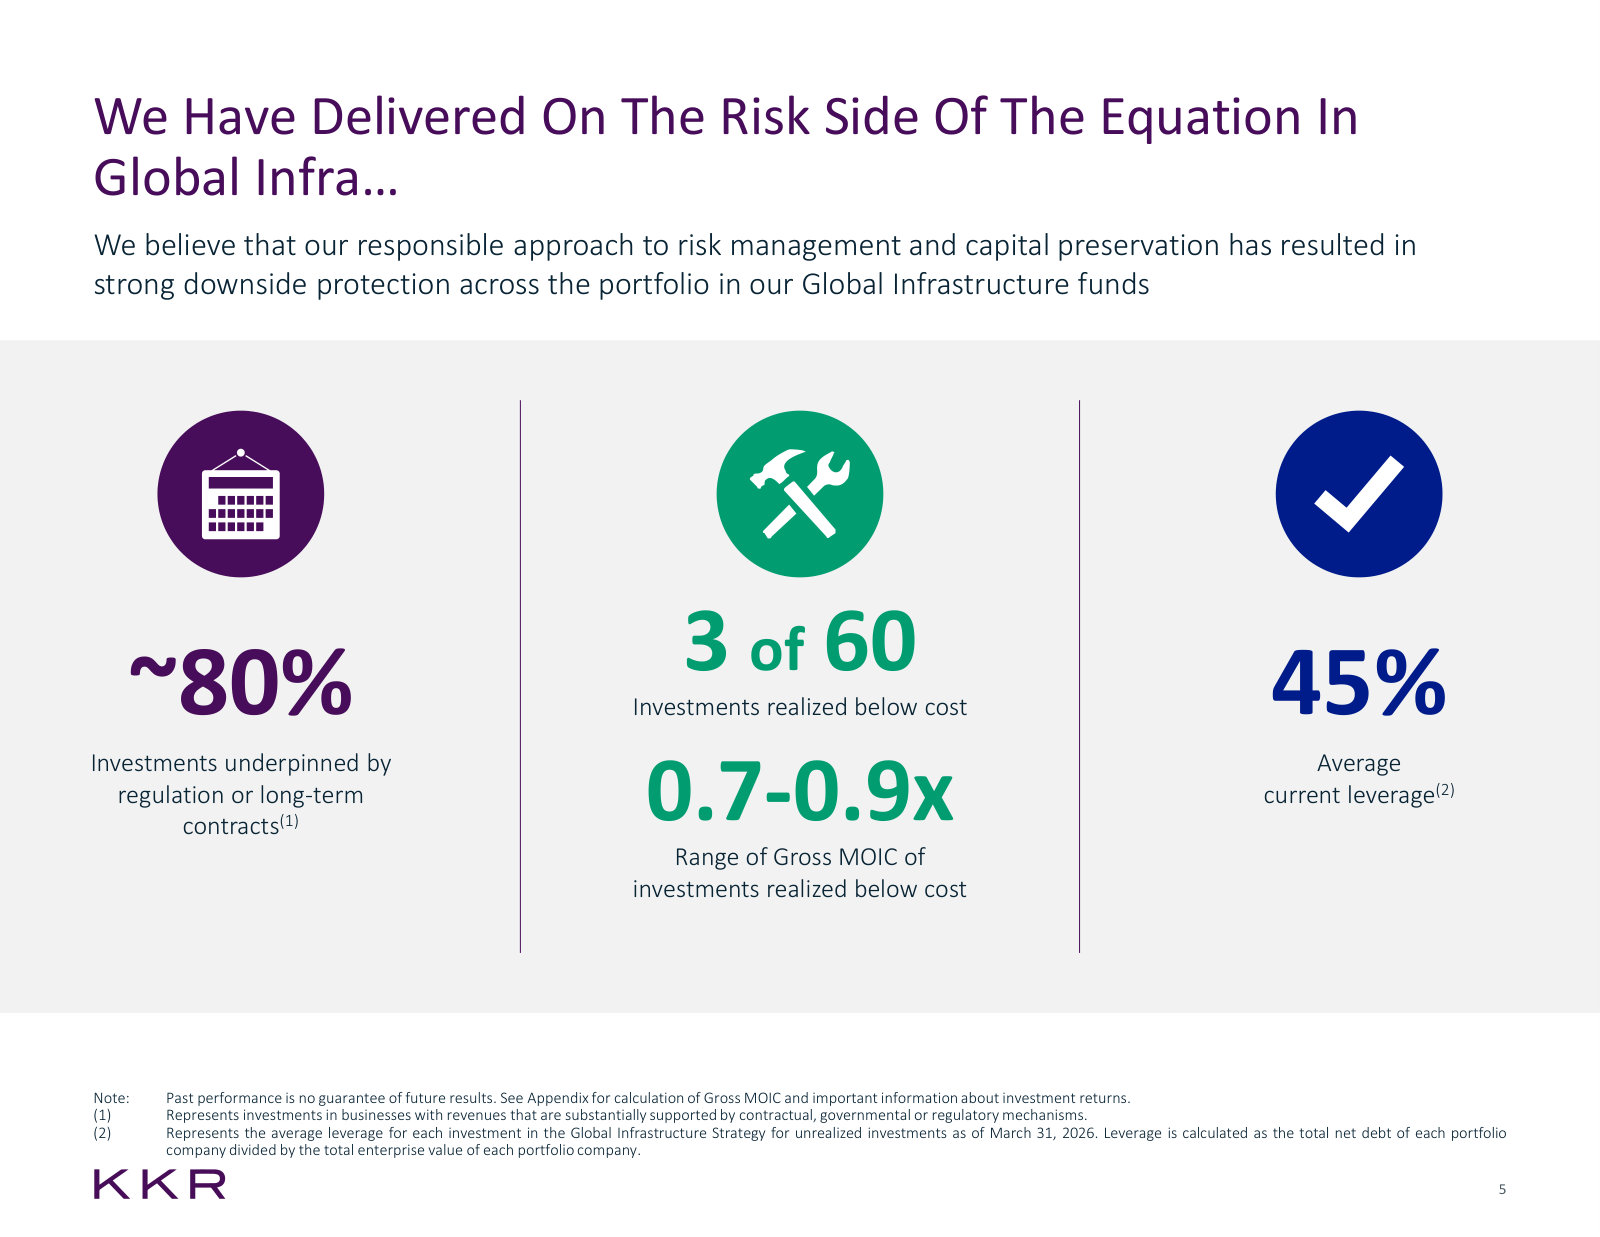
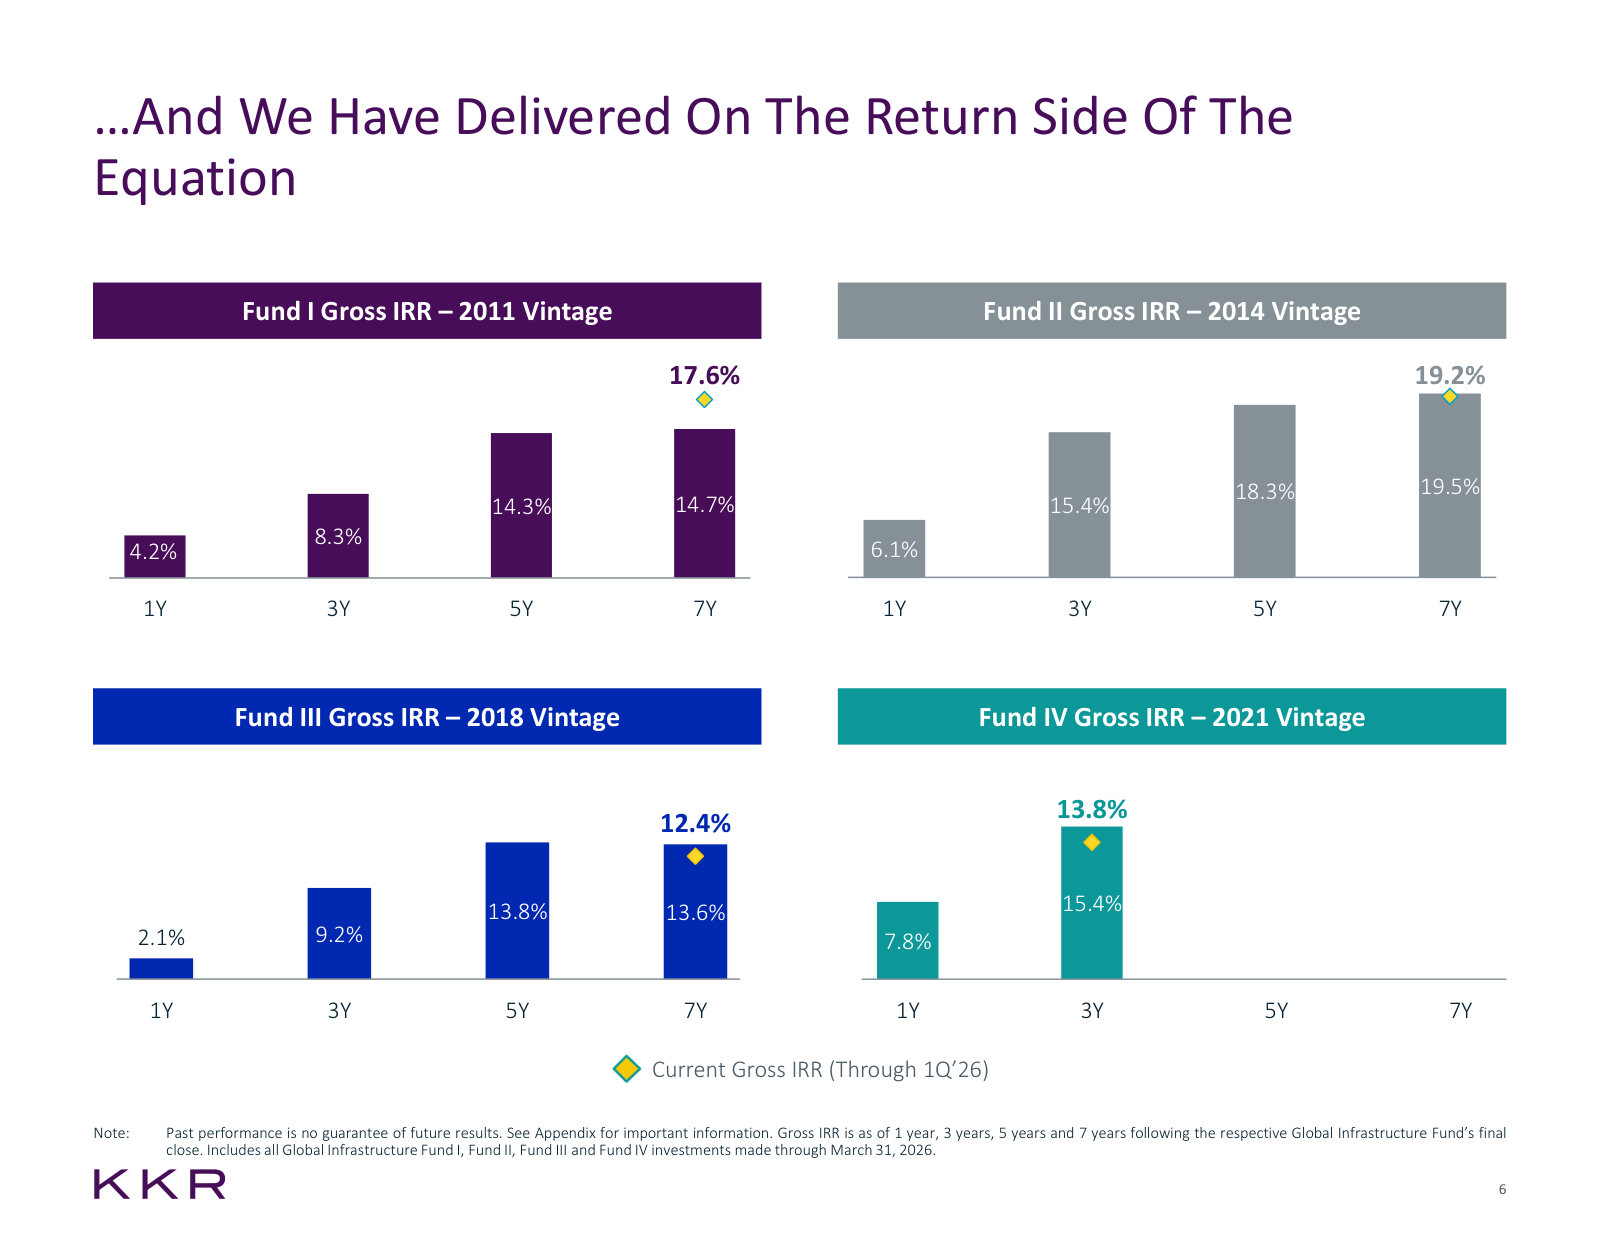
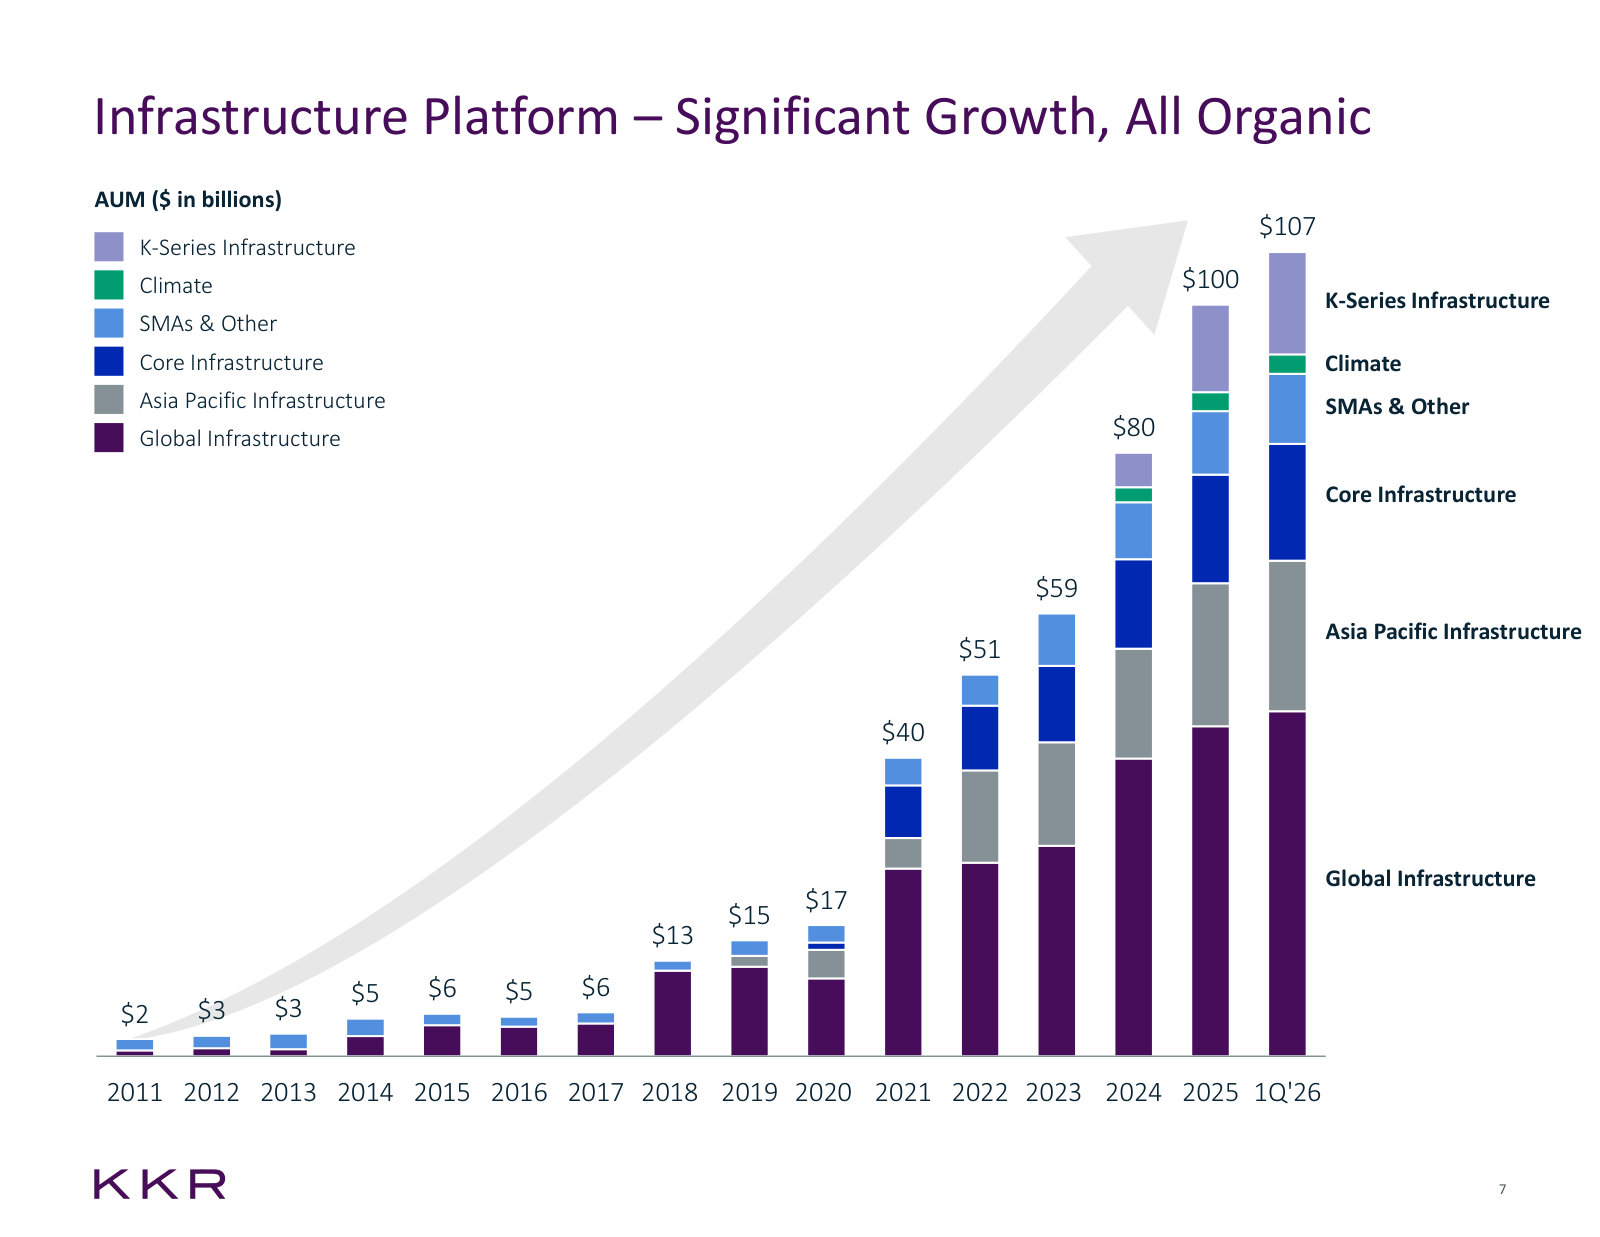
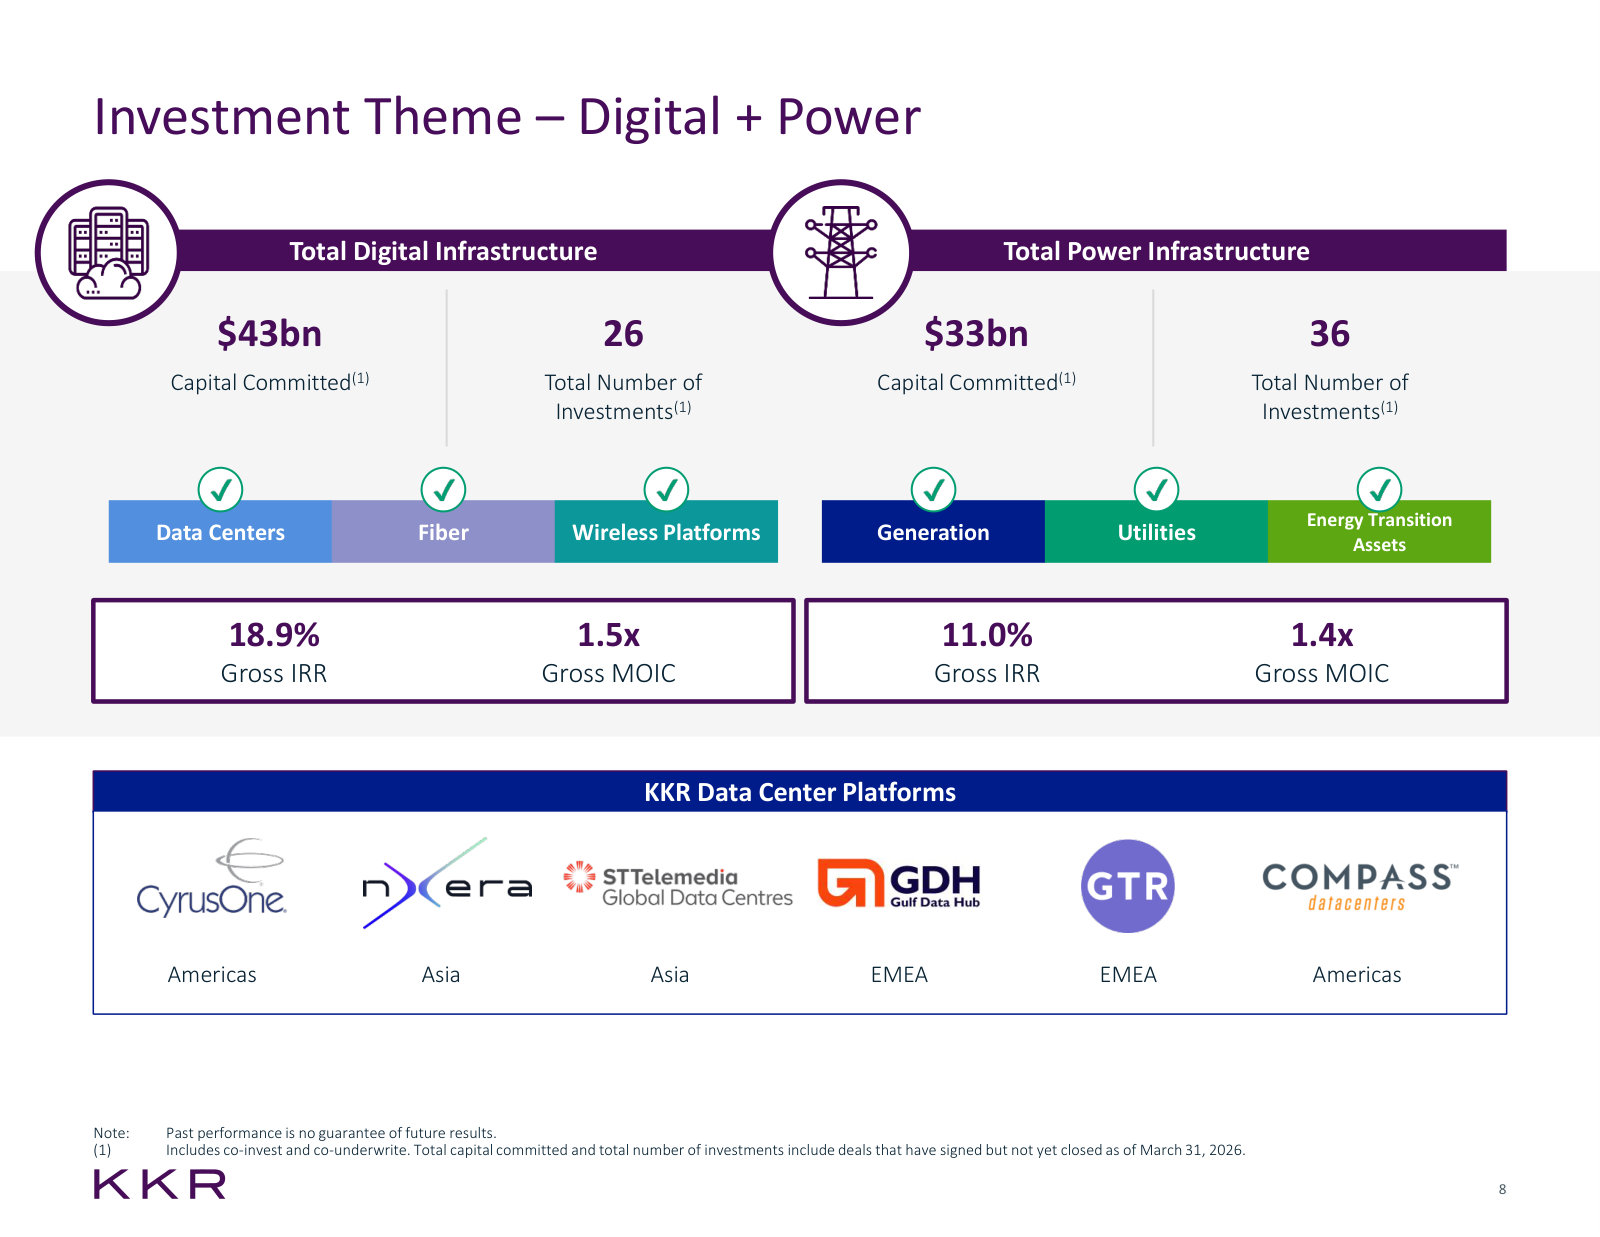
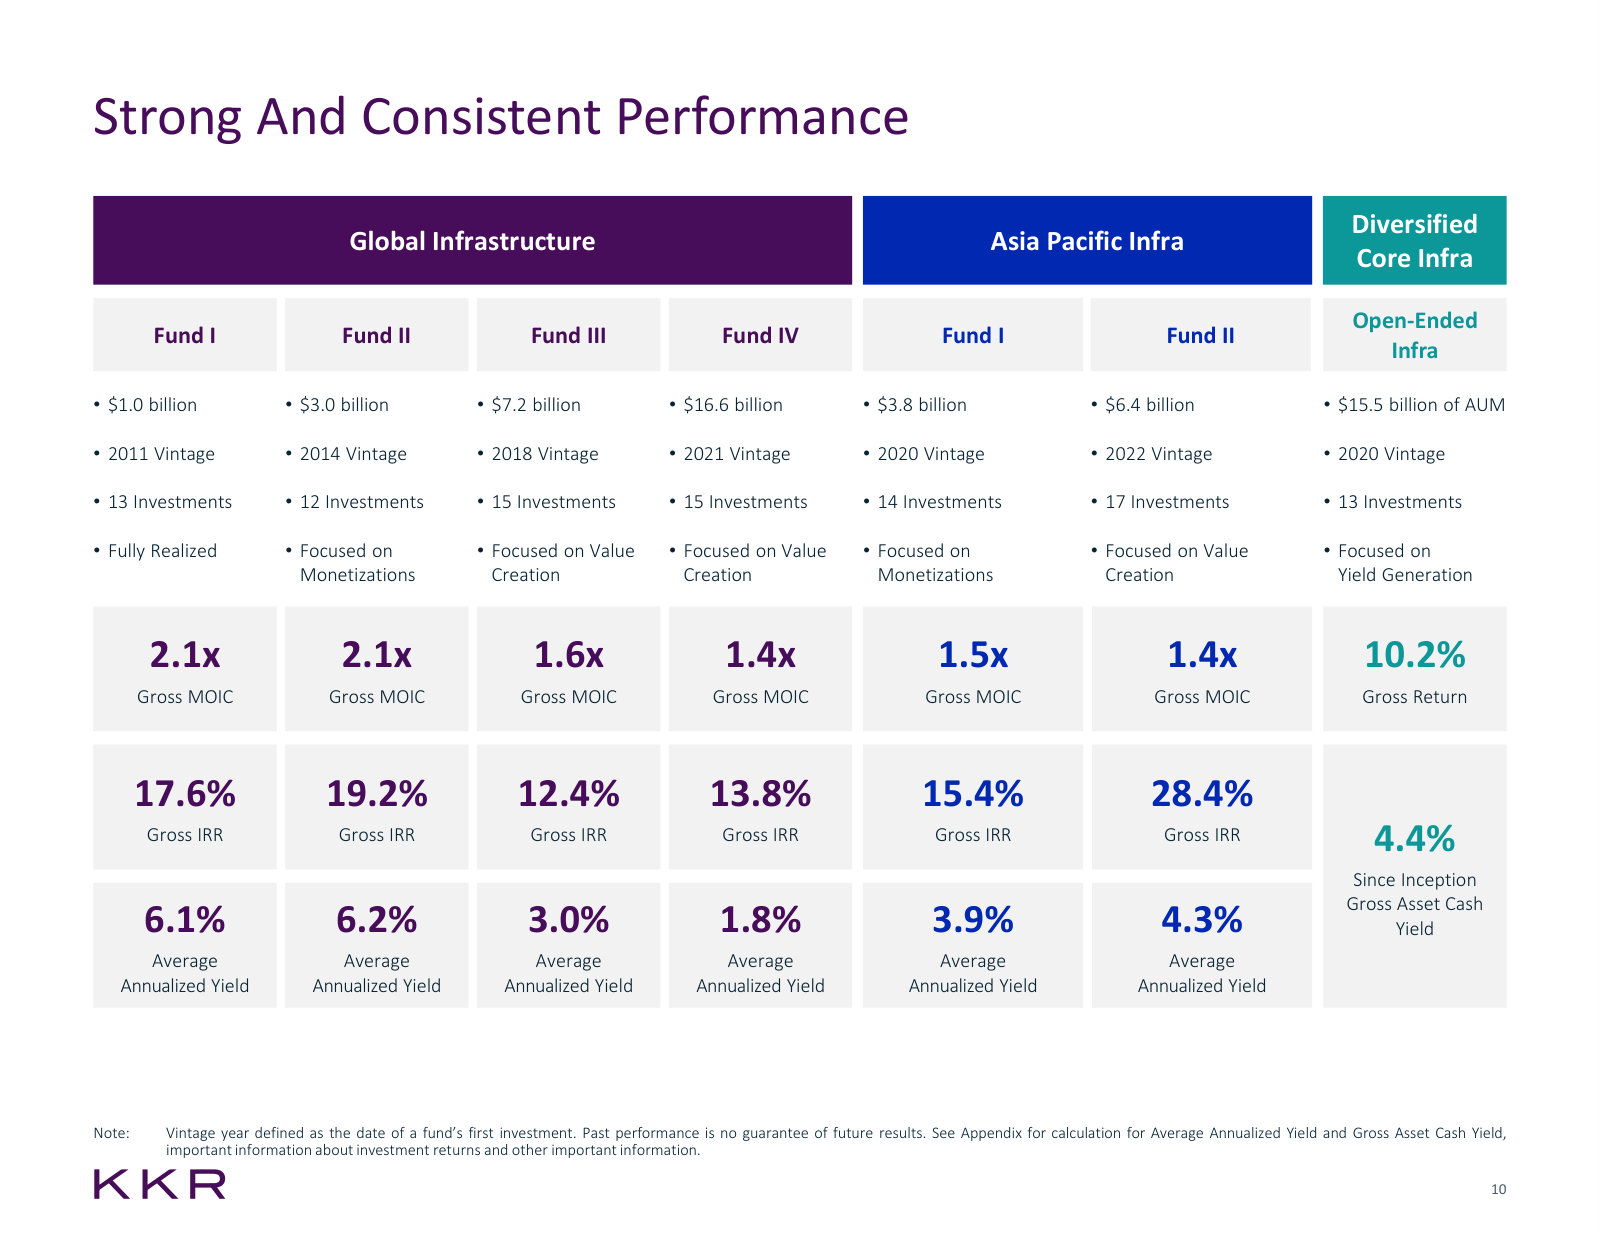
Infrastructure Overview – Morgan Stanley US Financials Conference — June 2026
A short deck from the head of Real Assets on KKR's fastest-growing real assets business: returns, scale and the current investment theme. · Open the full document →
More from management
Overview Presentation – 4Q'25 — 4Q'25 · 51 pages · The full-year 2025 numbers, and the same overview deck as it read before the Arctos acquisition. · Open →
Infrastructure Overview – Barclays Global Financial Services Conference — 2024 · 15 pages · The earlier infrastructure deck, with the CyrusOne case study and the climate strategy launch not in the 2026 version. · Open →
Overview Presentation – 1Q'24 — 1Q'24 · 50 pages · The first overview deck reported on the three-segment basis, right after the 2024 investor day. · Open →
Origination: Global Atlantic and ABF — 2024 · 17 pages · How insurance liabilities are turned into KKR-originated assets, at the point the strategy was being sold to investors. · Open →
Goldman Sachs Financial Services Conference — 2023 · 36 pages · The segment realignment explained to a conference audience — a shorter version of the November announcement. · Open →
Strategic Update — 2023 · 34 pages · The announcement that created today's structure: buying the rest of Global Atlantic and forming Strategic Holdings. · Open →
Private Credit Overview — 2023 · 19 pages · A standalone primer on direct lending and asset-based finance, from before those businesses roughly doubled. · Open →
KKR & Co. Inc.'s management answers for the business every quarter. These are the exchanges that explain it best — verbatim, from the call transcripts preserved in Sources. Each link opens the full transcript at that page in a new tab.
Q1 2026 Earnings Call — Q1 2026
The current state of the firm in management's words: capital allocation discipline, a guidance target being walked down in public, and the private-credit scare met with scale figures. · Open the full transcript →
Why the Insurance segment line understates Global Atlantic: the rest of the economics land in asset management.
Craig Larson (Partner and Head of Investor Relations): Insurance segment operating earnings were $260 million. Now as a reminder, we report the insurance investment portfolio largely based on cash outcomes. So to give you a sense of the embedded profitability as we've done in the last couple of quarters, our insurance operating earnings would have been slightly north of $300 million in Q1 if we included the impact of marks on investments where a significant portion of the return relates to appreciation rather than cash yield. And as a reminder, Insurance segment operating earnings alone do not capture the full economics of GA to KKR. Page 22 of our earnings release details the management fees under our investment management agreement, fees from IV-related vehicles, where we have over $60 billion of AUM that wouldn't exist without GA, alongside GA related capital markets fees. When you take all of that together, total insurance economics over the last twelve months were $1.9 billion. That's net of compensation, up 14% versus the prior period.
p. 1 · Read in context →
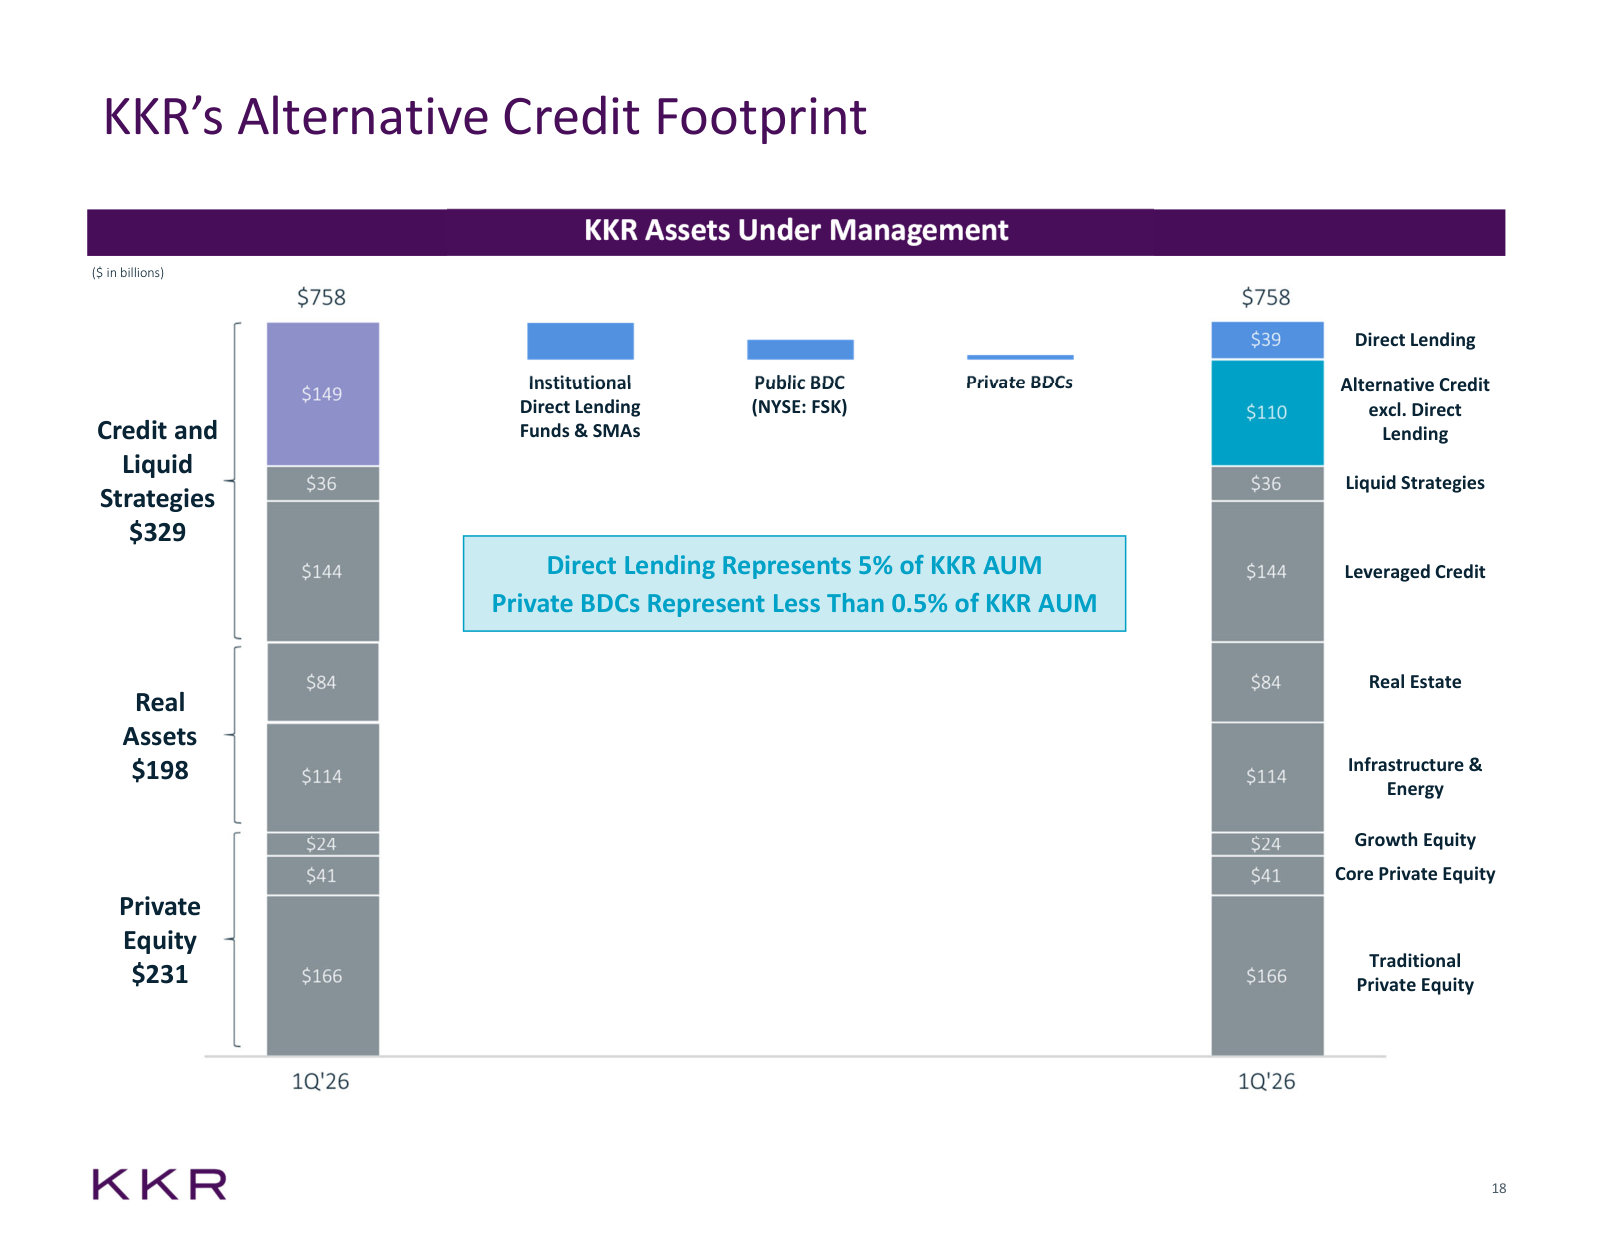
Sizes the private-credit exposure the market was worried about: direct lending is 5% of AUM, the private BDC 0.4%.
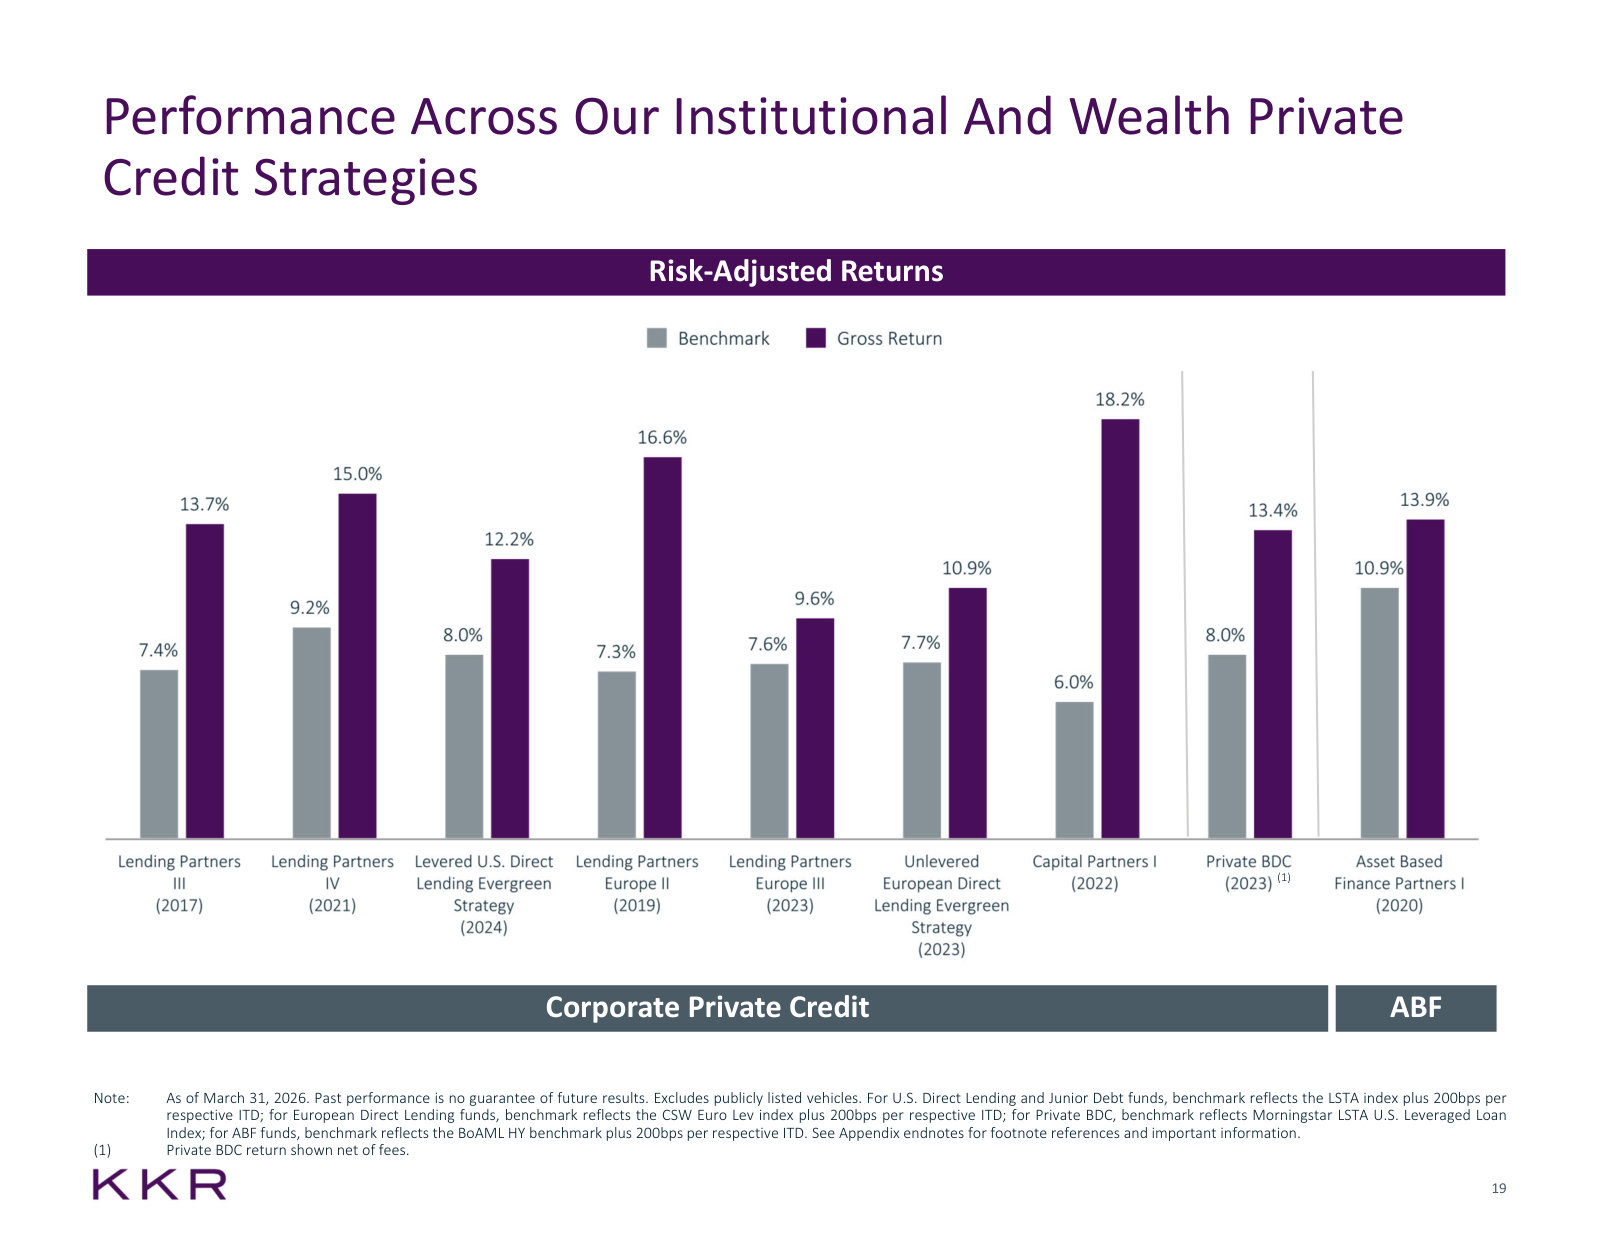
Craig Larson (Partner and Head of Investor Relations): Now as you can imagine, we've been filling a lot of questions on direct lending, so we've added a couple of pages to our earnings release. First, just to level set, if you turn to Page 20, you see the size of our direct lending platform. In total, direct lending is $39 billion or 5% of our AUM. It's an important business for us, but in the framework of KKR, it's of modest size. And with a lot of focus on redemption activity in the wealth space, we note the size of our private BDC footprint in the second bar from the right. It's even smaller, around $3 billion of AUM or 0.4% of our AUM in total. In terms of our public BDC, FSK is a little less than 2% of our AUM. FSK reports its Q1 earnings next week. We're not going to get ahead of that. It's important, though, not to conflate FSK's portfolio with other pools of capital. So looking at Page 21, you see investment performance across our institutional strategies as well as our private BDC, all vintages since 2017. You see very consistent outperformance versus benchmark. We thought the more granular framing of investment performance here across the direct lending platform would be helpful context for everyone.
p. 2 · Read in context →
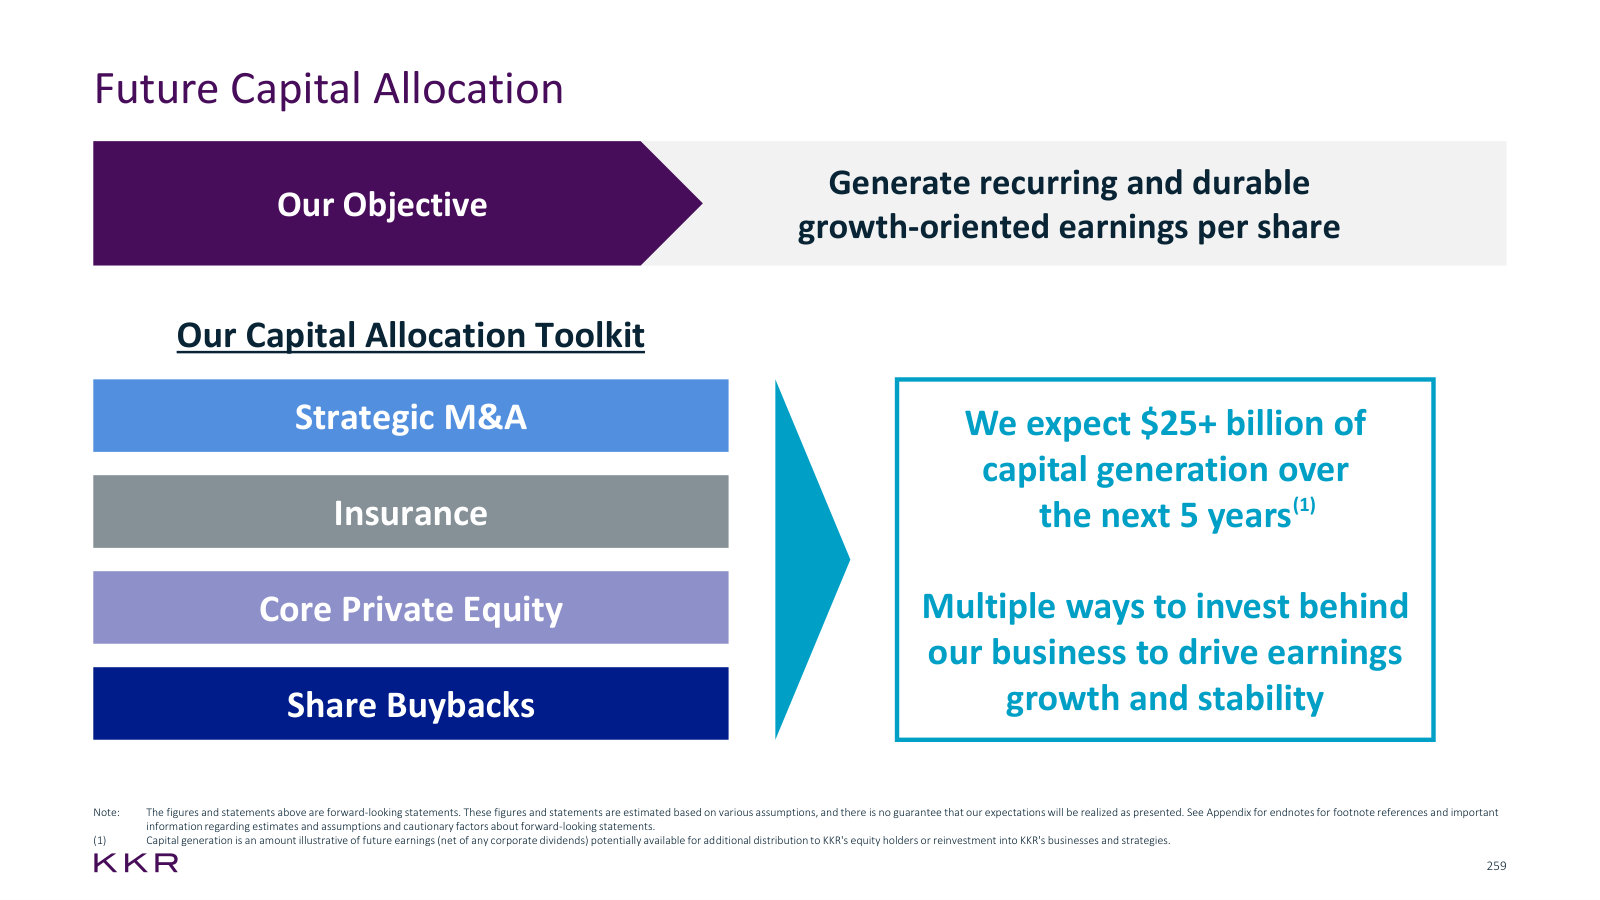
The capital allocation rule: four tools, no fixed budget for any of them, judged on recurring earnings per share.
Robert Lewin (Chief Financial Officer): I'd like to next shift to capital allocation. It is an area of critical importance to our long-term performance and we have been making some important and deliberate decisions. As a reminder, we have focused on four key tools available to us to allocate our cash flow. Strategic M&A, insurance, share buybacks and strategic holdings. Each of these tools takes full advantage of the KKR ecosystem, and as a result, have the potential for high ROEs. Importantly, we do not have a framework that assigns a specific amount of capital spend into any one of these areas. Our approach here is all about how we take our marginal dollar of cash flows and drive the most amount of recurring durable and growing earnings on a per share basis. That is the mindset we have consistently taken to capital allocation, and it is one that is highly aligned with our shareholders given employees here own roughly 30% of our stock. We believe that we have delivered a lot of value to our shareholders through strategic capital allocation, and we are very confident in our ability to continue to do so in the future.
p. 3 · Read in context →
Management walks its own $7 ANI target down mid-year and explains why delayed monetizations are deferred, not lost.
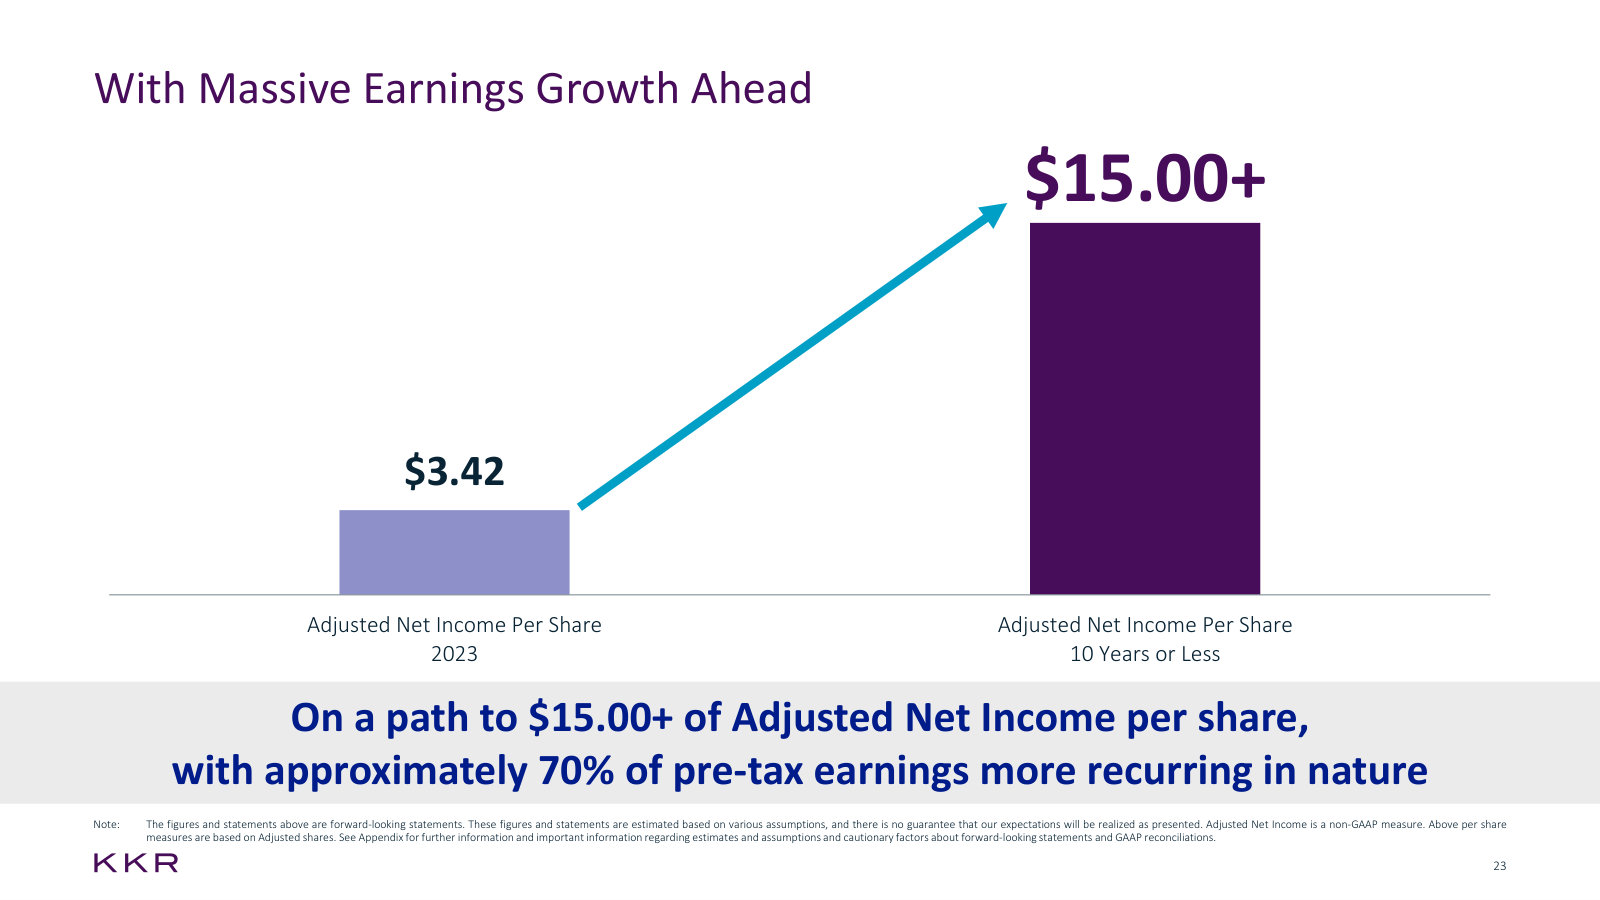
Robert Lewin (Chief Financial Officer): Finally, before I'm going to hand it over to Scott, I did want to provide an update on our 2026 guidance. First, based on the underlying momentum that we are seeing across the business, we continue to feel very confident in our ability to exceed our targets for fundraising, strategic holdings operating earnings and FRE on a per share basis. Turning to ANI. As we said last quarter, following our bottoms-up budgeting process, we entered the year expecting 2026 ANI to reach $7-plus per share, assuming a constructive and more normalized monetization environment. At that level, earnings growth would be approximately 45% year-over-year. So it's clearly an ambitious target, but one that we did have line of sight to achieving. That said, the operating environment four months into the year has, of course, been a bit more challenging than what was embedded in our plan. Importantly, we are still seeing healthy monetization activity. Gross monetization revenues in Q1 were up more than 50% year-over-year. And when we look at exit since March 31 as well as signed transactions expected to close in the coming quarters, that represents over $1.2 billion of gross monetization revenue for KKR. Notably, that is the largest forward monetization figure we've discussed on a call in our history. So while we continue to generate very strong outcomes, we do have modestly less visibility today than what our budget would have suggested at this point in the year. As a result, if you were handicapping our ability to reach $7 per share, we do think it is more likely that we land below that level. Importantly, if that were to happen, any delayed monetizations that impact 2026 would not be lost as we would expect them to shift to 2027 and beyond.
p. 4 · Read in context →
How broad-based employee ownership shows up in returns, with the CoolIT exit as the worked example.
Bart Dziarski (RBC Capital Markets); Robert Lewin (Chief Financial Officer): Congrats on the CoolIT realization. And I noticed you implemented an employee ownership program at acquisition. So could you maybe speak to how that program contributed to the successful outcome of that deal? And then maybe more broadly on KKR's ownership program at the portfolio company level? […] Bart, it's Rob. Thanks for bringing that one up. CoolIT was obviously an awesome outcome for our investors. It is not often that we exit a business at almost a 15x multiple of money. And as you noted, CoolIT is one of 85 KKR portfolio companies globally now that are part of ou broad-based employee ownership programs where every employee, so it's not just senior management, are equity owners. And in the case of CoolIT, most tenured employees there are going to receive roughly eight times their annual base salary at exit. So a really meaningful outcome. And deservingly given the progress and the returns that we were able to generate at CoolIT. So more broadly, if you look at those 85 businesses that I referenced, we now have approximately 200,000 nonmanagement equity owners in those businesses. And we're really proud of this initiative. We know for sure that it drives better outcomes at our portfolio companies. We see it in the numbers. You've got higher engagement scores. You've got higher retention rates, working capital efficiency is up, margins are up, and ultimately, profitability is up. And so we have developed this program in a way where we've got the full employee base at these companies feeling like owners in the business, and they're delivering better results.
p. 7 · Read in context →
The hardest question on the call — are LPs frustrated by exit delays? — answered with the DPI record.
Brennan Hawken (BMO Capital Markets); Scott Nuttall (Co-Chief Executive Officer): Wanted to follow up on Glenn Schorr's question. So—I couldn't resist, sorry. So look, the struggle with the $7 is, I think, probably not that surprising, like the environment, given where it is, you can look at consensus and saw the basically it was anticipated. But the one part that I'm sort of curious about is on the realizations and the timing. I know you guys have been a lot stronger on DPI. But how is the potential for further delays in monetization and realizations going across with the LP community. This has been an ongoing delay across the industry. And so is that leading to some frustrations and how are you managing that? […] Brennan, it's Scott. Just to add a couple of things, one, thanks for the question. I wouldn't confuse the message around we may delay some strategic exits with kind of what we're hearing from the LPs. We have, I think, in the deck, the IR deck on the website, a slide somewhere that talks about how we've given cash back from our private equity fund in the U.S. or that business, we've given more back than we called nine out of the last ten years. So what we're hearing from the LPs is we're best-in-class in terms of DPI and cash back, and they know that there's more coming. So the LPs are happy with us. That's why you see a record fundraise in private equity, the $23 billion that Rob mentioned, which is just the U.S. component of our private equity business. But overall, fundraising is up, and we're finding investors want to do even more with us. And I mentioned this dispersion we're seeing across our sector. There is extreme bifurcation, and we're getting a lot of very positive feedback on how we're performing and sending so much cash back relative to others. So I wouldn't confuse the two topics. This is helping us grow the firm faster by virtue of the performance.
p. 11 · Read in context →
Q4 and Full Year 2025 Earnings Call — Q4 2025
The annual strategy call: the Arctos acquisition and the M&A framework behind it, the operating-leverage math, and the accounting choices that shape reported insurance earnings. · Open the full transcript →
The five tests any KKR acquisition has to pass, applied in real time to the Arctos deal.
Robert Lewin (Chief Financial Officer): Importantly, as you think about this acquisition, it is highly consistent with the strategic M&A framework we have previously laid out for our investors and analysts. That includes five things of note. Number one, access to leadership positions in large addressable markets that would be difficult to build organically. Number two is long-dated capital. The vast majority of Arctos' $15 billion of AUM is long-duration in nature, with no fixed end date. It is really as close to permanent capital as it gets in the asset manager space. Number three, highly complementary capabilities with a differentiated origination and sourcing engine that we believe can be valuable across the full KKR & Co. Inc. ecosystem, in particular, our insurance business. Number four would be the synergy that exists around distribution across both wealth and institutional channels. Number five, most importantly, strong cultural alignment between our two firms.
p. 3 · Read in context →
Operating leverage quantified: management fees up 46% against 21% expense growth, the inverse of the three closest peers.
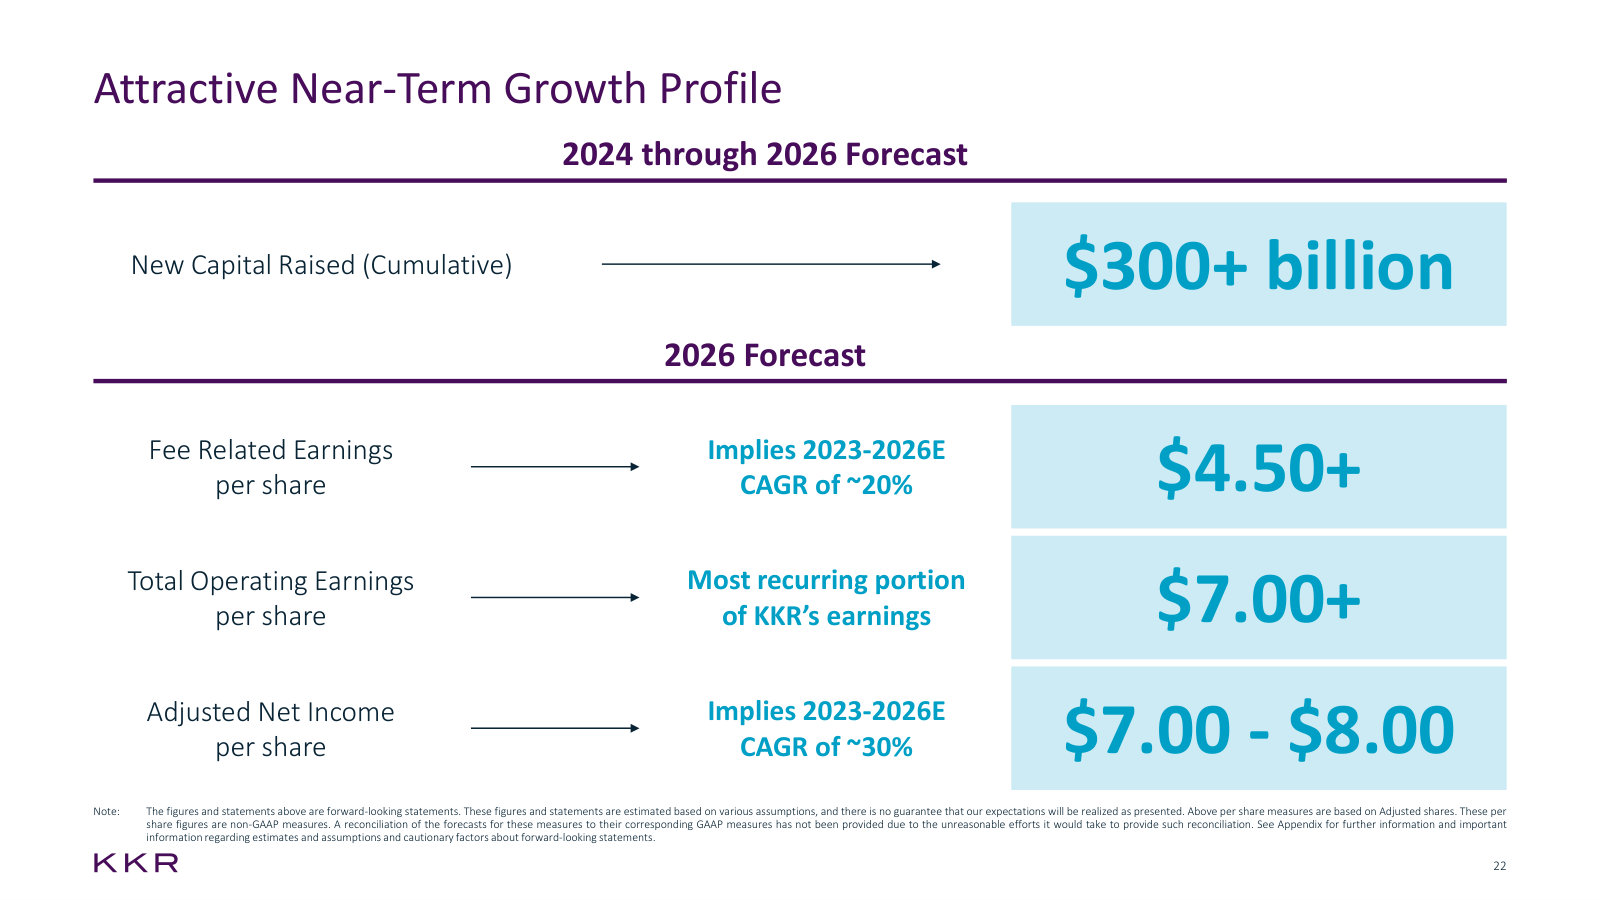
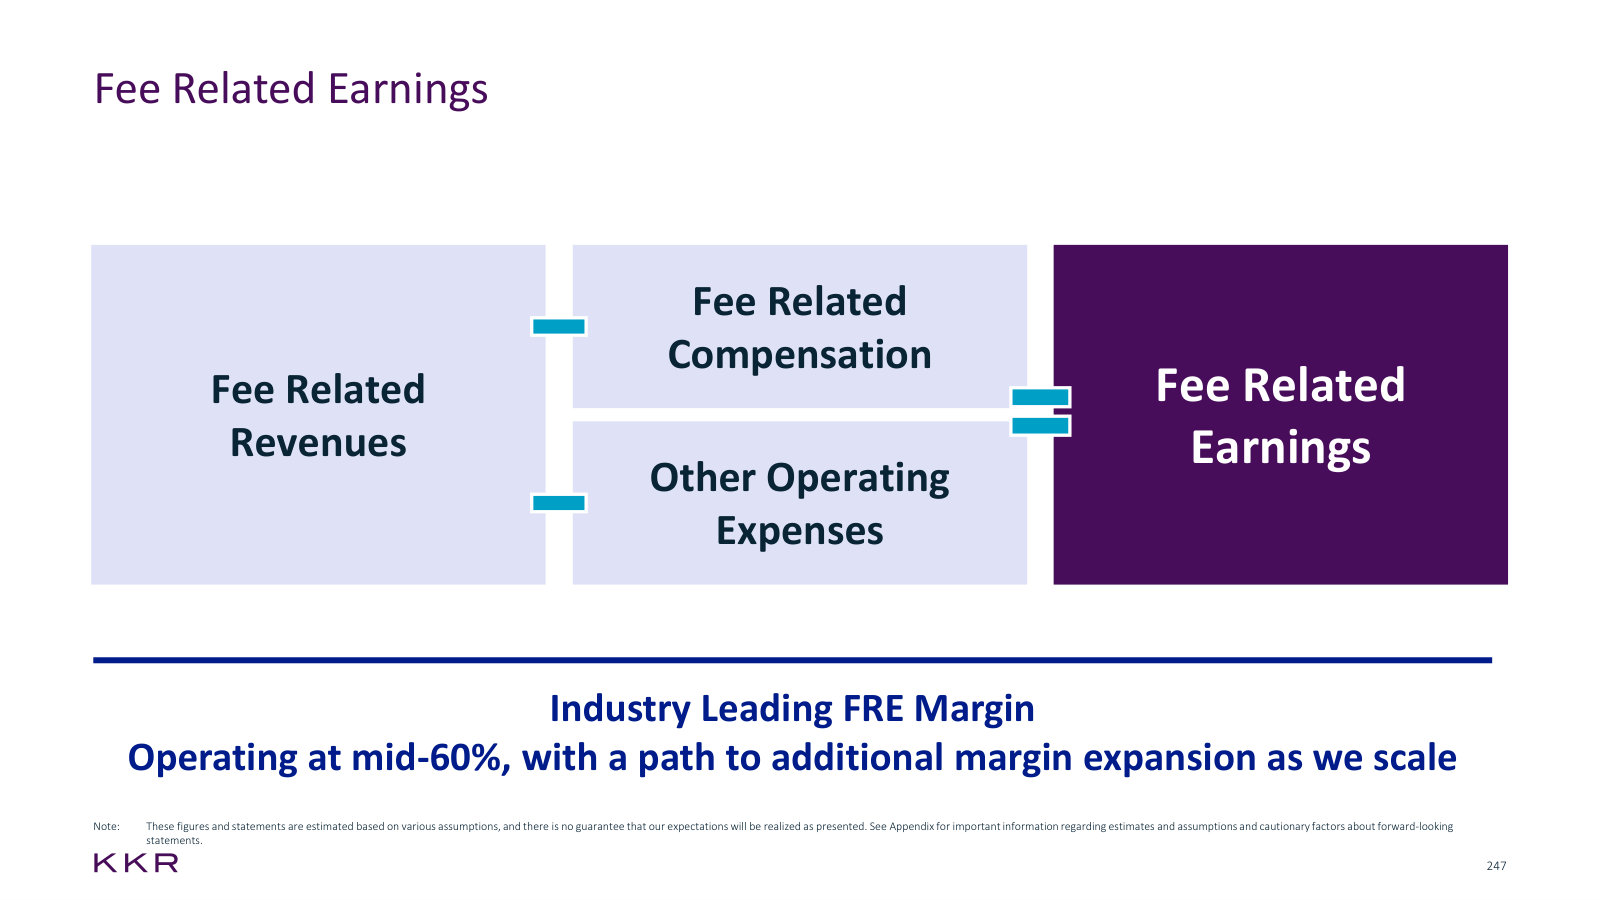
Alexander Blostein (Goldman Sachs); Robert Lewin (Chief Financial Officer): Just to follow up on Glenn's question and Scott, your answer. Obviously, lots of anxiety in the market. It obviously continues today. When you think about the more durable part of the business, Rob, I heard you talk about sort of confidence around exceeding the FRE target you set out for 2026. I think it was $4.50 plus. Can you talk maybe through the building blocks, your confidence levels in those building blocks? Specifically, with respect to management fees, what you expect that growth to look like in '26? […] I'm going to give you a stat, and we were looking at this as part of our recent budgeting process, but I think it's a helpful one. If you look from the end of 2022, so really post-COVID, through to, and I'm going to give you LTM nine-thirty numbers from a comparable perspective. We have grown our management fees by 46% relative to our operating expenses by 21%. Now compare that to our three closest peers, and it is pretty much the inverse. They've all grown their operating expense at a pace that exceeds their management fees, and in two of the three by a pretty substantial margin. […] The last point, because I think it's also helpful in the context of thinking about our ability to achieve that $4.50 plus target or meaningfully exceed it, is when we gave that target, that was a little over two years ago. At the time, our LTM FRE per share was $2.55. Because of the momentum we have across all of those line items and our ability to get operating leverage, that's why you've seen the really substantial growth we've had in FRE over a short period of time.
p. 8 · Read in context →
Why reported insurance earnings lag the economics: KKR cash-accounts assets whose return is appreciation rather than yield.
Benjamin Budish (Barclays); Robert Lewin (Chief Financial Officer): I wonder if you could talk a little bit about the recent trends at Global Atlantic. It looks like you are a little bit above the kind of $250 million per quarter target you've talked about, but sifting through the pieces, it's a little bit hard to tell. I think we're waiting for some data from the queue when it comes out, but it looks like perhaps the net investment spread may have narrowed a little bit. The G&A came in quite a bit lower than the last '26. Is it still sort of plus or minus $250 million? Or should we see more upside? Thank you. […] Yeah. I'll take that one. It's Rob. All good questions. Let me work through them in pieces. We continue to think that the right level to model the business is in that $250 million-plus range per quarter over the next four quarters, but keep in mind, and we talked a lot about this last quarter, is in our transition to move our book to more of an industry average on alternatives exposure, we are taking on assets that have no yield or limited yield. We are choosing to not have that show up in our P&L by cash accounting for those outcomes. That is different than many of our industry peers. In just Q4 alone, that number was in the mid-90s of accrued that's not showing up in our P&L. As I think about our run rate today, of accrued income is closer to $250 million. As you think about 2026, as we're modeling that business, we think that accrued income number can be $300 to $350 million. Over time, if we do our jobs right, that accrued income that builds and compounds will show up in cash earnings. We expect in 2027 and 2028, you're going to start to see that.
p. 10 · Read in context →
Answering the charge that Strategic Holdings is a black box: ~20 companies deleveraging into dividend payers.
Brennan Hawken (BMO); Robert Lewin (Chief Financial Officer): Appreciate that you reiterated the $350 million expectation for this year in Strategic Holdings. Also recognizing that the earnings doubled here this year, more than doubled. Could you help us understand what will drive that? Talking with investors, there's a little bit of a view that it's a black box. There's not a ton of disclosure. So any enhanced color around what's going to drive that substantial ramp? There's a TMT bucket that's in there. Maybe could you provide a little color around what's in that bucket given some of the anxiety and agita that's out there? Thanks. […] Now what is driving it? What's driving it is we've got approximately 20 businesses now that sit in strategic holdings, all generating different levels of growth and free cash flow. Many of those investments were originated five, six, seven, eight years ago with bigger capital structures at the time. A big part of our thesis is as they delever, which they are deleveraging, they're going to be generating more free cash flow for dividends, and that is what's driving our confidence both in 2026 but especially as we look forward through 2030 and beyond.
p. 11 · Read in context →
Q3 2025 Earnings Call — Q3 2025
The call where the insurance P&L was taken apart in public — total economics, the cash-versus-mark decision, and a self-disclosed carry clawback. · Open the full transcript →
Management explains why it declined to adopt peers' mark-to-market insurance reporting, and what that choice costs the headline.
Robert Lewin (CFO): Transparently, we debated whether to change our insurance operating reporting to mark-to-market and conform to many of the industry peers, but we have concluded that it would be inconsistent with how we think about the P&L across all of KKR. We have had a focus on cash outcomes in our segment reporting since 2018 when we moved away from reporting economic net income. We think it is the easiest way to understand our business and believe that is the right decision for our insurance portfolio as well. Candidly, we like our conservative approach. We have decided to continue reporting the lower-yielding investments in our insurance segment based on cash outcomes. But to give you a sense of the embedded profitability, our insurance operating earnings would have been approximately $50 million higher in Q3 if we included the impact of marks on our investments, where a significant portion of the return is related to appreciation and not cash yield. As we continue to rotate the book, we expect the difference between our reported earnings and the earnings on a marked basis to go up in 2026, but come down over time as the portfolio matures. However, in a growing and performing business, that number will never be zero.
p. 3 · Read in context →
Bad news delivered unprompted: a carry repayment on the 2013-vintage Asia II fund, sized and reserved before anyone asked.
Robert Lewin (CFO): The one exception here relates to our second Asia private equity fund, which has underperformed. Asia II was raised 12, 13 years ago and stopped investing roughly eight years ago. As we have disclosed to our Asia II investors, we expect that fund will roughly return its cost. To be clear, our performance in Asia private equity more broadly has been a real bright spot. Our most recent funds Asia III and Asia IV are both top quartile performing funds for their vintage, with gross IRRs over 20% and differentiated DPI statistics. Asia III has already returned over 100% of its capital, and Asia IV has already returned 40%. The reason we are discussing this today is that we collected roughly $350 million of gross carry from Asia II many years ago that we now have to pay back. We will be taking a charge in the fourth quarter to do just that, reversing the compensation that was paid out when that carry was collected. To be clear, while we are recognizing this event in Q4, our accrued unrealized performance income on the balance sheet has been net of this impact for some time. The result is that we expect net realized performance income in Q4 to be lower than it otherwise would have been, and ANI per share to be about $0.18 lower. This is really a one-time charge that we've planned and reserved for that we wanted you to be aware is coming. As we sit here today, we do not see any other material clawback risk that exists across our portfolio. When you cut through it, the monetization pipeline is strong, our performance is strong, and we are taking a one-time charge for something that happened roughly 10 years ago.
p. 4 · Read in context →
The frame invoked on every call since: FRE guidance is unconditional, ANI guidance depends on the monetization window.
Robert Lewin (CFO): The final topic that I want to discuss this morning relates to our expectations for 2026. Do we still feel good about our guidance of $4.50 plus in FRE per share and $7 to $8 in after-tax ANI per share that we introduced in November 2023 and November 2021, respectively? On FRE, the answer is an unreserved yes. As you could tell from our fundraising this quarter, we have good momentum here and real line of sight to continued management fee growth. Turning to ANI. Given everything that we see and all of the momentum across KKR, we continue to feel confident in our ability to achieve our 2026 ANI guidance. A key component here will, of course, be monetization activity. Today, we have roughly $17 billion of embedded gains across the firm, that is gross unrealized carry and unrealized gains in our asset management investment portfolio and strategic holdings. That is the second highest level in our history, it's up 10% from a year ago and up over 50% from two years ago. Collectively, we've gone back with all of our business heads across all of our geographies and looked at our pipelines on a bottoms-up basis. As a result of that exercise, we feel incredibly well positioned for future monetizations. To be clear, the monetization environment today is constructive, and we would expect that to continue into 2026. However, if the monetization environment deteriorates, we may delay some of that activity. If that were to happen, we would be earning less in 2026, but would be in service of more earnings in 2027 and beyond.
p. 4 · Read in context →
Q1 2025 Earnings Call — Q1 2025
The call held four weeks into the tariff shock, where the diversification and lockup arguments were tested against a live dislocation. · Open the full transcript →
Tariff exposure quantified within a month of the announcement, by asset class and with the caveats stated.
Robert Lewin (Chief Financial Officer): The first is the impact of tariffs on our existing portfolio. As a starting point, it is important to remember that tariffs and supply chain diversification and resilience have been front-of-mind topic for our investment, public affairs, and macro teams dating back to the global pandemic. As a result, for five-plus years now, this has been a standard topic of conversation. Taking a look at our global private equity portfolio today, this includes traditional, core, and growth. Based on our initial findings, we estimate that 90% of our AUM has limited to no first-order impact from the announced tariffs. Importantly, this figure does not include identified mitigating measures that we are actively implementing. Specifically, our core private equity portfolio and our strategic holding segment are not expected to have any material impact from tariffs. Across our infrastructure platform, the vast majority of our companies have either contractual protections that insulate KKR returns or minimal estimated exposure. Looking at our infrastructure deployment over the last five years, approximately 70% has been in Europe and in Asia. And as we look at our credit portfolio, there will be pockets of exposure. But we believe the opportunities, and we really do think this is a credit picker's market, will outweigh the downsides. While we expect there will be individual instances of direct tariff impact in parts of the portfolio, based on how we understand tariffs today, we feel well-equipped to manage these challenges and on the whole feel very good with how our portfolio is positioned.
p. 2 · Read in context →
The Global Atlantic model in one passage: longer liabilities, more alternatives, third-party sidecars, all-in ROE near 20%.
Robert Lewin (Chief Financial Officer): Turning next to insurance, we are now a year plus into owning 100% of Global Atlantic and we are progressing well on our path to modestly evolving how we source both liabilities and assets, including raising more third-party capital, elongating our liability profile and sourcing additional alternatives. This addition of longer dated alternatives to the portfolio, where we think that we have a differentiated sourcing advantage, will drive up overall returns, while at the same time naturally reducing leverage over time. Financial performance here begins with Insurance segment operating earnings. In Q1, as you would have heard from Craig, we reported $259 million, which was in line with our expectations. Consistent with our comments last quarter, I would expect insurance operating earnings to stay in that $250 million plus or minus level during the next few quarters. This line item alone does not capture though how our model works and the overall impact of our insurance related economics. A lot of it appropriately shows up in our Asset Management segment. Firstly, management fees from our Ivy sidecar vehicles as well as strategic partnerships. This capital allows us to grow GA in a very capital efficient way, and there is more to come here. For example, Japan Post Insurance announced in Q1 their intention to expand our existing strategic partnership and make a new $1 billion to $2 billion investment here. Number two, capital markets fees, where we've just begun to scratch the surface. We see the potential to generate several hundred million of additional annual revenues over time. In 2024, that number was closer to $50 million. Finally, the management fees charged for our investment management agreement with Global Atlantic, critically even while we are in the process of shifting our strategy to emphasize longer duration and more private market assets. Our all-in pre-tax ROE of our insurance business is approaching 20%, with a clear path to 20- plus percent returns as we get all the elements of the business working well together.
p. 2 · Read in context →
Why management fees are insulated from marks: committed capital, eight-year-plus lockups, and $64bn not yet paying fees.
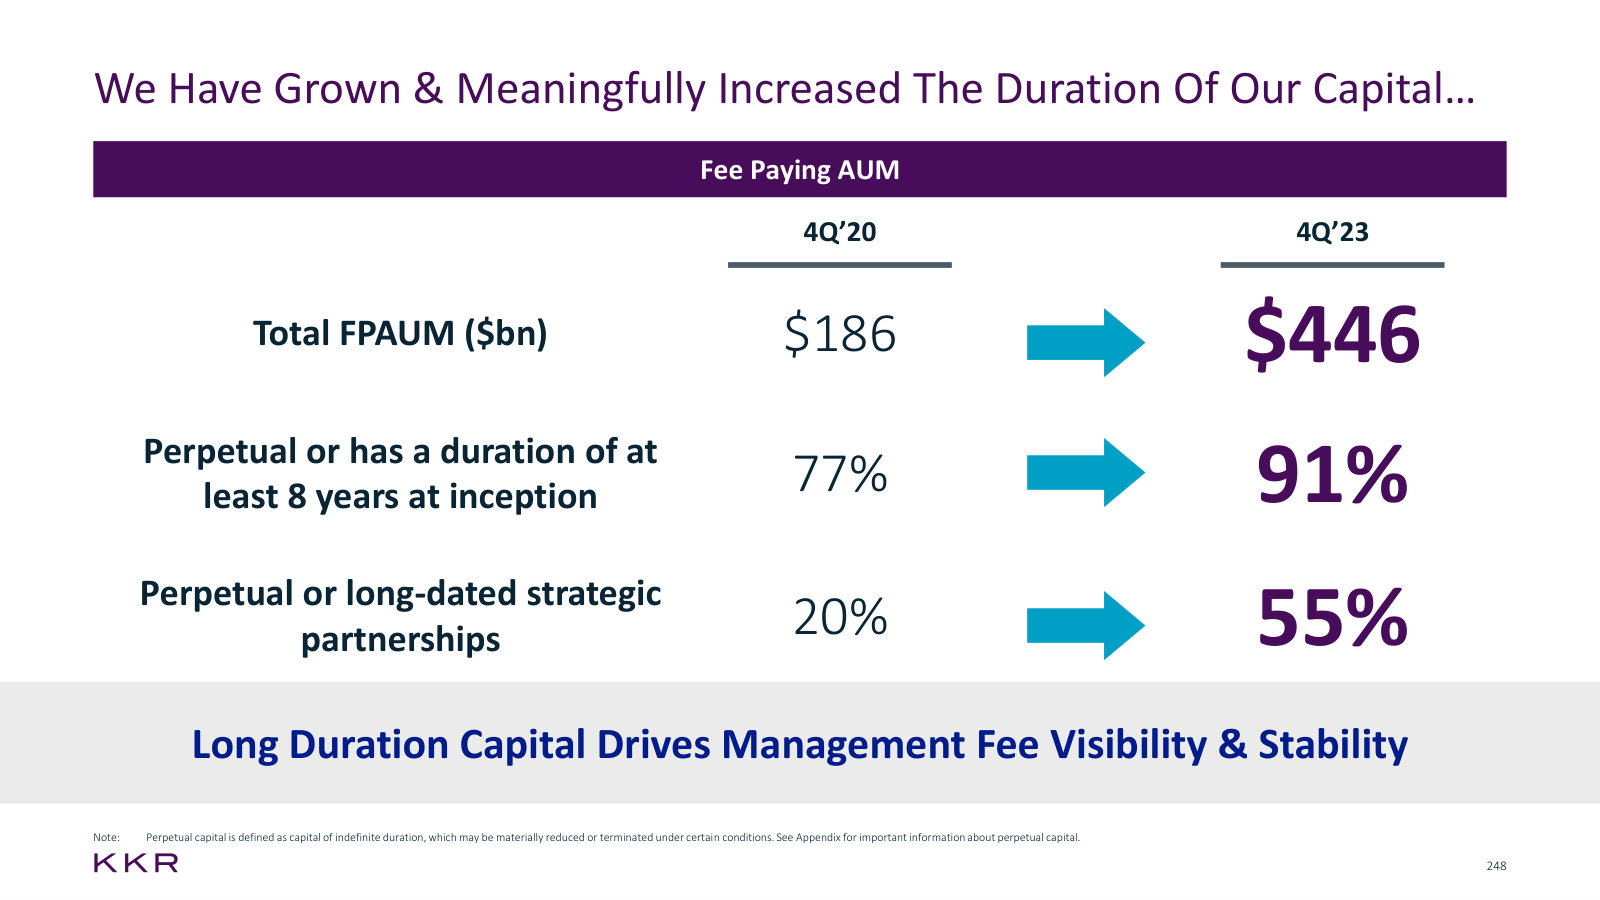
Robert Lewin (Chief Financial Officer): The last theme that I want to go through before handing it off to Scott is around the durability of our model, which provides us with a significant amount of both stability and visibility. Over 90% of our capital is perpetual or committed for an average of eight years or more. Today, we have $116 billion of committed but uncalled capital. If you look at our management fees, they are largely calculated on committed or invested capital, and therefore, not influenced by marks and corresponding NAVs. Finally, we have a record amount of capital on which we're not yet earning fees, with $64 billion committed with a weighted average management fee rate of about 100 basis points. That turns on when the capital is either invested or enters its investment period. Just to put that $64 billion figure into perspective, it is up almost 50% compared to one year ago. So, we benefit from real stability of management fees and increased visibility on how they will grow.
p. 2 · Read in context →
Pressed on why the buyback isn't bigger, the CFO restates the allocation test and the historical record behind it.
Alexander Blostein (Goldman Sachs); Robert Lewin (Chief Financial Officer): So, zooming out a little bit, the comments over the course of your prepared remarks suggested a much more resilient business, perhaps what's perceived in the market today. You talked about monetization not quite falling off the cliff, deployment, dry powder, really healthy. It sounds like you're not really changing the outlook for fundraising either. So, the question obviously is, with the stock doing what it's done over the last few months, why not step up the buyback here? I know it's a dynamic approach you guys have talked about in the past, and you're looking to generate the best return on investment capital. But if not now, when? […] Great, Alex. It's Rob. Why don't I start? We’ve been very consistent as it relates to capital allocation for some time. The most important thing for any capital allocation process is consistency. We have two goals. One is to ensure every marginal dollar of free cash flow generates the most amount of long-term earnings per share. The second goal, closely related, is increasing the quality of those earnings. Every marginal dollar of free cash flow is looked at through that lens. We've talked about four areas of using our capital base to accomplish those goals. One is share buybacks. The other three are core private equity, strategic M&A, and insurance. Share buybacks, over the past several years, have been a really important part of our capital allocation framework and use of capital. I've got every confidence that as we look forward and think about using our capital, share buybacks will continue to be a core part of how we think about capital allocation. We don't have a framework that puts a specific amount in any one bucket. To us, it’s all about taking that marginal dollar of cash flow and deriving the most amount of earnings per share across our business over a long period, with durability and resilience to that cash flow. We're going to take that same lens. I expect share buybacks, as we look forward, will continue to be a very important part of that allocation framework. It’s also worth noting that KKR senior management own roughly 30% of KKR. Any decision taken around capital structure, around capital allocation, is through that lens, highly aligned with our shareholder base. If you look historically, we’ve used our capital base to retire roughly 10% of our shares outstanding, 15% of our free float. We've done so at an average price of roughly $28 per share. We like our historical body of work and would expect to continue to find accretive ways to put that capital to work for all of our shareholders.
p. 6 · Read in context →
The industry question of the cycle — will allocations to private equity shrink? — answered: dispersion, not a shakeout.
Glenn Schorr (Evercore); Scott Nuttall (Co-Chief Executive Officer): I want to revisit the discussion on private equity. You clearly illustrated how linear deployment and investment pacing benefit your situation, particularly when considering America's 12 and the capital you've returned. The broader question is whether, during the 2006, 2007, and 2008 vintages, which had subpar industry performance, people believed private equity was finished. We raised a significant amount of money, which doubled and tripled. So, is this time different for the industry? There are more funds and assets raised, yet performance remains subpar. Will we witness a larger shakeout, considering that there wasn't enough of one in previous downturns? […] Hey, Glenn, it's Scott. It's a great question. Our expectation is that it'll probably be more about dispersion. We think you're going to have meaningful dispersion of results across private equity managers, and that will start to come through in a way that it hasn't for a very long time. We've seen a trend for a while of institutional investors in particular globally wanting to do more with fewer. They've been consolidating their relationships with people that they think can perform through a cycle and that, in a lot of cases, are global and multi-asset class. Obviously, we've benefited from that. It will be more about concentration of capital with fewer players. We think we’ll now see the benefit of what I mentioned before, we’ve learned a lot during GFC, during COVID, during Trump 1.0. We've been applying those learnings. Volatility creates opportunity. You need to have the capital to invest and the courage to invest it. We as a firm, and we talk about culture all the time, are incredibly well-connected. If nothing else, we learn, and so, hopefully that will benefit us as it comes through results. It’s going to be dispersion, not a shakeout.
p. 8 · Read in context →
The wealth thesis in plain terms, including who K-Series is for and who the Capital Group partnership is for.
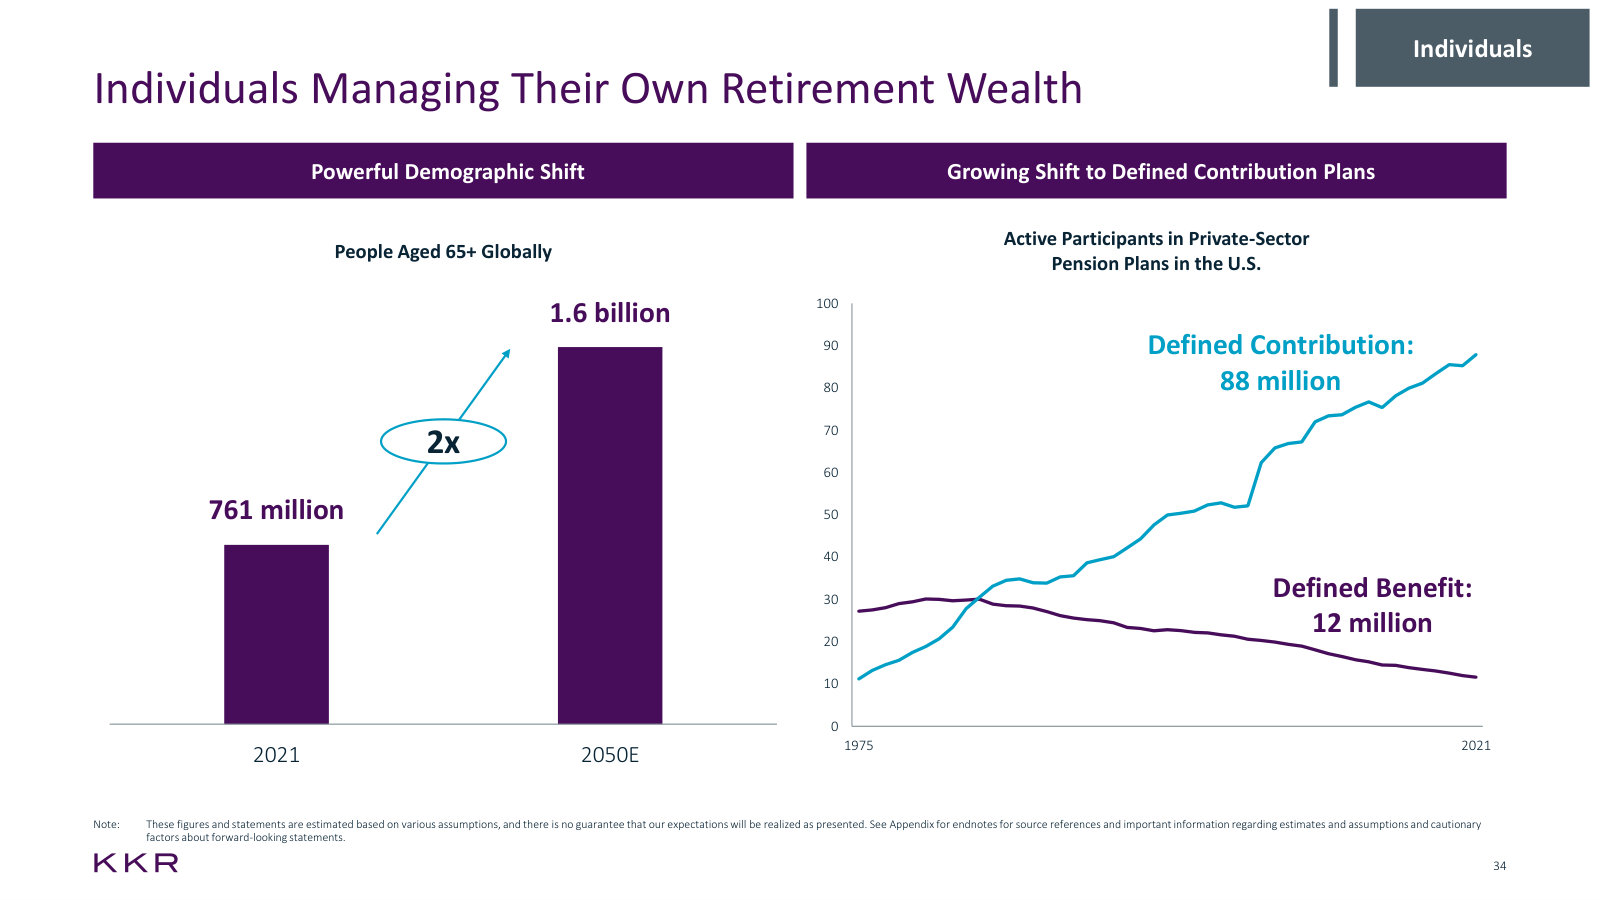
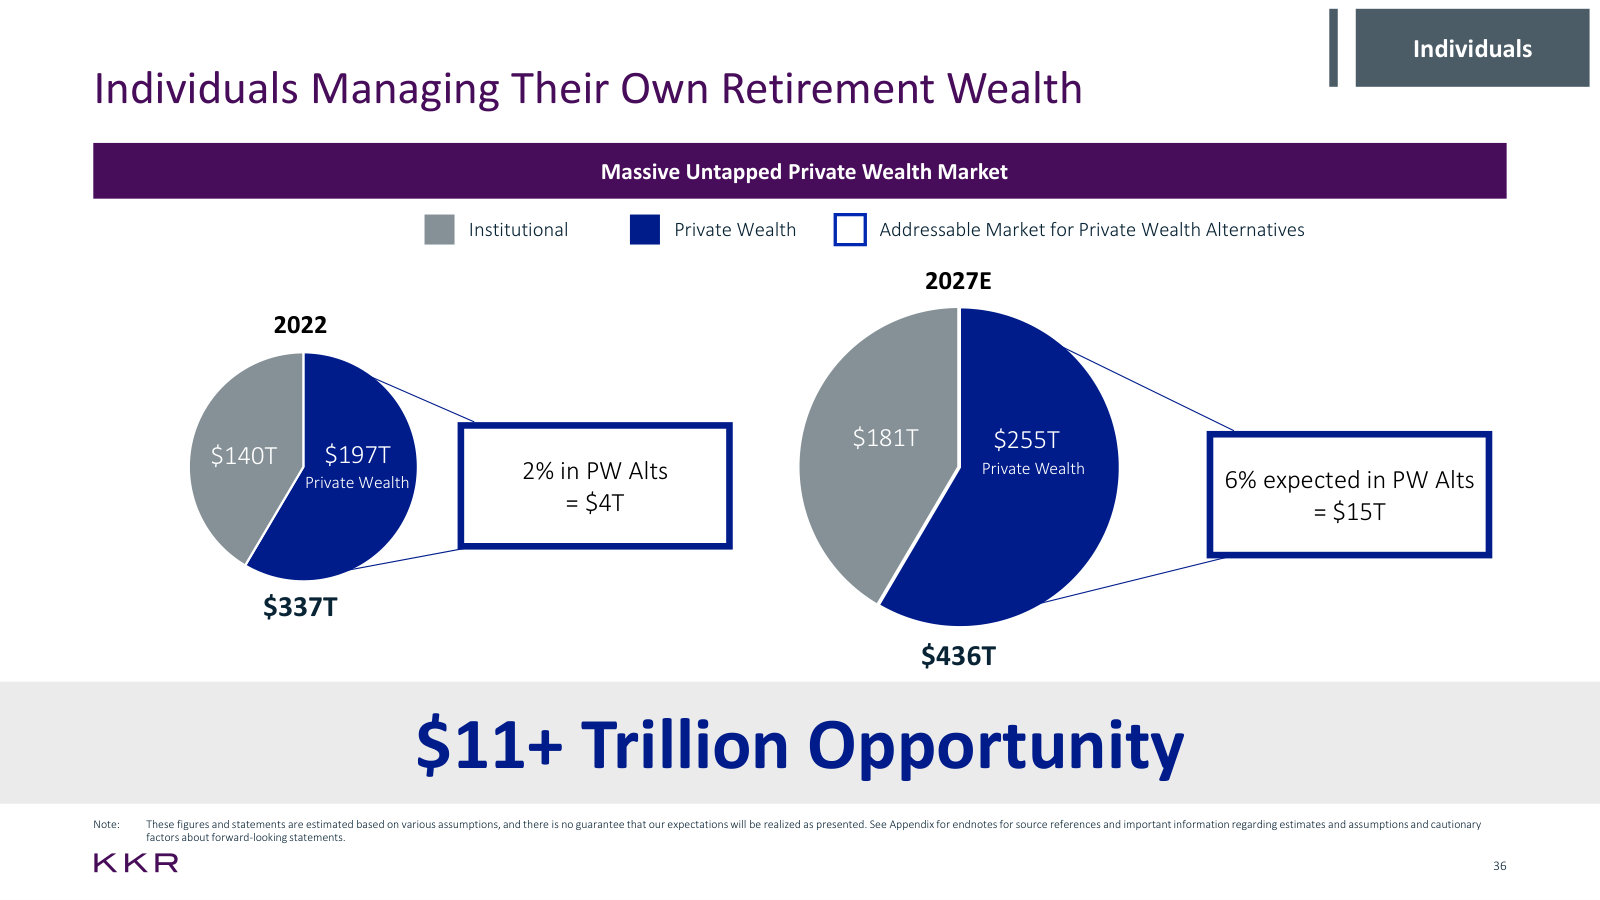
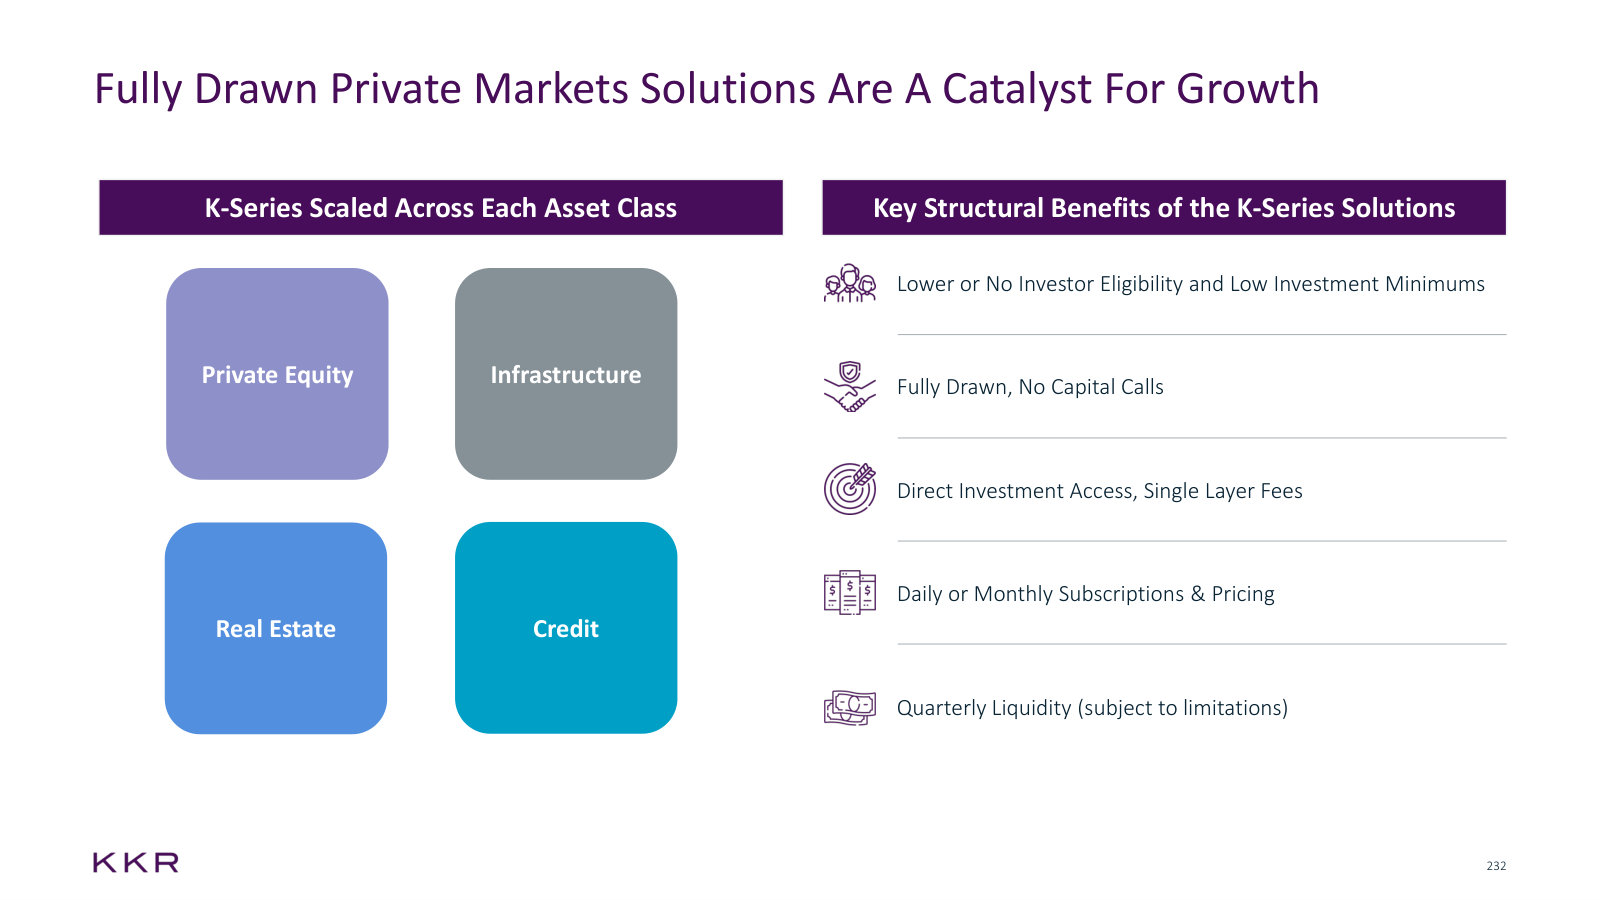
Scott Nuttall (Co-Chief Executive Officer): We talked about the private wealth opportunity for a while. We do think that it is significant. A lot of institutions globally are 30% to 50% in alternatives; individual investors are low single-digits, depending on when you look at 1% or 2%. The opportunity for expanding our market is meaningful. More importantly, it doesn't make sense that if you are a teacher in Texas and you retired, you have 30-40% of your retirement funds invested in alternatives. If you are a retired dentist, you have zero. You haven't had access to what we do. With K-Series, we've been focused on hitting the accredited investor. That’s about 5% to 7% of U.S. households. We’ve launched there, and we are underway. With Capital Group, we are focused on the other 95%. We've just launched these first two products in the credit space, but what's coming is private equity, real estate, infrastructure, models, and figuring out how to access more efficiently the broader investor universe, as well as target fees.
p. 9 · Read in context →
Why insurance segment earnings sit flat while the model improves — and the stated willingness to trade near-term P&L.
Patrick Davitt (Autonomous Research); Robert Lewin (Chief Financial Officer): My question is on the insurance discussion. I think you said you expect it to stay in the 250 million range for the next few quarters, but with the ongoing portfolio repositioning, I would think there is potential for wider new investment spreads. Why is there not room for that to tick up through the year? Thanks. […] Yes, thanks a lot for the question, Patrick. There are a few different things going on. So, let me start with how we look at things, and then I'll work towards your specific question. We focus on that all-in ROE concept. Today, we are approaching that 20% level, so pretty attractive in its own right. We have a clear path to sustainably beating that level to generate 20 plus percent all-in ROEs, especially as we get all elements of the business model working together. I’d point out that we're achieving that return while we’re going through this evolution of our business model at GA, which we know will put some near-term pressure on insurance segment operating earnings for a bit of time, but with the benefit of the longer term economic profile we think we can achieve. We believe that's unquestionably the right path to take. We're always going to side for long-term economics, even at the expense of short-term P&L. […] This all starts with elongating our liabilities. In Q1, 90% of the annuities we sold had a duration of five-plus years. This time last year, that number was 65%. We’re talking about taking our exposure to alternatives up. Industry average tends to be 5%-8% alternatives exposure. Global Atlantic was 1%. In the quarter, we added roughly a billion dollars of alternatives exposure, so making progress there too. Third-party capital is a very significant part of our strategy going forward. I referenced the momentum we have there, the Japan post-strategic partnership. We're currently out-raising IB3 deal. We have a lot going on as it relates to third-party capital. Good progress across these initiatives, but to answer your question specifically, it will take a little bit of time to impact the P&L, especially the part around the alternatives book, as much of that doesn't come through in yield. Additionally, as we grow our third-party capital, those fees only turn on when the capital is invested. Again, this takes time.
p. 11 · Read in context →
Q4 and Full Year 2023 Earnings Call — Q4 2023
The landmark call: 100% ownership of Global Atlantic, the new Strategic Holdings segment and total operating earnings metric, and the three-engine model KKR still runs on. · Open the full transcript →
The call that created today's reporting: a Strategic Holdings segment, a lower fee-comp ratio, and total operating earnings.
Rob Lewin (Chief Financial Officer): Concurrent with the closing of GA, we have created a new strategic holdings segment, which you will see in our Q1 2024 earnings release. Here the segment operating earnings will be driven by cash dividends from our Core PE portfolio. […] We also revised our compensation ratios, which similarly will be reflected in our Q1 financials, delivering more FRE to our shareholders, and driving even more alignment between our compensation model and the outcomes of our clients. […] Combining these aspects, we will be introducing a new reporting framework that will better highlight our business model. This will include a new financial metric, total operating earnings, which represents our more recurring forms of income.
p. 4 · Read in context →
The three-engine framing and the 2026 targets that every subsequent call has been measured against.
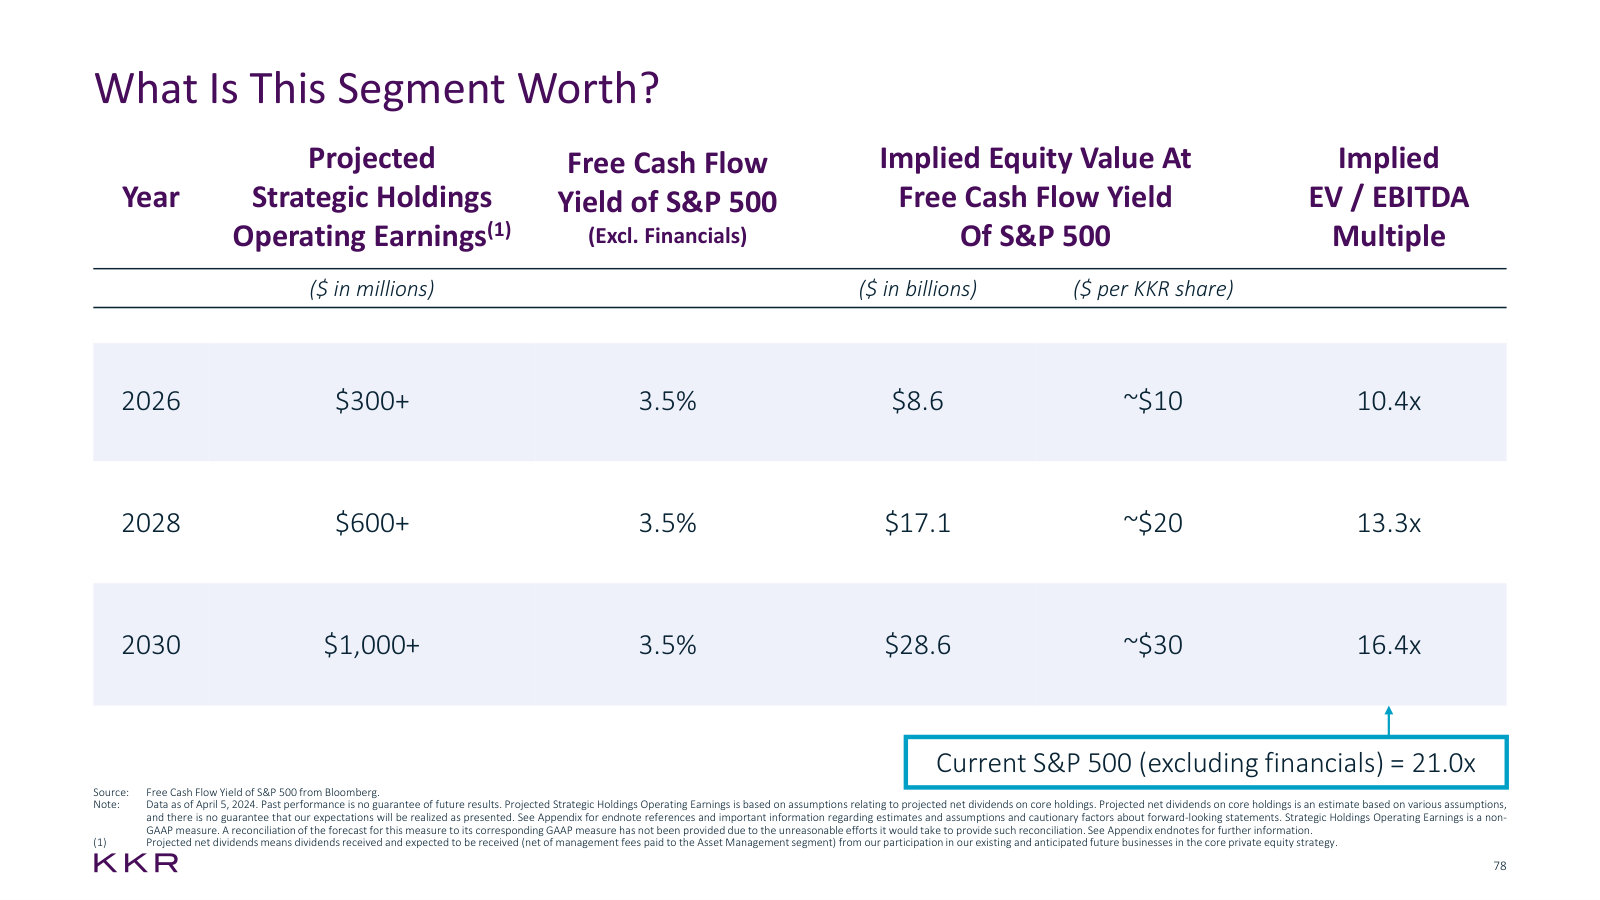
Rob Lewin (Chief Financial Officer): As a reminder, we do expect these announcements to be accretive to all of our per share metrics. And together with the confidence and current visibility we have, it is what allowed us to increase our 2026 FRE per share target to $4.50-plus per share. In 2023, we generated $2.68 per share of FRE. So our expectation is for a lot of growth from here. […] Turning first to our asset management business – there remains a lot of upside here, with multiple drivers of growth. We have a lot of younger strategies that are just beginning to scale. We started 25 or so investing businesses through the past decade alone, and many are now starting to inflect. We are in asset classes and geographies with massive end markets – Asia, infrastructure including climate, and credit are all great examples. And as a reminder, we only want to be competing in areas with large addressable markets and where we have conviction that we can be a top-three player. We are in the early days of tapping into the private wealth end market. We've had early success in our K-Series suite of products, with a tremendous amount of opportunity that is still in front of us. With these growth avenues, along with our strong track record, talent, and the trust that we've built with our clients, we feel that we could double our asset management business from here. And that's without starting anything new. […] And finally, number three, strategic holdings, where our opportunity is highly differentiated. This segment leverages all of our people, capabilities, and our collaborative culture. As a result, we are uniquely positioned to capitalize on what we believe is a huge, addressable market. And that's in addition to the current visibility we already have to drive net dividends in this segment of $300- plus million by 2026, and $600-plus million by 2028.
p. 5 · Read in context →
More calls
Q2 2025 Earnings Call — Q2 2025 · 13 pages · Go here for the first quarter with the Americas XIV flagship fee stream switched on, and the resulting step-up in management fee and FRE margin math. · Open →
Q4 and Full Year 2024 Earnings Call — Q4 2024 · 14 pages · The first full year reported under the new three-segment structure, useful as the clean baseline for the 2026 targets. · Open →
Q3 2024 Earnings Call — Q3 2024 · 16 pages · Read this for the fundraising super-cycle framing and the quarter FRE first passed $1bn, alongside the durable-earnings share of pre-tax profit. · Open →
Q2 2024 Earnings Call — Q2 2024 · 14 pages · The first call after S&P 500 inclusion and the April Investor Day; management restates the full 2026 guidance set and the 2030 Strategic Holdings ambition. · Open →
Q1 2024 Earnings Call — Q1 2024 · 8 pages · The first results reported on the new basis, with the Strategic Holdings portfolio described company-by-company and the 2026/2028/2030 dividend ladder laid out. · Open →
Q4 and Full Year 2021 Earnings Call — Q4 2021 · 28 pages · The pre-restructuring firm at its scaling peak — the first full year with Global Atlantic consolidated, AUM up 87%, management fees up 44%, distributable earnings more than doubled. · Open →
KKR & Co. Inc.'s annual reports contain management's most considered account of the business. These are the sections, passages and visual pages worth opening in the originals preserved in Sources.
KKR & Co. Inc. — FY2025 Annual Report (Form 10-K) — FY2025
The most recent full account of the firm: three segments, $744bn of AUM, and the valuation and clawback mechanics behind the earnings. · Open the full document →
Business Segments — p. 8 · Read the full section →
Management's own framing of the firm: three reporting segments, 36 offices, $744bn of AUM, and why the pieces fit together.
Opening description of the firm and the three-segment business model.
KKR is a leading global investment firm that offers alternative asset management as well as capital markets and insurance solutions. We aim to generate attractive investment returns by following a patient and disciplined investment approach, employing world-class people, and supporting growth in our portfolio companies and communities. […] Founded in 1976, KKR pioneered the leveraged buyout strategy and has been a leader of the private equity industry for five decades. […] Our business model of (i) Asset Management, (ii) Insurance, and (iii) Strategic Holdings corresponds to our three reporting segments. […] Importantly, these pieces were built to leverage our core strengths as a firm: investing acumen, capital allocation expertise and our collaborative culture.
p. 8 · Read in context →
Investment Vehicle Structures, Fee Arrangements and Carried Interest — p. 15 · Read the full section →
The revenue mechanics in management's words: management fees, fee-related performance revenues, carry rates, hurdles and netting holes.
Insurance — p. 18 · Read the full section →
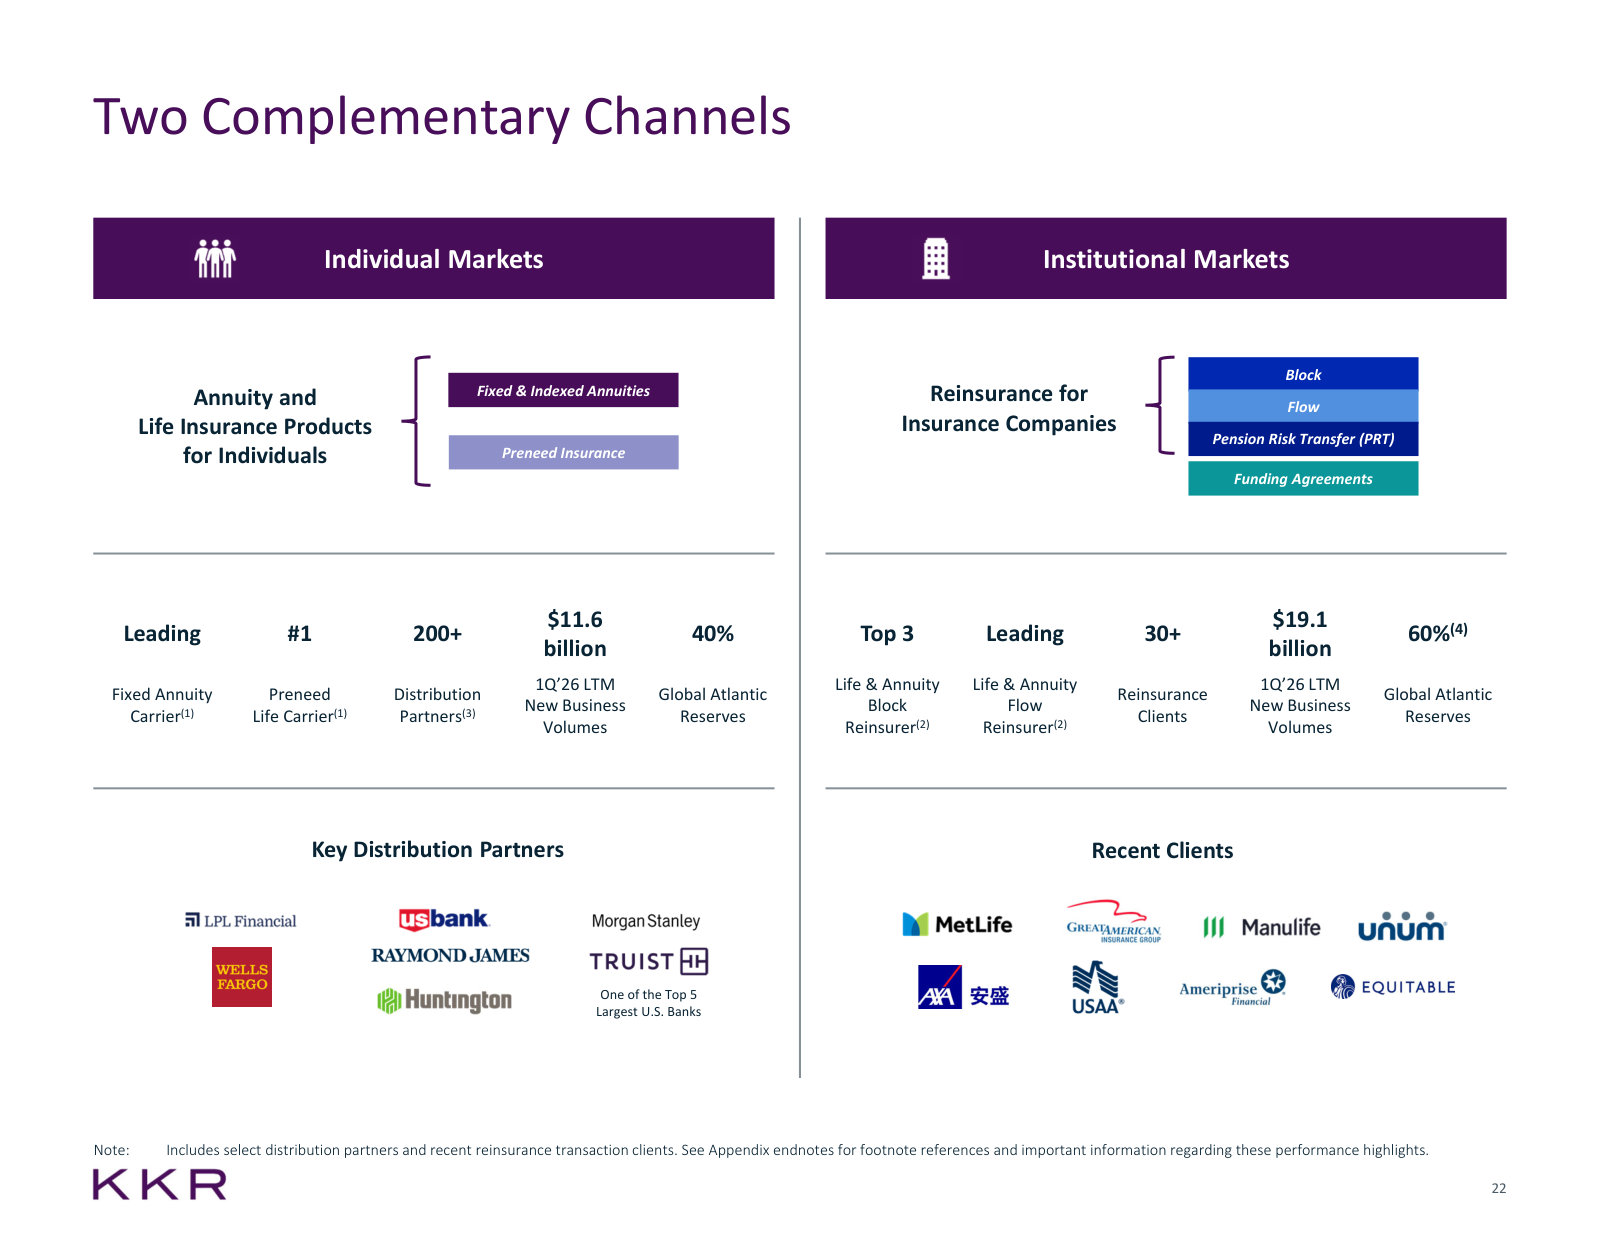
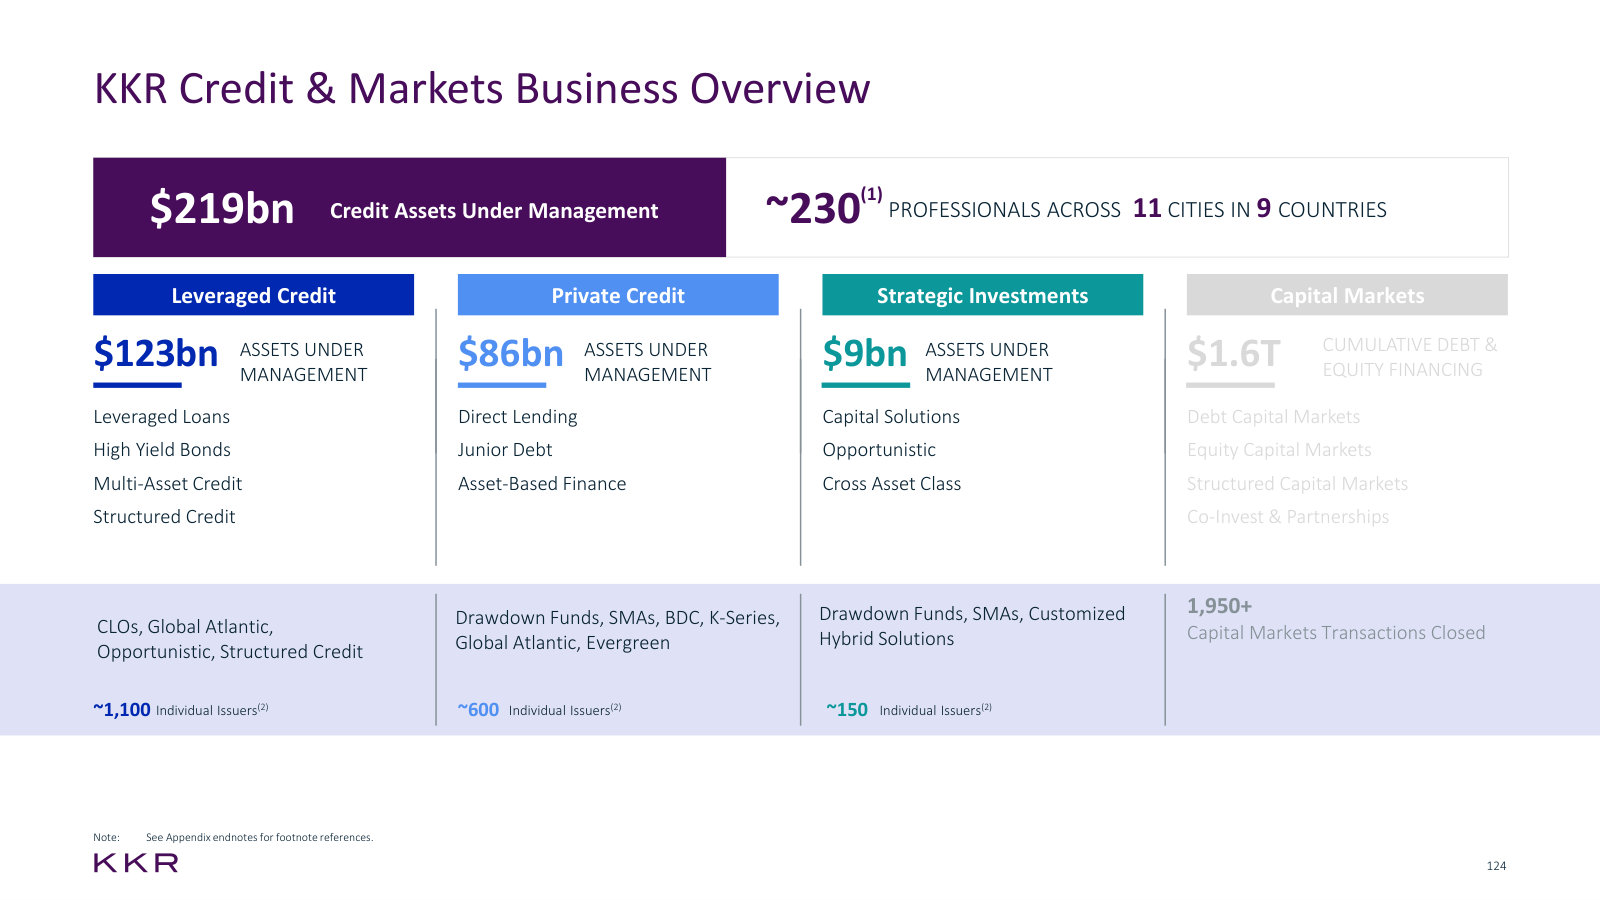
Global Atlantic is now $219bn of the $744bn AUM and a wholly owned balance sheet; this section explains what it sells and to whom.
What Global Atlantic is, and the 2021-2024 path from 60% to full ownership.
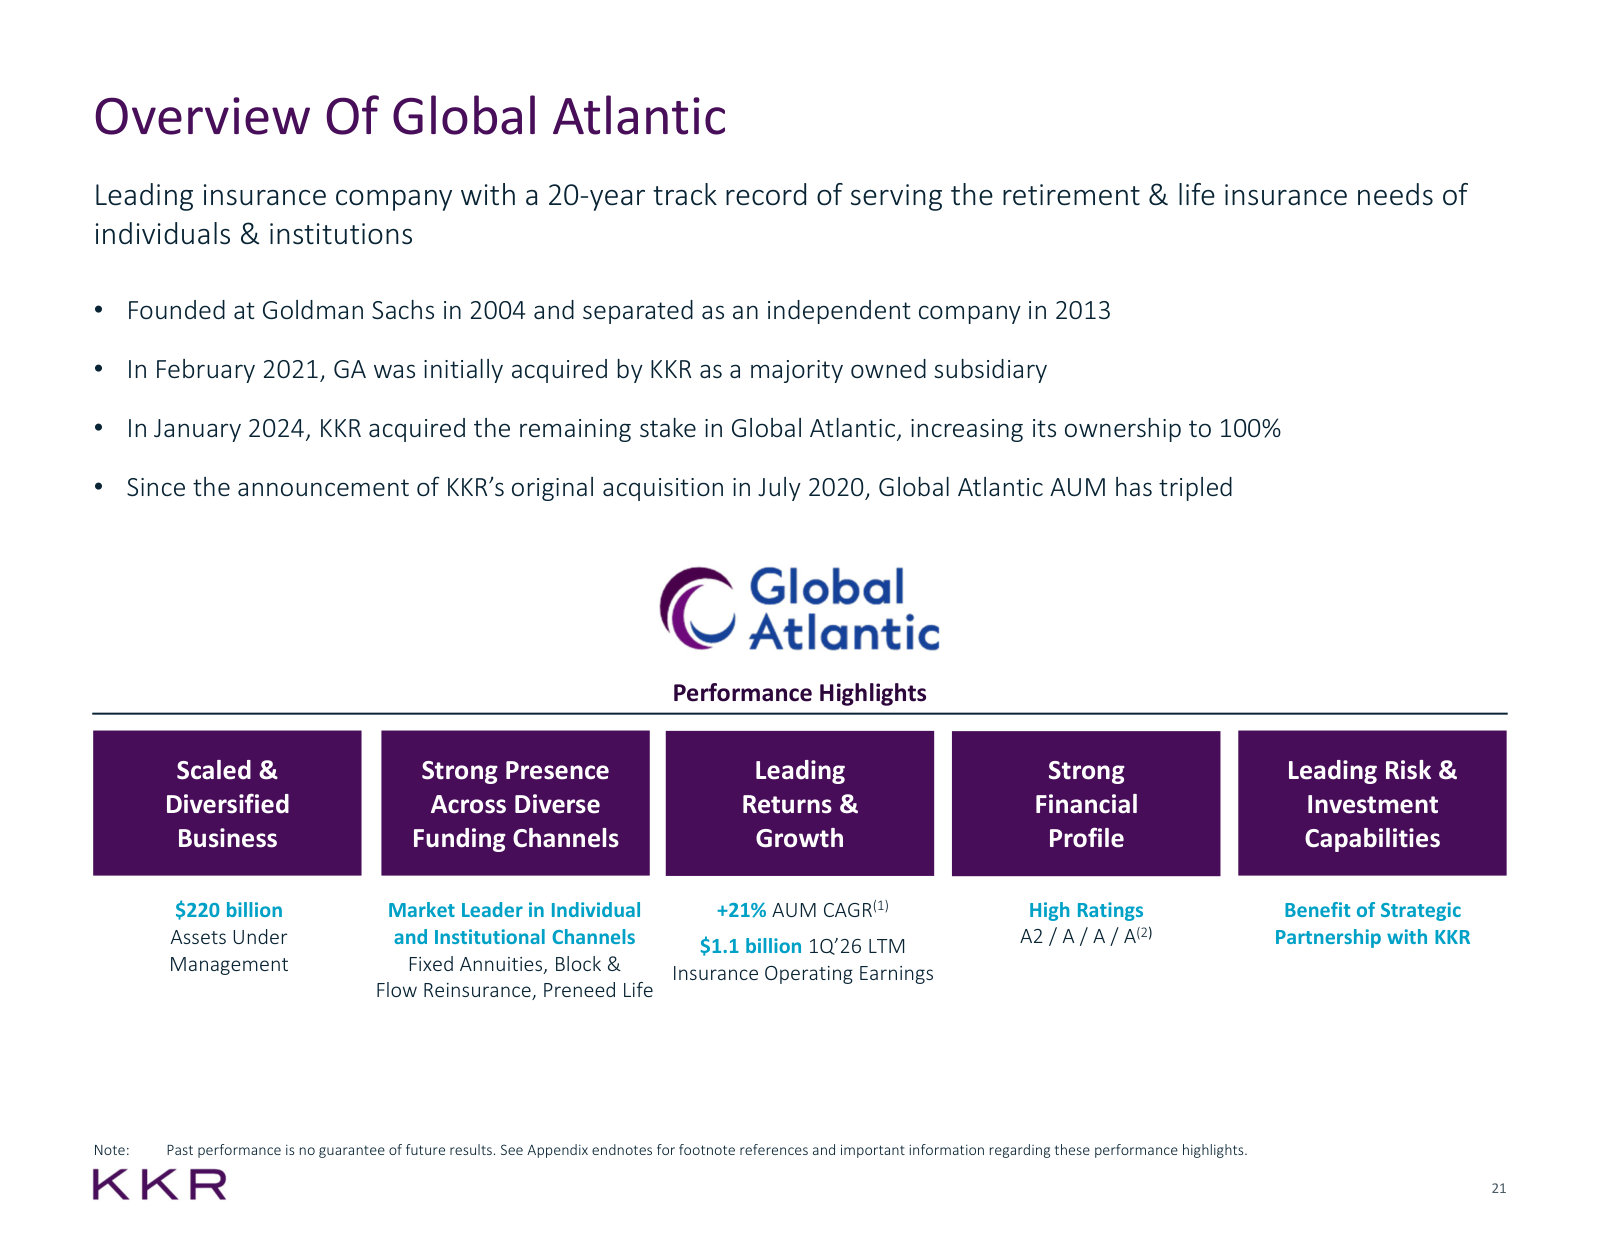
Our insurance business operates under the Global Atlantic brand. Global Atlantic is a leading retirement and life insurance company, with an over 20-year track record of providing a broad suite of protection, legacy, and savings products to customers and reinsurance solutions to clients across individual and institutional markets. […] KKR acquired a majority controlling interest in Global Atlantic on February 1, 2021 (approximately 60%), and acquired the remainder of Global Atlantic on January 2, 2024, increasing our ownership to 100%.
p. 18 · Read in context →
Strategic Holdings — p. 21 · Read the full section →
The segment created in Q1 2024: 19 wholly held operating companies whose dividends KKR now reports as a third earnings stream.
Definition, expected income (dividends) and the fee boundary against the Asset Management segment.
Our Strategic Holdings segment, which we started reporting in the first quarter of 2024, acquires and manages interests in operating companies that are owned by the firm. Today, those companies primarily consist of our participation in our core private equity strategy. We have acquired, and in the future we expect to continue to acquire, other long-term assets outside of, and in addition to, our participation in our core private equity strategy. Strategic Holdings is not limited to acquiring companies in specific industries. We intend to hold the companies in our Strategic Holdings segment over a longer period of time, and we believe most of these companies generally have a lower risk profile than would be typical for an investment through our traditional private equity strategy. We currently expect our Strategic Holdings segment primarily to generate income from the receipt of dividends from our ownership stakes in these businesses and, upon the sale of any ownership stake, realized investment income from such sale. As of December 31, 2025, our Strategic Holdings segment consisted of ou ownership stakes in 19 companies. […] The fees and carried interest paid by the third party investors in our core private equity funds continue to be reported in our Asset Management segment and are not reported in our Strategic Holdings segment.
p. 21 · Read in context →
The agreements governing our carry-paying funds have in the past and may in the future give rise to a contingent obligation that requires us to return or contribute significant cash amounts to our funds and fund investors. — p. 40 · Read the full section →
Clawback is not hypothetical here: KKR discloses a realized carried interest repayment in Q4 2025 on Asian Fund II.
The clawback obligation, stated plainly.
We have in the past and may in the future be required to return carried interest that we have received from investment funds. The partnership documents governing our carry-paying funds across our asset classes include what are often called “clawback” provisions.
p. 40 · Read in context →
Where it bites: employee carry pool, available cash, fundraising - and a repayment already made.
We would continue to be subject to such obligation even if carry has been distributed to current or former employees through our carry pool. If such current or forme employees do not satisfy their share of any clawback obligation, we will be responsible for funding the entire obligation and may need to seek other sources of liquidity to fund such an obligation. […] To the extent one or more obligations were to occur for any one or more of our carry-paying funds, we might not have available cash to satisfy such obligation once it is realized, putting us in breach of the fund’s governing agreements and potentially resulting in a material adverse impact on our ability to raise additional or successor funds in the future. […] including information about realized carried interest repayment in the fourth quarter 2025 relating to our Asian Fund II.
p. 41 · Read in context →
The portion of our AUM we refer to as perpetual capital is not permanent and is subject to change. — p. 43 · Read the full section →
Perpetual capital carries the growth story; management spells out how quickly it can leave, including from the insurance book.
What counts as perpetual capital, and the withdrawal, redemption and surrender routes out of it.
We refer to a significant portion of our AUM as perpetual capital, because this AUM has an indefinite term with no predetermined requirement to return invested capital to investors upon the realization of investments. This AUM includes the capital of our evergreen products, which include investment vehicles registered under the Investment Company Act, certain unregistered investment vehicles like our K-Series offered to individual investors, and listed companies like KREF and Crescent Energy, as well as the capital of our insurance companies. However, in addition to fluctuations based on the valuations of the underlying investments of the AUM, this capital is subject to material reduction, including through withdrawals, redemptions, periodic payments such as dividends or required distributions, and termination of investment advisory agreements, and these reductions may occur with minimal notice. […] Unless the inflows from writing new insurance policies and entering into new reinsurance transactions exceeds outflows to pay contractual obligations, or the valuation of the assets backing our insurance liabilities increases in excess of any expected appreciation, our permanent capital from our insurance subsidiaries and sponsored insurers would be reduced.
p. 43 · Read in context →
Regulations impacting the insurance industry and insurance companies owned by alternative asset managers may adversely affect our business. — p. 51 · Read the full section →
The regulatory question aimed squarely at KKR's model - an alternative manager running an insurer's investment portfolio.
NAIC scrutiny of affiliated investments and ratings, plus possible designation as an internationally active group.
As part of their efforts to address potential risks stemming from an insurance company’s relationship with alternative asset managers that may impact the insurance company’s risk profile, regulators have increased their scrutiny of certain structured investments held by insurance companies, the appropriateness of investment ratings and potential conflicts of interest (including affiliated investments), and potential misalignment of incentives. This growing scrutiny may increase the risk of regulatory actions against our insurance business and could result in new or amended regulations that limit our ability as an investment adviser, or make it more burdensome or costly, to enter into or amend existing investment management agreements with insurance companies and thereby grow our insurance strategy. […] Additionally, the group-wide supervisor for our insurance business is the Indiana Department of Insurance. The Indiana Department of Insurance has informed us that it will be part of the International Association of Insurance Supervisors’ Global Monitoring Exercise, a risk assessment framework to monitor key risks and trends […] At this time, we cannot accurately predict whether we will be named or designated as an IAIG or the impact, if any, on us.
p. 52 · Read in context →
Analysis of Segment Operating Results — p. 98 · Read the full section →
The fee line explained fund by fund - which vehicles switched on, which stepped down to invested capital, what was retroactive.
Drivers of the $639m increase in management fees, by business line.
The increase in Private Equity management fees was primarily attributable to (i) management fees commencing at North America Fund XIV in the second quarter of 2025 and (ii) management fees earned on new capital raised over the past twelve months at our private equity K-Series vehicles, net of certain revenue sharing arrangements. The increase was partially offset by (i) a lower level of management fees earned from Ascendant (our U.S. middle market traditional private equity fund) due to management fees earned on new capital raised in 2024 that were retroactive to the start of the fund’s investment period and no such retroactive fees were earned in the current year, (ii) a decrease in management fees earned from North America Fund XIII as a result of entering its post-investment period in the second quarter of 2025, and now paying fees based on invested capital rather than committed capital, and (iii) no management fees earned from Asian Fund II in the current period due to the termination of management fees in the fourth quarter of 2024. […] The increase in Real Assets management fees was primarily attributable to (i) management fees commencing at Globa Infrastructure Investors V in the third quarter of 2024, (ii) management fees earned on new capital raised over the past twelve months at our infrastructure K-Series vehicles, net of certain revenue sharing arrangements, and (iii) a higher level of management fees earned from Global Atlantic primarily due to the growth in assets from inflows. The increase was partially offset by a decrease in management fees earned from Global Infrastructure Investors III and Asia Pacific Infrastructure Investors due to a decrease in invested capital during the current year.
p. 99 · Read in context →
Fair Value Measurements — p. 131 · Read the full section →
For an alternative manager the valuation policy is the business model: Level III marks set carried interest and investment income.
Management's own caution on the uncertainty in Level III valuations.
Our investments and financial instruments are impacted by various economic conditions and events outside of our control that are difficult to quantify or predict, which may have a significant impact on the valuation of our investments and, therefore, on the carried interest and investment income we realize. […] There is inherent uncertainty involved in the valuation of Level III investments, and there is no assurance that, upon liquidation, KKR will realize the values reflected in our valuations. Our valuations may differ significantly from the values that would have been used had an active market for the investments existed, and it is reasonably possible that the difference could be material.
p. 131 · Read in context →
KKR & Co. Inc. — FY2023 Annual Report (Form 10-K) — FY2023
Included for one section only: the two-segment firm as management described it before Strategic Holdings was carved out in 2024. · Open the full document →
Our Business — p. 14 · Read the full section →
The last 10-K before Strategic Holdings existed: two segments, and perpetual capital framed as a strength rather than a risk.
More annual reports
KKR & Co. Inc. — FY2024 Annual Report (Form 10-K) — FY2024 · 558 pages · First 10-K to report Strategic Holdings as a segment and the first full year owning 100% of Global Atlantic. · Open →
KKR & Co. Inc. — FY2022 Annual Report (Form 10-K) — FY2022 · 598 pages · The down-market year: fundraising, realizations and carry in a period when exits largely stopped. · Open →
KKR & Co. Inc. — FY2021 Annual Report (Form 10-K) — FY2021 · 586 pages · The year the insurance business arrived: first report consolidating Global Atlantic after the February 2021 acquisition. · Open →
Source: S&P Capital IQ consensus via Xpressfeed · Generated 2026-07-29.
The forward tape was marked down and has since steadied: FY2027 normalized EPS consensus sits at $7.35, down 9.6% from six months ago, and FY2028 at $8.60, down 9.3%, yet both are flat to marginally higher over the last 30 days. KKR kept beating through the markdown, topping normalized EPS consensus in seven of the last eight quarters and clearing both lines by more than 10% in the March 2026 quarter. What survived the cuts is still a steep curve: consensus carries FY2027 revenue up 18.8% and EPS up 20.2%. The depth behind that curve is uneven, with 22 analysts on the EPS line and six on revenue.
FY2027 EPS consensus is down 9.6% over six months but has stopped falling in the last 30 days
Currency: USD · Scale: money in millions, absolute · Point-in-time consensus; Δ90d is Now versus 90d.
| Metric | FY | 180d | 90d | 30d | Now | Δ90d |
|---|---|---|---|---|---|---|
| EPS (normalized) | FY2027 | $8.13 | $7.65 | $7.40 | $7.35 | -3.9% |
| EPS (normalized) | FY2028 | $9.48 | $8.57 | $8.59 | $8.60 | +0.3% |
| Revenue | FY2027 | $12.71bn | $12.30bn | $12.22bn | $12.28bn | -0.1% |
| Revenue | FY2028 | $15.08bn | $13.76bn | $13.70bn | $13.90bn | +1.0% |
Seven EPS beats in eight quarters, and the latest print cleared both lines by more than 10%
Current sequences by metric: Revenue: 1 consecutive beat; EPS (normalized): 1 consecutive beat.
Currency: USD · Scale: money in millions, absolute · Consensus is captured before each actual first became effective.
| Quarter | Metric | Consensus | Actual | Surprise | Outcome |
|---|---|---|---|---|---|
| Q1 FY2026 | Revenue | $2.11bn | $2.35bn | +11.2% | Beat |
| Q1 FY2026 | EPS (normalized) | $1.26 | $1.39 | +10.3% | Beat |
| Q4 FY2025 | Revenue | $1.78bn | $1.64bn | -8.4% | Miss |
| Q4 FY2025 | EPS (normalized) | $1.14 | $1.12 | -1.6% | Miss |
| Q3 FY2025 | Revenue | $2.26bn | $2.40bn | +6.3% | Beat |
| Q3 FY2025 | EPS (normalized) | $1.30 | $1.41 | +8.6% | Beat |
| Q2 FY2025 | Revenue | $1.84bn | $1.86bn | +0.8% | Beat |
| Q2 FY2025 | EPS (normalized) | $1.14 | $1.18 | +3.6% | Beat |
| Q1 FY2025 | Revenue | $1.71bn | $1.77bn | +3.3% | Beat |
| Q1 FY2025 | EPS (normalized) | $1.13 | $1.15 | +1.7% | Beat |
| Q4 FY2024 | Revenue | $1.96bn | $2.04bn | +4.0% | Beat |
| Q4 FY2024 | EPS (normalized) | $1.27 | $1.32 | +3.7% | Beat |
| Q3 FY2024 | Revenue | $1.75bn | $1.96bn | +12.3% | Beat |
| Q3 FY2024 | EPS (normalized) | $1.20 | $1.38 | +15.4% | Beat |
| Q2 FY2024 | Revenue | $1.62bn | $1.73bn | +7.0% | Beat |
| Q2 FY2024 | EPS (normalized) | $1.06 | $1.09 | +2.4% | Beat |
Even after the cuts, consensus carries FY2027 revenue up 18.8% and EPS up 20.2%
Growth decelerates modestly into FY2028 — revenue +13.2%, EPS +17.0% — while consensus ROE steps up in each of the three years. The EBITDA row rests on one to two analysts and should be read as indicative rather than as a street view.
Currency: USD · Scale: money in millions, absolute · YoY uses the prior fiscal year from the feed; analyst count and range use the first displayed period.
| Metric | FY2026E | FY2027E | FY2028E | YoY | Analysts | Low / high |
|---|---|---|---|---|---|---|
| Revenue | $10.34bn | $12.28bn | $13.90bn | +35.0% | 6 | $9.74bn / $10.89bn |
| EBITDA | $7.45bn | $9.02bn | $12.09bn | +25.0% | 2 | $6.55bn / $8.35bn |
| EPS (normalized) | $6.12 | $7.35 | $8.60 | +25.6% | 22 | $5.85 / $6.35 |
| ROE | 13.3% | 13.8% | 14.9% | +3.7pt | — | — |
Where the street disagrees
The FY2027 EPS range is about 15% of the mean on a 22-analyst line, so the dispersion is not a small-sample artifact. FY2027 revenue is slightly wider in percentage terms but rests on six analysts, and the FY2028 revenue range on three is closer to a sampling of models than a consensus.
Currency: USD · Scale: money in millions, absolute · Spread/mean is absolute high-low divided by absolute mean.
| Metric | Period | Mean | Low–high | Spread/mean | Analysts |
|---|---|---|---|---|---|
| EPS (normalized) | FY2027E | $7.35 | $6.75–$7.82 | 14.6% | 22 |
| Revenue | FY2027E | $12.28bn | $11.37bn–$13.40bn | 16.5% | 6 |
| EPS (normalized) | FY2028E | $8.60 | $7.76–$9.20 | 16.7% | 10 |
| Revenue | FY2028E | $13.90bn | $13.02bn–$14.53bn | 10.9% | 3 |
Coverage caution: this is an EPS consensus, not a full-model consensus
Normalized EPS carries 22 analysts in FY2026 and FY2027, but 10 in FY2028 and 2 in FY2029. Revenue has 6 analysts in FY2027 and 3 in FY2028, FY2028 EBITDA has 1, and the GAAP net income and EPS lines carry 1-2 throughout, with the FY2025 GAAP net income mean landing far from the reported actual. Treat anything outside the normalized EPS row as a small sample.
Visible Alpha broker models via S&P Xpressfeed · 16 brokers · 366 line items · freshest revision 2026-07-21.
The street models KKR as an annuity with a cyclical option attached. Fee-related earnings compound in the mid-to-high teens through FY-2028 on a margin that widens in every modeled year, and the 16-broker panel barely disagrees about it. The disagreement, and the FY-2026 inflection, sits in the monetization lines: realized performance income, realized investment income and capital markets fees. Fee rates stay flat across the horizon, so the fee build is a volume story rather than a pricing one.
Fee-related earnings are the modeled engine: +17% in FY-2027 on a margin that keeps widening
The build is ordinary in the best sense: management fees compound, fee-related compensation grows more slowly, and the margin grinds higher in every modeled year. Fee-related earnings per adjusted share runs $4.83 in FY-2026 to $6.37 in FY-2028. None of this sequence depends on markets cooperating.
| Line | FY-2025A | FY-2026E | FY-2027E | FY-2028E | YoY | Brokers |
|---|---|---|---|---|---|---|
| Fee revenue | — | — | — | — | — | — |
| Management fees | $4.06bn | $4.87bn | $5.52bn | $6.27bn | +19.9% | 16 |
| Transaction and monitoring fees net | $1.13bn | $1.11bn | $1.40bn | $1.61bn | -2.0% | 16 |
| Fee-related performance revenues | $183.61m | $408.92m | $496.34m | $574.79m | +122.7% | 16 |
| Total fee-related revenue | $5.38bn | $6.39bn | $7.42bn | $8.45bn | +18.8% | 16 |
| Costs | — | — | — | — | — | — |
| Fee-related compensation | $940.16m | $1.12bn | $1.29bn | $1.47bn | +19.1% | 16 |
| Earnings | — | — | — | — | — | — |
| Fee-related earnings | $3.72bn | $4.44bn | $5.21bn | $5.97bn | +19.2% | 16 |
| Fee-related earnings margin(%) | 69.2% | 69.5% | 70.2% | 70.6% | +0.2pt | 16 |
| Fee-related earnings per adjusted share($) | $4.14 | $4.83 | $5.57 | $6.37 | +16.7% | 16 |
The inflection is monetization: realized performance income jumps 68% in FY-2026, and private equity supplies it
Private equity carries the recovery, up 77% in FY-2026, while credit and real assets carry stays small. Realized performance income compensation absorbs roughly seven-tenths of the gross line in every modeled year, so the net figure is the one that matters. Capital markets fees are flat in FY-2026 before turning up 26% in FY-2027.
| Line | FY-2025A | FY-2026E | FY-2027E | FY-2028E | YoY | Brokers |
|---|---|---|---|---|---|---|
| Realized carry | — | — | — | — | — | — |
| Realized performance income | $1.97bn | $3.32bn | $3.91bn | $4.23bn | +68.1% | 16 |
| Realized performance income - Private equity | $1.47bn | $2.60bn | $2.98bn | $3.35bn | +76.9% | 14 |
| Realized performance income - Real assets | $281.76m | $410.60m | $601.86m | $614.52m | +45.7% | 14 |
| Realized performance income - Credit and Liquid Strategies | $260.71m | $303.10m | $355.26m | $358.25m | +16.3% | 14 |
| Net to KKR | — | — | — | — | — | — |
| Realized performance income compensation | $1.42bn | $2.36bn | $2.78bn | $3.00bn | +66.3% | 16 |
| Net realized performance income | $553.20m | $955.61m | $1.13bn | $1.23bn | +72.7% | 16 |
| Other realized | — | — | — | — | — | — |
| Realized investment income | $433.03m | $633.00m | $882.75m | $1.11bn | +46.2% | 14 |
| Transaction fees - Capital markets | $953.28m | $940.11m | $1.19bn | $1.40bn | -1.4% | 15 |
Brokers agree on the annuity and split on the cash-out
The same 16-broker panel sits within a few percent on FY-2027 fee-related earnings; the divergence is concentrated in the lines below. Realized investment income is the widest, its top of range close to three times the bottom, and real assets carry is skewed by a single high estimate.
| Line | Period | Median | Q1–Q3 | Min–max | Brokers |
|---|---|---|---|---|---|
| Realized investment income | FY-2027E | $775.61m | $680.22m–$989.51m | $602.32m–$1.76bn | 14 |
| Realized performance income - Real assets | FY-2027E | $523.46m | $463.33m–$597.19m | $376.70m–$1.58bn | 14 |
| Fee-related performance revenues | FY-2027E | $523.75m | $447.19m–$575.61m | $270.00m–$701.89m | 16 |
| Realized performance income - Private equity | FY-2027E | $2.98bn | $2.63bn–$3.28bn | $2.24bn–$4.01bn | 14 |
| Transaction fees - Capital markets | FY-2027E | $1.18bn | $1.10bn–$1.29bn | $917.05m–$1.36bn | 15 |
Growth is volume, not price: fee rates hold at 0.76% while fee-paying AUM compounds
Credit and Liquid Strategies contributes the largest fee-paying inflows in every modeled year. Private equity inflows fall 30% in FY-2026 before recovering 26% in FY-2027, which reads as fundraising cadence rather than a structural break. Blended and segment fee rates are essentially unchanged across the horizon.
| Line | FY-2025A | FY-2026E | FY-2027E | FY-2028E | YoY | Brokers |
|---|---|---|---|---|---|---|
| Fee-paying inflows | — | — | — | — | — | — |
| Inflows - FPAUM - Credit and Liquid Strategies | $60.30bn | $52.61bn | $63.54bn | $75.46bn | -12.7% | 15 |
| Inflows - FPAUM - Private equity | $35.50bn | $24.74bn | $31.15bn | $28.72bn | -30.3% | 15 |
| Inflows - FPAUM - Real assets | $29.54bn | $31.95bn | $33.79bn | $42.88bn | +8.2% | 15 |
| Inflows - FPAUM | $125.68bn | $109.54bn | $129.04bn | $147.06bn | -12.8% | 13 |
| Outflows & balance | — | — | — | — | — | — |
| Outflows - FPAUM | $-49.43bn | $-55.44bn | $-56.72bn | $-67.34bn | -12.2% | 13 |
| End of period - FPAUM | $601.93bn | $675.08bn | $763.59bn | $866.93bn | +12.2% | 14 |
| Fee rates | — | — | — | — | — | — |
| Total management fee margin(%) | 0.7% | 0.8% | 0.8% | 0.8% | +0.0pt | 14 |
| Management fee margin - Credit and Liquid Strategies(%) | 0.5% | 0.5% | 0.5% | 0.5% | +0.0pt | 15 |
| Management fees rate - Private equity(%) | 1.1% | 1.2% | 1.2% | 1.2% | +0.0pt | 15 |
| Management fees rate - Real assets(%) | 0.8% | 0.9% | 0.9% | 0.9% | +0.0pt | 15 |
Global Atlantic is modeled to trough in FY-2026, not to break
Global Atlantic ROAE is modeled at 9.08% in FY-2026, below FY-2025's 11.38%, then recovers to 10.24% in FY-2027 and 11.62% in FY-2028. Insurance operating earnings trace the same path, dipping this year before two years of growth, while modeled Global Atlantic book value rises throughout. Brokers are treating this as a returns reset on a growing book, not a contraction.
FY-2028 rests on roughly half the panel that covers FY-2026 and FY-2027
Most FY-2026 and FY-2027 lines carry 14 to 16 brokers; the FY-2028 column typically falls to 7 or 8, and segment carry lines to 5 or 6. Read the final year as a smaller sample rather than a firmer view. Vintage is not the issue here: the consensus file is dated 2026-07-23 and the lines used above were revised 2026-07-21.
Headline P&L consensus, momentum and beat/miss live in the CapIQ tab.
Source: S&P Capital IQ transcripts via Xpressfeed · latest indexed call 2026-05-05 · generated 2026-07-29.
Latest call digest
KKR & Co. Inc., Q1 2026 Earnings Call, May 05, 2026 · 2026-05-05T14:00:00
Q1 2026 call, May 5, 2026. Prepared remarks led with results near firm records — fee-related earnings of $1.13 per share, up 23% year-over-year, total operating earnings of $1.47 and adjusted net income of $1.39 — alongside $28 billion of new capital, the $23 billion final close of North America XIV, the closing of the Arctos acquisition, and $317 million of stock repurchased or retired through May 1 at an average price of approximately $91.
The material change came late in the CFO's script rather than in Q&A. Management stepped back from the 2026 adjusted net income target, saying that if you were handicapping the $7-plus figure, it is more likely KKR lands below it. The framing offered was timing rather than value: gross monetization revenue was up more than 50% year-over-year in the quarter, and exits since March 31 plus signed transactions represent over $1.2 billion of gross monetization revenue, which management called the largest forward figure discussed on a call in its history.
Q&A pushed on two things the prepared remarks handled lightly. First, attribution — Glenn Schorr and Brennan Hawken each asked what specifically slipped, and the answers stayed at the level of degree, process and market backdrop rather than naming assets or sectors. Second, AI: analysts from Wolfe Research, Morgan Stanley and Autonomous Research asked how disintermediation risk has been underwritten and whether the benefit can be quantified. The answers gave exposure percentages (software around 7% of AUM, around 15% within private equity) and described process, but offered no KPIs and no quantified uplift. It was also only under questioning that management disclosed software marks largely declined in the quarter despite healthy revenue and EBITDA growth.
Management pre-empted the private credit debate with added pages in the earnings release, sizing direct lending at $39 billion or 5% of AUM and the private BDC at around $3 billion or 0.4% of AUM. One forward caution was new: after $4 billion of K-Series inflows against roughly $250 million of redemptions, management said it expects a slowdown in Q2.
Participant coverage from the latest call.
| Group | Participants | Count |
|---|---|---|
| Management | Operator; Craig Larson — Partner & Head of Investor Relations, KKR & Co. Inc.; Robert Lewin — Chief Financial Officer, KKR & Co. Inc.; Scott Nuttall — Co-CEO & Director, KKR & Co. Inc. | 4 |
| Analysts | Craig Siegenthaler — MD & Head of the North American Asset Managers, Brokers & Exchanges Team, BofA Securities, Research Division; Glenn Schorr — Senior MD & Senior Research Analyst, Evercore ISI Institutional Equities, Research Division; Alexander Blostein — Lead Capital Markets Analyst, Goldman Sachs Group, Inc., Research Division; Bart Dziarski — Analyst, RBC Capital Markets, Research Division; Steven Chubak — Director of Equity Research, Wolfe Research, LLC; William Katz — Senior Analyst, TD Cowen, Research Division; Michael Brown — Managing Director, UBS Investment Bank, Research Division; Michael Cyprys — Executive Director and Senior Research Analyst, Morgan Stanley, Research Division; Brian Mckenna — Director & Equity Research Analyst, Citizens JMP Securities, LLC, Research Division; Brennan Hawken — Analyst, BMO Capital Markets Equity Research; Daniel Fannon — Senior Equity Research Analyst, Jefferies LLC, Research Division; Arnaud Giblat — MD & Research Analyst, BNP Paribas, Research Division; Crispin Love — Director & Senior Research Analyst, Piper Sandler & Co., Research Division; Patrick Davitt | 14 |
Curated latest-call exchanges; one row per analyst topic.
| Analyst | Firm | Topic | What changed in Q&A |
|---|---|---|---|
| Glenn Schorr | Evercore ISI | Attribution of the 2026 ANI shortfall | Asked what changed and which parts of the portfolio the market will not absorb, given record embedded gains. The reply reframed it as a matter of degree and pointed back to the forward monetization guide; no asset- or sector-level attribution was given. |
| Brennan Hawken | BMO Capital Markets | LP reaction to delayed realizations | Followed Schorr, asking whether further delay is straining LP relationships. Management separated the two, citing the North America fund's final close and its record of returning more than it called in the U.S. private equity business in 9 of the last 10 years. |
| Steven Chubak | Wolfe Research | AI disintermediation risk in Strategic Holdings | Asked for KPIs to handicap AI risk in the business services concentration. The answer gave AUM exposure percentages and described the diligence and value-creation approach, and disclosed that software marks largely declined in the quarter, but no KPIs were provided. |
| Craig Siegenthaler | BofA Securities | Global Atlantic competition and ROE | Opened the call on annuity competition. Management conceded competition on liabilities is very high and spreads are as tight as they have been in a long time, and said it pulled back on origination in Q1; it pointed to $6 billion of dry powder equity as the offset. |
| William Katz | TD Cowen | Normalized insurance ROE and timeline | Asked directly for a normalized ROE level and a timeline. The answer gave a mark-adjusted run rate and noted the quarter missed its targeted mark return, then referred to the disclosure page; neither a normalized ROE nor a timeline was given. |
| Daniel Fannon | Jefferies | Private wealth after private credit vehicle stress | Asked whether the noise in private credit vehicles reshapes the retail lineup and the Capital Group roadmap. Management sized K-Series at 12% of trailing-12-month fundraising and said its view of the long-term path is unchanged, while conceding media attention will likely slow flows for a period. |
| Crispin Love | Piper Sandler | Institutional appetite for direct lending | Asked how institutional behaviour has shifted against the retail redemption headlines. Management said institutions had drifted toward asset-based finance over the prior 12 to 24 months and have re-engaged on direct lending in recent weeks on better spreads, fees, terms and leverage. |
| Patrick Davitt | Autonomous Research | AI exposure in the India portfolio | Asked whether the India book has been scrubbed for outsourcing disintermediation. Management said it has been scrubbed with no elevated concern, and that the firm is not exposed to the sharp decline it observes in Indian sector hiring; no exposure figure was disclosed. |
| Michael Cyprys | Morgan Stanley | Quantifying AI revenue uplift versus cost savings | Asked for a split and a quantification of AI benefit in the portfolio. Management said an EBITDA uplift is being seen broadly but declined to quantify, saying guideposts would come at some later point. |
| Michael Brown | UBS Investment Bank | Arctos fee profile and wealth roadmap | Asked for the fee rate on the $10 billion of fee-paying AUM. Management declined to disclose Arctos-specific financials, said terms generally resemble KKR closed-end funds, and that results will sit inside the private equity line for the foreseeable future. |
Theme tracker
Themes are curator-classified across supplied calls.
| Theme | Status | Quarters mentioned | Read-through |
|---|---|---|---|
| Linear deployment and portfolio construction as the answer to 2021-vintage criticism | persisted | Q2 2023, Q2 2024, Q3 2024, Q4 2024, Q1 2025, Q2 2025, Q3 2025, Q4 2025, Q1 2026 | This is the firm's single most repeated defence, and it has stayed word-for-word consistent across nine calls. It has also proven load-bearing: management uses it to explain outperformance on monetizations, on fundraising, and most recently on AI exposure, arguing the assets it did not want were sold years ago. When one argument is asked to carry that many different questions, it is worth watching whether it keeps being validated by realized outcomes. |
| Asset-based finance as the credit growth engine | persisted | Q2 2023, Q3 2023, Q4 2023, Q1 2024, Q2 2024, Q3 2024, Q4 2024, Q1 2025, Q2 2025, Q3 2025, Q4 2025, Q1 2026 | Present on every call in the index, with disclosed platform AUM rising from $45 billion in Q2 2023 to over $90 billion by Q1 2026. Its role in the story has changed: it started as an under-appreciated adjacency and by Q1 2026 is used as the reason credit fundraising held up while direct lending sentiment deteriorated. |
| Private wealth build-out (K-Series, then Capital Group) | persisted | Q2 2023, Q3 2023, Q4 2023, Q1 2024, Q2 2024, Q3 2024, Q4 2024, Q1 2025, Q2 2025, Q3 2025, Q4 2025, Q1 2026 | Disclosed K-Series AUM moves from $2.4 billion a year before Q4 2023 to over $38 billion at 3/31/26. The commentary has been consistently framed around long-horizon product quality rather than near-term flows, which makes the Q1 2026 admission that a Q2 slowdown is expected the first explicit forward caution in the sequence. |
| Reframing how insurance economics are measured | persisted | Q2 2023, Q3 2023, Q4 2023, Q1 2024, Q2 2024, Q3 2024, Q4 2024, Q1 2025, Q2 2025, Q3 2025, Q4 2025, Q1 2026 | The measuring stick has moved three times: a 14% to 15% pretax segment ROE through 2024, then an all-in ROE approaching 20% during 2025, then a total-economics disclosure page plus a cash-versus-accrued adjustment from Q3 2025. Each step is defensible on its own and each has moved attention away from the reported segment line. Analysts have asked for a normalized ROE in several of these quarters without getting a number. |
| Analyst focus on capital markets revenue trajectory | dropped | Q2 2023, Q3 2023, Q4 2023, Q1 2024, Q2 2024, Q3 2024, Q1 2025, Q2 2025, Q3 2025 | For nine calls this drew direct questions about run rate and the path back above the 2021 revenue level. It drew none on the Q4 2025 or Q1 2026 calls, where reported capital markets fees were $225 million and $224 million. The likeliest reading is that the line has stabilised and stopped being the swing factor, not that it deteriorated. |
| Real estate equity bottoming and leaning in | dropped | Q2 2023, Q3 2023, Q2 2024, Q3 2024, Q4 2024 | Management repeatedly argued real estate values had bottomed and that it was deploying against that view. The topic effectively disappears from Q1 2025 onward; the only later mention is a Q4 2025 question about real estate weighting inside the Global Atlantic portfolio, framed around yield and mix rather than the cycle call. The original call has not been revisited or scored on these calls. |
| Flagship fundraising super-cycle timing | dropped | Q2 2023, Q3 2023, Q4 2023, Q2 2024, Q3 2024, Q4 2024, Q1 2025 | A standing analyst question for seven calls: when do the flagships launch, close and turn on. It fades once North America XIV closed at $23 billion; by Q1 2026 an analyst frames the flagships as already in the run rate and asks instead about what replaces them. This is a topic resolving, not a topic being avoided. |
| AI as both underwriting risk and investment opportunity | emerged | Q4 2024, Q2 2025, Q4 2025, Q1 2026 | It enters in Q4 2024 as a narrow DeepSeek question about data centre demand, is a forward-looking curiosity in Q2 2025, and by Q4 2025 and Q1 2026 is the dominant Q&A theme, asked from the disintermediation side rather than the demand side. Management's disclosure has stayed at the exposure-percentage level throughout; requests for KPIs and for quantified uplift were both declined on the latest call. |
| Private credit stress and direct lending redemptions | emerged | Q3 2025, Q4 2025, Q1 2026 | Management raised it unprompted at the end of the Q3 2025 call to deny exposure to specific troubled names, and by Q1 2026 had added earnings-release pages sizing direct lending at 5% of AUM and the private BDC at 0.4%. The pattern of pre-empting rather than waiting to be asked is itself the signal here. |
| Secondaries and GP solutions | emerged | Q1 2024, Q2 2024, Q4 2025, Q1 2026 | Management said in Q1 2024 that secondaries was not a need-to-have and in Q2 2024 that it was not front and centre, then in Q4 2025 announced Arctos and a new KKR Solutions vertical targeting $100-plus billion of AUM. Management's own explanation is that it waited for the right partner rather than changing its view of the asset class. |
Guidance ledger
Quotes, calls, and speakers are source-verified; outcomes are curator-classified.
| Verbatim guidance | Call | Speaker | Curator outcome | Outcome note |
|---|---|---|---|---|
| “$300 billion-plus of new capital raised over the course of 2024 through 2026” | KKR & Co. Inc., Q2 2024 Earnings Call, Jul 31, 2024 · 2024-07-31T14:00:00 | Robert Lewin | pending | Reiterated repeatedly since. On the Q4 2025 call management said over $240 billion had been raised, or over 80% of the target, and on the Q1 2026 call said it continues to feel very confident it can exceed the fundraising target. The 2024-2026 window is not closed within the supplied call history. |
| “by 2026, $4.50-plus per share of FRE, $7-plus per share of total operating earnings, and between $7 and $8 of adjusted net income per share” | KKR & Co. Inc., Q2 2024 Earnings Call, Jul 31, 2024 · 2024-07-31T14:00:00 | Robert Lewin | pending | The three metrics have diverged. FRE per share has been reaffirmed and management expects to exceed it. The total operating earnings target was explicitly de-emphasised on the Q3 2025 call as less relevant given the insurance cash-accounting choice. The ANI target was guided below on the Q1 2026 call. |
| “we've got a pretty good amount of visibility into Q4 right now, so call it plus or minus $500 million of monetization-related revenue” | KKR & Co. Inc., Q3 2024 Earnings Call, Oct 24, 2024 · 2024-10-24T14:00:00 | Robert Lewin | kept | The Q4 2024 call reported realized performance income of $676 million and realized investment income of $110 million, for total monetization activity of $786 million. |
| “We do see our monetizations up in 2025 relative to 2024” | KKR & Co. Inc., Q4 2024 Earnings Call, Feb 04, 2025 · 2025-02-04T15:00:00 | Robert Lewin | kept | The Q4 2025 call reported $2.7 billion of gross monetization activity for 2025 excluding the carried interest repayment obligation, with gross realized carried interest up approximately 30% year-on-year. |
| “we are increasing our guidance for Strategic Holdings operating earnings that we introduced roughly a year ago by $50 million in 2026 to $350-plus million” | KKR & Co. Inc., Q4 2024 Earnings Call, Feb 04, 2025 · 2025-02-04T15:00:00 | Robert Lewin | pending | Reaffirmed on every subsequent call. Q1 2026 reported $48 million for the quarter with management saying it continues to track toward the $350-plus million figure and that earnings will be back-end weighted over the year. |
| “Of that $800-plus million, we expect at least $250 million to be generated in Q2.” | KKR & Co. Inc., Q1 2025 Earnings Call, May 01, 2025 · 2025-05-01T13:00:00 | Robert Lewin | kept | The Q2 2025 call reported realized performance income of $419 million and realized investment income of $154 million. |
| “I would expect insurance operating earnings to stay in that $250 million plus or minus level during the next few quarters.” | KKR & Co. Inc., Q1 2025 Earnings Call, May 01, 2025 · 2025-05-01T13:00:00 | Robert Lewin | kept | Reported insurance segment operating earnings were $278 million in Q2 2025, $305 million in Q3 2025 including a $41 million actuarial benefit, and $268 million in Q4 2025 — at or modestly above the guided level in each quarter. |
| “We have direct line of sight to north of $800 million of monetization-related revenue, the vast majority of which will be performance income.” | KKR & Co. Inc., Q2 2025 Earnings Call, Jul 31, 2025 · 2025-07-31T13:00:00 | Robert Lewin | kept | The Q3 2025 call reported realized performance and investment income of $935 million within Asset Management plus $70 million of net realized investment income in Strategic Holdings. |
| “we expect net realized performance income in Q4 to be lower than it otherwise would have been, and ANI per share to be about $0.18 lower” | KKR & Co. Inc., Q3 2025 Earnings Call, Nov 07, 2025 · 2025-11-07T14:00:00 | Robert Lewin | kept | The Q4 2025 call reported ANI of $1.12 per share including the carried interest repayment obligation and $1.30 per share excluding it. |
| “we feel confident that we can achieve the $7-plus per share, and that includes the impact of our cash-based reporting approach for Global Atlantic” | KKR & Co. Inc., Q3 2025 Earnings Call, Nov 07, 2025 · 2025-11-07T14:00:00 | Robert Lewin | pending | Reaffirmed with a deterioration caveat on the Q4 2025 call. On the Q1 2026 call management said it is more likely to land below $7. The 2026 year is not complete within the supplied call history. |
| “We continue to think that the right level to model the business is in that 250-plus range per quarter over the next 4 quarters.” | KKR & Co. Inc., Q4 2025 Earnings Call, Feb 05, 2026 · 2026-02-05T14:00:00 | Robert Lewin | pending | One quarter has elapsed within the supplied history: Q1 2026 insurance segment operating earnings were $260 million, consistent with the guided level. |
| “that represents over $1.2 billion of gross monetization revenue for KKR” | KKR & Co. Inc., Q1 2026 Earnings Call, May 05, 2026 · 2026-05-05T14:00:00 | Robert Lewin | pending | Described by management as the largest forward monetization figure discussed on a call in the firm's history. No subsequent call exists in the supplied index against which to test it. |
| “if you were handicapping our ability to reach $7 per share, we do think it is more likely that we land below that level” | KKR & Co. Inc., Q1 2026 Earnings Call, May 05, 2026 · 2026-05-05T14:00:00 | Robert Lewin | pending | This is the first downward revision to the ANI target in the supplied history. Management said any delayed monetizations would shift to 2027 and beyond rather than being lost. No later call is available to test that. |
Q&A pressure map
Question counts and firms are curator tallies; analyst coverage shown above.
| Topic | Questions | Firms | Pressure / response |
|---|---|---|---|
| Insurance / Global Atlantic earnings power and ROE | 24 | BofA Securities, Evercore ISI, Barclays, TD Cowen, Wolfe Research, Morgan Stanley, Autonomous Research, Jefferies, Deutsche Bank, KBW, Piper Sandler, BNP Paribas, HSBC | The most persistently pressed topic in the index, present on all twelve calls. Analysts keep returning to one question - what is the normalized ROE and when is it reached - and it has not been answered with a number. On the Q3 2025 call management said there is no explicit target beyond moving all-in returns from high teens to north of 20; on the Q1 2026 call the same question drew a mark-adjusted run rate and a pointer to the disclosure page. Everything else about this business is disclosed generously, which makes the gap conspicuous. |
| Monetization visibility and realization timing | 19 | Evercore ISI, Autonomous Research, Jefferies, Barclays, Deutsche Bank, Citizens JMP Securities, BMO Capital Markets, UBS Investment Bank | Present on eleven of twelve calls, usually as a request for the visible pipeline figure. Management has answered this one specifically and consistently, quarter after quarter, and the figures have generally been met or exceeded. That track record is the main reason the Q1 2026 walk-back on the annual target reads as a timing statement rather than a credibility problem. |
| Private wealth, K-Series and the Capital Group partnership | 17 | Evercore ISI, BNP Paribas, Wells Fargo Securities, BofA Securities, Goldman Sachs, Autonomous Research, Jefferies, TD Cowen, Wolfe Research, Piper Sandler | Sustained questioning about platform additions, product design and eventual 401(k) access, spread across ten of the twelve calls. Answers have been detailed on process and have consistently declined to forecast flows, with management repeating that it does not read into month-to-month sales - which is why the Q1 2026 statement that a Q2 slowdown is expected stands out. |
| Asset-based finance and private credit scale | 16 | Goldman Sachs, Morgan Stanley, Evercore ISI, TD Cowen, Wolfe Research, Barclays, Wells Fargo Securities, BNP Paribas, Piper Sandler | Consistent questioning on origination capacity, bank retrenchment and whether scale erodes returns. The character shifted on the most recent call from growth runway to redemptions and institutional appetite. |
| Capital markets revenue run rate | 14 | KBW, Wolfe Research, Citizens JMP Securities, Deutsche Bank, BofA Securities, TD Cowen, Jefferies, Barclays | A recurring topic through Q3 2025 and then entirely absent from the last two calls. Management's standing answer was that the business is not one to evaluate quarterly and that the 2021 revenue level is beatable; reported quarterly fees have since settled at $225 million and $224 million, which is the most likely reason the questions stopped. |
| 2026 guidance building blocks | 11 | KBW, Deutsche Bank, Goldman Sachs, Barclays, Citizens JMP Securities, TD Cowen | On the Q3 2025 call an analyst asked, in the same breath as an insurance question, what expense-side mitigants exist if the $7 target is missed. The reply covered insurance ROE and reaffirmed the target but never addressed the expense question. That was the one point in the sequence where the shortfall scenario was raised in advance, and it went unanswered. |
| AI exposure and disintermediation risk | 8 | Evercore ISI, Morgan Stanley, TD Cowen, Wolfe Research, Autonomous Research | Enters as a single DeepSeek question in Q4 2024 and is concentrated in the two most recent calls. Management has answered with exposure percentages, portfolio-scrub assurances and value-creation anecdotes; two direct requests on the Q1 2026 call - for KPIs and for a quantified revenue-versus-cost split - were both declined. |
Language shifts
Only language evidence verified against the referenced component is shown.
| Observation | Verbatim evidence | Call ID | Component |
|---|---|---|---|
| The hedging on 2026 earnings tightened in one step. The Q3 2025 language was unreserved confidence in the ANI target; Q4 2025 added a conditional about environment deterioration; Q1 2026 states reduced visibility outright and guides below the number. | “we do have modestly less visibility today than what our budget would have suggested at this point in the year” | 1993116377 | 2 |
| New vocabulary that enters in Q3 2025 and then recurs: the Q4 2025 prepared remarks say the firm is seeing much greater bifurcation across the industry, and the Q1 2026 Q&A calls it extreme bifurcation. The words do work — they let relative outperformance stand in for absolute results in a weaker environment. | “I think the 2 keywords are dispersion and bifurcation.” | 1962925140 | 34 |
| The perception-versus-reality frame has hardened. In Q2 2024 the closing note was simply that the market is open and the firm is active. By Q1 2026 the prepared remarks are built around a slide deck comparing operating metrics to the share price, and end by telling listeners not to trust the headlines. | “The fact is perception of the volatility of our business and industry is disconnected from the lived experience and that's okay.” | 1993116377 | 3 |
| Management retired an Investor Day target in-flight — the 2026 total operating earnings figure — on the grounds that its own insurance accounting choice made the metric less comparable. The reasoning is disclosed and internally consistent, but it is a target being reframed rather than met or missed. | “It's just not a metric as relevant to '26 guidance given this dynamic.” | 1962925140 | 9 |
| First explicit forward caution on wealth flows in the supplied history. Prior quarters consistently described K-Series activity as at or ahead of expectations without a forward qualifier. | “Given all the market noise, we were candidly surprised by the strength of flows in Q1. But we also do expect a slowdown in Q2, consistent with what we saw after the tariff announcements last year.” | 1993116377 | 2 |
| Insurance commentary shifted from opportunity to discipline. Management describes pulling back on origination and being more selective, where earlier calls described leaning in, elongating liabilities and adding alternatives. The competitive pressure is presented as cyclical and the firm points to $6 billion of dry powder equity as the way it intends to benefit when spreads widen. | “In the first quarter, we continued to see increased levels of competition here, particularly in the retail channel.” | 1993116377 | 2 |
Twelve calls show an operating story that has compounded with unusual consistency and a disclosure posture that keeps moving the measuring stick — the 2026 total operating earnings target retired in-flight, the insurance ROE question asked in most quarters and never answered with a number, and now the ANI target guided below not long after being reaffirmed. The fee engine is not really in dispute; what the call history sharpens is how much credit to extend to management's framing that the delayed monetizations are timing rather than value.
Competitors describe KKR & Co. Inc.'s market in their own filings and calls. These verified passages and visual pages show where their strategies meet, using source documents preserved in Sources.
Blackstone (BX)
The largest alternative manager and KKR's broadest head-to-head rival across private equity, credit, infrastructure, real estate and the private-wealth channel. Blackstone is also where the sharpest strategic contrast with KKR sits: management repeatedly presents its decision not to own an insurer - versus KKR's ownership of Global Atlantic - as a competitive advantage in the same insurance-capital market.
Blackstone's stated position in third-party credit and its explicit strategic fork on insurance - managing money for insurers rather than owning one, the opposite of KKR's Global Atlantic model - sized against a $40 trillion global insurance market.
Jonathan D. Gray, President and Chief Operating Officer: Blackstone has built the largest third-party focused credit business in the world with $484 billion across corporate and real estate credit, up threefold in the past 5 years. Over the same period, revenue from this platform has increased more than fourfold. […] The scale and breadth of our platform, distinctive origination capabilities, connectivity with borrowers across the market and our open architecture multi-client model in the insurance channel are significant advantages. In insurance specifically, our decision to be an asset manager for insurance companies rather than becoming one positions us well to address the $40 trillion global insurance market. Today, we manage over $250 billion on behalf of insurers across private credit, liquid credit and other strategies, up 20% yearover-year.
p. 2 · Read in context →
Blackstone's cited share claim in the private-wealth channel KKR is scaling into with K-Series: an estimated 50% of private wealth revenue across the major alternative firms, on $43 billion of 2025 wealth fundraising. The 50% figure is attributed to third-party analyst research, not to Blackstone's own measurement.
Blackstone management, Q4 and full-year 2025 earnings call: Of particular note, our fundraising in private wealth increased 53% year over year in 2025 to $43 billion. And we expect strong inflows again in 2026 given our performance and continuous innovation. According to recent analyst research, Blackstone Inc. has an estimated 50% share of all private wealth revenue across the major alternative firms. In total, the firm's fundraising success lifted assets under management 13% year over year to a new industry record of nearly $1.3 trillion.
p. 1 · Read in context →
Answering an analyst question on whether banks are becoming more competitive in direct lending and what that does to spreads. Gray characterises bank-versus-direct-lending choice as a constant, then argues few managers can offer insurers an 'open architecture' model without competing with them - a claim aimed at owner-operators of insurance balance sheets such as KKR and Apollo.
Jonathan Gray, President and Chief Operating Officer: So on banks, the banks I think are feeling healthy. They are in the marketplace. There is this sort of constant set of choices—should you do a bank-led deal or direct lending deal. That's been going on for a long time. And even for us on the private equity side, each deal is a little bit different. So to me, that dynamic is a little more of a constant. I would point out one of the benefits of the market is getting better as deal volume goes up. So you need, I think, both the private credit and the bank market because I do expect that volumes certainly next year in the deal business will go up, which creates a healthier supply-demand balance for capital. On the insurance front, there, it's pretty limited in terms of the number of people with an open architecture model not competing in the insurance space and who can do this at real scale. And that, I think, has been very beneficial for us. I think that's why you continue to see our rapid growth. I would say the momentum we have in our insurance business is pretty exceptional today.
p. 11 · Read in context →
Apollo Global Management (APO)
The closest structural mirror to KKR: a credit-led asset manager bolted to a wholly owned annuity writer (Athene) the way KKR is bolted to Global Atlantic, with the same two-engine model of fee-related earnings plus spread. Apollo competes with KKR for the same origination, the same retirement liabilities and the same wealth and 401(k) allocations.
Apollo's own definition of the private-credit market it and KKR both address - recasting it from the widely cited $2 trillion of levered lending to roughly $40 trillion once investment-grade private credit is included. This is Apollo's framing of the TAM, not an independent estimate.
Marc Rowan, Chief Executive Officer: Let me flip now to discuss private credit. The press remains fixated on a $2 trillion slice of this market, which should properly be called levered lending. Most of the financial press treats this as the entire story of what's happening in private markets, and it is far from it. The investment-grade private credit market, which is being driven by the global industrial renaissance, is a $38 trillion market. Therefore, the total opportunity in private credit is some $40 trillion. The obsession with this very narrow corner, the $2 trillion slice of levered lending, is frankly a failure of imagination.
p. 1 · Read in context →
Apollo on pricing conditions in the annuity market where Athene competes with KKR's Global Atlantic: $82 billion of 2025 organic origination, and a claim that rivals wrote business in Q1 at 'ridiculously low spreads' - Apollo's characterisation of competitor behaviour.
Marc Rowan, Chief Executive Officer: Enough on asset management for the moment; let's flip to Retirement Services. There is significant demand for guaranteed lifetime income and for retirement income in all forms. The global retirement crisis gets clearer day by day, and we believe this is one of the biggest secular opportunities out there. Against that backdrop, we tap a portion of this market through Athene. 2025 was a record year with $82 billion of organic origination, and we expect and plan to do more in 2026. In Q1, we saw lots of competition, in our view irrational competition, with people putting business on the books at ridiculously low spreads. We did the business we wanted to do and not more. Fortunately, we had a very strong and rich origination pipeline, which allowed us to continue to preserve spread against this competitive backdrop.
p. 4 · Read in context →
The competition disclosure in Apollo's FY2025 annual report, which maps the demand pools it is chasing into six markets - institutional alternatives, individuals, insurance, traditional asset managers, fixed-income/equity replacement and defined contribution/401(k) - the same list KKR's growth plan runs through, plus Athene's stated 'leading presence' claim in retirement services.
Within the asset management business, Apollo operates in an intensely competitive industry, and expects it to remain so. We compete globally and on a regional, industry and niche basis. We face competition both in the pursuit of investor capital and in making investments on behalf of funds and accounts we manage across credit and equity asset classes. […] We have seen capital demand increasing over six discrete markets on a global basis: institutional investor alternative allocations, individuals, insurance, traditional asset managers, institutional investors for fixed income and equity replacement, and defined contribution/401(k). With the growing demand for capital, we expect the composition of competition may shift and evolve over time. […] Athene believes that its leading presence in the retirement services market, diverse range of capabilities and broad distribution network uniquely position it to effectively serve consumers' increasing demand for retirement solutions.
p. 25 · Read in context →
Ares Management (ARES)
The scale rival in credit, which is KKR's largest asset-management pool, and a fast-moving competitor in the same semi-liquid wealth products. Ares describes itself as one of the largest self-originating direct lenders in the US and Europe, and it publishes its own market-share position in the wealth channel KKR is building out.
Ares' stated share position in the private-wealth channel - a self-described top-5 placing with market share 'approaching 10%' across eight semi-liquid perpetual products - the same distribution contest KKR's K-Series vehicles are in. Share figure is Ares' own estimate.
Michael J. Arougheti, Chief Executive Officer: In the wealth channel, we continue to benefit from our top 5 leadership position with an estimated market share approaching 10%. Our momentum remains strong with our fundraising for the first half of the year totaling $7 billion in equity commitments, a 54% increase over the first half of 2024. AUM across our eight semi liquid products crossed $50 billion, and now seven of our eight products are over $1 billion with our eighth product launched in June, seeing early traction and well on its way. We believe that we have one of the broadest product sets in the market with eight semi-liquid perpetual products spanning credit, private equity, real estate, infrastructure and sports, media and entertainment. […] Importantly, we conducted business with over 1,300 new financial advisers in the quarter, which is up over 200% from a year ago and illustrates our progress penetrating new financial advisers within existing channels as more investors adopt alternative investments.
p. 2 · Read in context →
Ares' sizing of dry powder in private credit and its argument that the asset class has grown only in line with the $5 trillion private equity sector. Offered as a rebuttal to concerns about private-credit expansion, so it is advocacy as well as measurement.
Michael J. Arougheti, Chief Executive Officer: For example, if you look over the last 25 years, U.S. private credit has contracted once, which was over 10 years ago, versus the banking sector, which has contracted eight times over the same period. Today, Ares Management Corporation has over 100 billion dollars in available capital to invest in credit, and we estimate that the industry has over 500 billion dollars of available capital, which is larger than the size of the entire non-traded BDC industry. While private credit has expanded at low double-digit rates over the past decade, this growth tracks in line with the growth of the 5 trillion dollar private equity sector and other private market asset classes.
p. 3 · Read in context →
Ares' FY2025 annual report describing its Credit Group scale - $406.9 billion of AUM and a claim to be one of the largest self-originating direct lenders in the US and Europe - the market where KKR's credit franchise and FS KKR compete.
Through our Credit Group, we serve as one of the largest managers of credit strategies across the non-investment grade credit universe, with $406.9 billion of AUM and over 305 funds as of December 31, 2025. […] The Credit Group is one of the largest self-originating direct lenders to the U.S. and European middle markets with a growing presence in the APAC region, offering one-stop financing solutions for small-tomedium sized companies and counterparties that we believe are increasingly underserved by traditional bank lenders.
p. 20 · Read in context →
Brookfield Asset Management (BAM)
The main rival in infrastructure and real assets, where KKR's Global Infrastructure franchise has been its fastest-growing area, and a competitor on the insurance-annuity axis through the Brookfield Wealth Solutions annuity mandate it manages - the affiliate structure that plays the role Global Atlantic plays for KKR, though Brookfield Asset Management manages the assets rather than owning the liabilities. Its calls size the 401(k) and retirement opportunity both firms are positioning for.
Brookfield's sizing of the US retirement and wealth pools - over $10 trillion in 401(k) plans and retail annuities plus another $10 trillion in private wealth - alongside its own $100 billion annuity mandate for Brookfield Wealth Solutions, the structure that parallels KKR's Global Atlantic.
Connor Teskey, President: In the U.S. alone, 401(k) plans and retail annuities now represent over $10 trillion in assets, on par with institutional pools, and private wealth clients represent another $10 trillion opportunity. A recent executive order from the U.S. administration could accelerate this shift by laying the groundwork for greater access to private strategies through workplace retirement plans. Even a modest reallocation could result in hundreds of billions to trillions of net new flows into alternatives over time. […] Brookfield Wealth, which is on track to raise over $30 billion of capital this year from private wealth and insurance annuity channels. […] At the same time, we manage approximately $100 billion and growing portfolio of annuities on behalf of Brookfield Wealth Solutions, which is designed to generate stable, attractive returns for retirement accounts.
p. 7 · Read in context →
Brookfield's claim that its infrastructure and renewable power franchise is 'the largest and most established globally', and its $7 trillion estimate for AI-related infrastructure over the next decade - the thesis behind a new AI infrastructure fund competing with KKR's infrastructure and data-centre strategies.
Connor Teskey, President: Our infrastructure and renewable power franchise is one example of this momentum. As over the past 12 months, we've raised $30 billion, deployed $30 billion and monetized over $10 billion at approximately 20% returns, demonstrating strength, scale, and consistency of our platform. Our franchise is the largest and most established globally, serving as a cornerstone of our business and a key driver of long-term growth. […] We estimate that AI-related infrastructure investments will exceed $7 trillion over the next decade. Brookfield's unique position, owning and operating across the full energy and digital infrastructure value chain gives us a tremendous advantage in capturing this opportunity.
p. 4 · Read in context →
Asked whether recent retail redemptions change its plans, Brookfield concedes private wealth is smaller for it than for peers, then claims advanced discussions with major target-date fund providers about default 401(k) portfolios and market leadership in placing real assets into annuity portfolios - both contested ground with KKR.
Connor Teskey, Chief Executive Officer: Obviously, private wealth is a smaller portion of our business relative to some of our peers. We've been very methodical and thoughtful in how we build that business for the long term. […] I would also mention the individual market. And in this regard, we think our growth and penetration of the individual market is perhaps accelerating far faster than people appreciate. […] On the 401(k) and retiree market side, we're in advanced discussions with some of the largest target date fund providers who are interested in putting Brookfield's real asset products into some of their default portfolios, they're recognizing the role that long-duration, inflation-linked cash generative, downside protected investments can play in those portfolios. And then we're certainly the market leader in terms of introducing real asset exposure into insurance policy and annuity portfolios through our partnership with BWS.
p. 13 · Read in context →
The Carlyle Group (CG)
A direct private-equity peer competing for the same large-cap buyouts, the same exit windows and the same LP dollars, now building the same credit-plus-insurance adjacency KKR has - Carlyle through its Fortitude Re partnership rather than an owned balance sheet.
Carlyle's claim to be the number one private equity sponsor globally by IPO proceeds since 2024 - a monetisation-league-table claim in the exit market where KKR's realisation pace is judged. The ranking is Carlyle's own assertion.
Harvey Schwartz, Chief Executive Officer: We closed out the year with record assets under management of $477 billion, driven by strong investment performance and robust fundraising across the platform. […] Over the last several years, a lot has been written about low levels of monetizations in the private equity industry. The Carlyle Group Inc. has proven to be an exception to that narrative. Since 2024, we have been the number one private equity sponsor globally by IPO proceeds, generating roughly $10 billion of IPO issuance over the past two years. This number is more than any other firm in our industry.
p. 1 · Read in context →
Carlyle's credit build-out, now 45% of firm AUM, including an $87 billion insurance solutions platform anchored by Fortitude Re and a $13 billion direct lending book - the partnership-based route into insurance capital, versus KKR's owned Global Atlantic.
John Redett, Chief Financial Officer: Global Credit AUM now comprises 45% of firm-wide assets and has grown at a 33% CAGR over the past 5 years. And Global Credit's FRE is now nearly 1/3 of Carlyle's total. […] Our $87 billion insurance solutions platform is anchored by our strategic partnership with Fortitude Re and has been quite active over the past few months. […] Our $13 billion direct lending platform has been growing at a 20% CAGR in the past 5 years. We believe the market opportunity for direct lending will continue to grow, and we are continuing to invest in this platform, adding resources across leadership and origination.
p. 3 · Read in context →
EQT AB (EQT)
The leading European-headquartered private markets firm, competing with KKR for European and Asian buyouts (via BPEA), for infrastructure assets, and for the same LP relationships as allocators consolidate. Its management speaks directly to industry consolidation and share shift in a way US peers generally avoid.
Answering an analyst on whether deals have become harder and LPs more cautious, EQT's CEO describes an industry that is maturing and consolidating, claims the strongest non-US presence in the sector, and says EQT is taking share in fundraising - a claim about the same LP wallet KKR raises from.
Per Franzén, Chief Executive Officer: Having said that, of course, our industry is maturing, is consolidating it's becoming more and more competitive. And this has been an evolution and a development over the last decade or longer, which is why during this time, we have just continued to invest into our alpha generating capabilities. Right? We have the strongest presence in the world outside of the US. In our target geographies, we have hundreds of investment professionals on the ground across Europe, across Asia. We have globally leading sector franchise and insights in our target sectors. […] It's more important than ever before, which is why the consolidation of our industry is continuing and is likely to accelerate, and is also why we are continuing to take market share in our fundraisers.
p. 18 · Read in context →
EQT's stated digital-and-energy infrastructure footprint - more than 90 data centres via EdgeConneX, a 100GW development pipeline and over $100 billion of enterprise value - behind a new dedicated AI infrastructure strategy, against a $4 trillion five-year investment estimate it attributes to industry sources.
Per Franzén, Chief Executive Officer: Through our ownership of EdgeConneX, EQT Infra today operates more than 90 data centres globally. On the connectivity side, 29 million miles of fibre network has been deployed globally across our portfolio and the energy companies that we that were invested in EQT Infra have a development pipeline exceeding 100GW. The enterprise value of our digital and energy assets combined today is north of $100 billion. We see global demand for AI compute and hence data centres and power consumption only accelerating. Industry estimates suggest that $4 trillion will be invested into data centres and energy infrastructure to meet this demand over the next five years. At the same time, we see bottlenecks in the form of access to power, reinforcing the need for a coordinated investment approach across digital and energy infrastructure. And this is why we're now launching a dedicated EQT AI infrastructure strategy focussed on investing in a holistic way in the physical infrastructure that AI requires.
p. 4 · Read in context →
More peer documents
Q3_FY2025 — 13 pages · Analyst asks point-blank what share alternatives will eventually take of the $12 trillion US 401(k) channel and of traditional asset management; Rowan's answer is the clearest peer view of the retirement TAM KKR is also chasing. · Open →
Q1_FY2026 — 16 pages · Blackstone's most recent quarter: record $1.3 trillion AUM, $69 billion of inflows and infrastructure cited as the strongest performer - the current scale benchmark KKR is measured against. · Open →
Q4_FY2025 — 14 pages · Ares Capital Corporation's own call (the BDC Ares manages), where management claims it more than doubled its share of financings across its top 10 incumbent borrowers - the direct-lending share contest FS KKR sits in. · Open →
Q2_FY2026 — 20 pages · EQT launches its AI Infrastructure Fund and a Scaleup Europe strategy, sizing a EUR 500 billion European scale-up funding gap - the European growth-capital ground KKR also works. · Open →
BX_annual_report_FY2025 — 285 pages · Blackstone's latest annual report: segment-level AUM, perpetual-capital disclosure and the competition risk factors that define the peer set KKR is graded within. · Open →
BAM_annual_report_FY2025 — 179 pages · Brookfield's annual report sets out fee-bearing capital by strategy and the five-year plan to roughly $1.2 trillion, the basis for its infrastructure and credit growth targets. · Open →
Q2_FY2025 — 10 pages · Carlyle details its UBS wealth partnership, nearly $30 billion of perpetual evergreen strategies and six insurance origination partnerships - the wealth and insurance channels KKR is scaling in parallel. · Open →
Q4_FY2025 — 16 pages · Zelter urges investors to look past the '2 trillion pond' of non-investment-grade private credit to a 40 trillion opportunity - the fullest statement of Apollo's market redefinition. · Open →
The answer
Does not fit the framework (P1 not met); contested: X1, X2, X3, X4, S1
P1 is the gate: year-10 revenue and year-10 adjusted free cash flow higher, with very high conviction. All four jury seats returned not met, at a 0.66 probability with a 0.10 spread, and nothing offsets a gate. Confidence is low — the tally's basis is that name-mask divergence or load-bearing probability divergence exceeded 0.20. No exclusion hit and no sensitivity flag were recorded; the watchlist-only overlay does not apply; prior-driven risk is flagged.
P1 — year-10 durability (probability)
P3d — forward yield clears bar
P5 — impairment temporary
Contested criteria
Source: the run's deterministic fit tally — trimmed-mean jury probabilities for P1 and P3d, and the adversarial trial's carried probability for P5.
KKR is a durable, growing, cash-generative franchise that has fallen 49.8% from peak to trough. The framework still says no, and it says no on durability conviction rather than on business quality: the measure the system uses to underwrite year-10 cash flow cannot be computed for this company at all, and the conviction sources that would substitute for it grade out as partial or absent. Everything below is the arithmetic behind that.
Universe and exclusions
Both universe tests are met, on three seats each with no dissent.
U1 — listing. KKR is a Delaware corporation whose common stock trades on the New York Stock Exchange under the symbol KKR, Commission File Number 001-34820 [1]. Not an ADR, not a foreign private issuer, not a Chinese issuer. The only counter-facts are historical: the listed predecessor traded on Euronext Amsterdam until the July 2010 US listing, and the firm was a Delaware limited partnership until 1 July 2018. Neither bears on the instrument screened.
U2 — scale. 891,550,894 shares outstanding at 24 February 2026 [2] at the 28 July 2026 close of $102.66 gives $91.5 billion; independent market data for the same session gives $92.18 billion. Either figure is 9.2 times the $10 billion floor. The counter-fact sits inside the same finding: fit_features.market_cap is null with the reason "no positive annual period-end or outstanding share count", so the number is reconstructed from the filed share count and the price feed rather than read off the feature file. The 10-K's own cover cross-check — $91.1 billion of common stock held by non-affiliates at 30 June 2025 — corroborates it, and a 9.2x margin absorbs any share-basis difference.
Exclusions: no hit recorded. The tally's exclusion_hits array is empty and sensitivity_flags is empty. What was checked, and what each check found:
- X1, auto OEM. KKR manufactures nothing and is classified under SIC 6282, Investment Advice. Against that: the Strategic Holdings segment held ownership stakes in 19 operating companies at 31 December 2025 in a segment the filing says is not limited to acquiring companies in specific industries [3], so an automotive holding is not structurally precluded — but the segment is 3.9% of FY2025 segment earnings [4][5] and the word "automotive" appears once in the 333-page 10-K, in a director biography [6].
- X2, promotional CEO. The test needs both prongs cited. The ownership prong fails outright: directors and executive officers hold 206,873,438 shares, 23.20% of the common stock, worth $21.2 billion at $102.66 [7], and five insiders including both co-CEOs bought $50.9 million personally between 9 February and 4 March 2026. The delivery prong is genuinely mixed — two of the three April 2024 Investor Day per-share targets have moved, the total-operating-earnings target retired in November 2025 and the $7-plus adjusted-net-income target walked down on 5 May 2026 [8] — but one prong is expressly not a hit. Full treatment in Self-Help.
- X3, structural decline.
revenue_trajectory.three_year_hsd_declineis false andconsecutive_decline_yearsis zero. Extending the same fee line through FY2025 from the filings gives a 15.6% compound rate over FY2016–FY2025 with two down years, deepest −2.8%, never consecutive. Against that: GAAP total revenues fell 11.0% in FY2025, from $21,878.7 million to $19,464.3 million, as insurance net premiums dropped from $7,898.8 million to $3,397.2 million — one year, on a line that has swung between $4.2 billion and $21.9 billion in six years. Full treatment in Durability. - X4, consensus-saturated story. The test is conjunctive: extreme multiple-to-sales and a saturated narrative. The valuation prong fails — 3.6x trailing sales against a 6.2x peer median and 35.7x trailing earnings against a 45x peer median, after a 49.8% drawdown. The narrative prong does not: 18 of 21 published ratings are buy or strong buy, none are sell, and the $123.48 mean target sits 20.3% above the price, with no target below it. Full treatment in Business and Clock.
- S1, China dependence (a sensitivity flag, never disqualifying). China investments were under 2% of total firm AUM at 31 December 2023, the only precise disclosure in the corpus [9], with Greater China at 14% of Asia-Pacific capital invested at fair value against Japan's 39%. Greater China headcount is 47 of roughly 900 Asia-Pacific employees, down from 64. The counter-fact is the vintage: that percentage is 31 months old and has not been restated in the FY2025 10-K or any later deck, and Asia-Pacific as a whole is 23.0% of asset-management revenue.
All five of these criteria are marked contested by the tally, for a reason that is about vote labels rather than about the evidence. That is set out in Contested and undetermined below.
Pattern match
KKR fits none of the four setups in the reader's pattern library cleanly.
The closest is the fourth — a quality franchise on a fear dip. The shape matches: a dated, sector-wide repricing on 3 February 2026, when the stock fell 9.69% on 4.02x median volume with no KKR filing or release on the tape; a 49.8% peak-to-trough decline from $167.07 on 31 January 2025 to $83.88 on 12 March 2026; and a fear that is specific and testable, applied to alternative managers through the marks on their software holdings. The pattern's own check is where it parts company. That precedent rests on monopoly or duopoly market structure. Alternative asset management is not one: the six largest listed managers held at least $5.08 trillion of AUM at 31 December 2025, KKR's $743.9 billion is 14.6% of that top-six pool and about 5% of the roughly $15 trillion industry pool KKR itself sizes, and KKR's own Item 1 calls the industry "intensely competitive", names no competitor and discloses no market share [10]. The trigger is also weaker than the pattern wants: the skeptic pass weakened that finding because no corpus document names a single KKR-specific headline that started the 3 February move. Full treatment in Dislocation.
The second pattern — high dividend yield plus high FCF yield — fails on both numbers: a 0.76% dividend yield and a 2.88% framework-basis adjusted yield. The first, cyclicals at the bottom, applies to large banks and does not reach here. The third, an insurance forecasting error, is the interesting near-miss: KKR owns Global Atlantic and Global Atlantic's spread economics did compress, but the market did not anchor the stock one-for-one to a guidance cut. Delivered adjusted net income per adjusted share rose from $4.70 to $4.87 across the drawdown, and the entire 38.6% peak-to-current move is multiple compression, from 35.5x trailing to 16.8x forward. Full treatment in Damage Math.
The pillar ledger
Source: the run's deterministic fit tally — per-criterion verdicts, trimmed-mean probabilities, spreads and vote splits, reproduced without adjustment.
Year-10 durability — the gate
P1: not met. Probability 0.66, spread 0.10, all four seats agreeing, the name-masked seat agreeing. The revenue leg is not the problem — year-10 revenue higher is a high-confidence call. The cash-flow leg is. The framework's adjusted FCF is free cash flow minus stock-based compensation minus the trailing five-year average of acquisition spend, and it is not_computable for KKR in every year: stock-based compensation is missing for FY2016–FY2019, and there is no complete consecutive five-year acquisition window with SBC. GAAP free cash flow cannot stand in, because KKR's consolidated operating cash flow of $477.8 million in FY2025 is struck after $(42,904.1) million of investment purchases and $33,698.2 million of proceeds belonging to its funds [11].
With the measure unavailable, the gate falls to the five conviction sources, and they grade out as follows. Market structure: a six-firm oligopoly, KKR at 14.6% of the top-six AUM pool, the largest member at 25.6% — concentrated, not monopoly or duopoly. Regulatory entry barriers: real, but they sit in insurance, which produced $1,109.4 million of $4,985.8 million of total operating earnings, 22.2% [12]; the 77% that comes from asset management rests on Investment Advisers Act registration, a compliance regime rather than a licence a regulator withholds. Capital intensity: absent from the fee engine — FY2025 purchases of fixed assets were $160.8 million [13] against management fees of $4,100.8 million [14], 3.9%. Operating history: 50 years at the firm level, but Global Atlantic has been consolidated only since February 2021 and Strategic Holdings has been a reported segment only since the first quarter of 2024, and together they generated 60% of FY2025 revenue.
Here is the decisive point, and its counter-fact belongs in the same breath. The strongest year-10 evidence KKR has is contractual, not competitive: approximately 92% of AUM has a duration of at least eight years at inception or is perpetual [15], which on $743,858 million of AUM is $684.4 billion locked for eight years or more, with a further $118,433 million of uncalled commitments not yet paying fees [16]. Management fees rose from $1,248.5 million in FY2019 to $4,100.8 million in FY2025 and fee-related earnings from $1,080.3 million to $3,714.3 million with no down year. An eight-year lock is a floor under the first eight years of a ten-year question; year nine and year ten depend on re-upping in an industry the company itself calls intensely competitive. That is the gap between "very likely" and "very high conviction", and the gate resolves genuine doubt to not met by construction. The tally records the applied rule as "P1 not_met -> does_not_fit (gate; nothing offsets it)", and it is the only rule the combining logic needed to reach the verdict — though P4b's rising share count is separately marked a hard fail in the spec and would have carried the same result on its own. Full treatment in Durability.
FCF consistency
P2: cannot be determined. All four seats, unanimously. fit_features.fcf_stability.rolling_5y_avg is an empty array, cv_of_rolling_avg is null, and adjusted FCF is null in every year. Only four FCF observations exist in the feature file at all — FY2016 through FY2019, every one of them negative — and they are negative for the same structural reason: consolidated-fund deployment runs through operating cash flow. Reported free cash flow swings from negative $7.28 billion in FY2021 to positive $6.51 billion in FY2024 to positive $0.32 billion in FY2025 purely on that mechanism.
The nearest defensible substitute points the other way, and it should be stated as plainly as the gap. KKR's own after-tax distributable earnings, renamed Adjusted Net Income from FY2024, run $1,613.1m, $1,768.8m, $3,916.1m, $3,512.3m, $3,040.1m, $4,202.3m and $4,377.5m for FY2019–FY2025 — no negative year, and rolling five-year averages rising monotonically from $2,770.1m to $3,287.9m to $3,809.6m. The counter-facts: the measure is management-defined, it is struck before the framework's stock-based-compensation deduction of $722.1 million [17] and before acquisition spend, and the underlying annual series still fell 22.4% from FY2021 to FY2023 as realizations slowed. A substitute is not the test, and the tally records the test as unrun rather than passed.
Dislocation and yield
P3a, identifiable event: met. Four seats. The adverse window is dated by the 3 February to 12 March 2026 price and volume break — 3 February 2026 closed at $103.28, down 9.69% on 11,502,705 shares, 4.02x the 2,863,900-share pre-peak median — and by contemporaneous peer discussion of AI and software pressure. The skeptic weakened the claim to exactly that formulation: the corpus does not identify a single KKR-specific headline that started the move, and KKR's own guidance walk-down came later, on 5 May 2026.
P3b, capitulation: met. Four seats. The measured volume spike is 3.93x the trailing median against the framework's 2x reference line — the highest 20-session average volume inside the fall leg, 11,243,613 shares in the window ending 3 March 2026, against a 2,863,900-share median for the 180 days before the peak. The counter-fact is duration: that window ends nine days before the closing low, monthly volume fell back to 1.66x by April and 1.14x by July 2026, and a second 16.0% decline from 22 April to 29 June 2026 came on 1.6x volume — drift, not a second capitulation. Full treatment in Dislocation.
P3c, yield versus the bar: not met. Four seats. Net recourse debt of $4,445.4 million at 0.75x Adjusted EBITDA (1.41x including Global Atlantic's notes) places KKR in the moderate class, which selects the 10% reference line rather than the 8–9% fortress line or the 25% levered line.
Source: derived from the filed segment measures — Adjusted Net Income less equity-based compensation less the five-year average of acquisition spend, over market value at the 28 July 2026 close; components from the FY2025 10-K [18] and the Q1 FY2026 10-Q [19].
The arithmetic: FY2025 Adjusted Net Income of $4,377.5 million less equity-based compensation of $722.1 million less a five-year average acquisition spend of $986.6 million gives $2,668.8 million, which over a $92,544.1 million market value is 2.88%. On the twelve months to 31 March 2026 the same construction gives 3.13%; on the three-year average, 2.58%. The shortfalls against the 10% line are 712, 687 and 742 basis points. Normalizing the cyclical block — realized carried interest and realized investment income, whose five-year average sits $522.2 million above the FY2025 figure — lifts the yield only to a range of 2.96% to 3.33%, because the recurring block is at a record rather than depressed. Nor is this the fortress signature of a yield that has suddenly jumped: KKR's own six-year framework-basis history runs 4.06%, 5.01%, 5.68%, 2.70%, 1.89%, 2.33%, a 3.38% median, and the current 3.13% is 0.93x that median against a 2x jump threshold.
The counter-fact is that the denominator, not the numerator, is what makes the yield small. Q1 2026 fee-related earnings of $1,016.4 million were up 23.6% on Q1 2025's $822.6 million and total operating earnings up 19.1% [20]. The yield is low because the price is high relative to earnings, not because earnings fell. Full treatment in Yield.
P3d, forward path: not met. Probability 0.125, spread 0.12, four seats. Consensus normalized EPS of $6.12 for FY2026, $7.35 for FY2027 and $8.60 for FY2028 implies framework-basis yields at $102.66 of 4.11%, 5.31% and 6.53% after deducting $1.900 per share of equity-based compensation and acquisition spend. Consensus does not clear the bar on any forecast year available, so the framework's consensus-backed route is closed and the case would have to underwrite mean reversion explicitly. The counter-fact is a price statement rather than an earnings one: at the 12 March 2026 trough of $83.88, unadjusted FY2028 consensus EPS of $8.60 was a 10.25% yield, and the whole gap between that and 6.53% is the $1.90 of deductions the framework makes and the street does not, plus the 22.4% recovery since the trough.
Balance sheet and self-help
P4a, balance sheet: met. Four seats. Nothing in KKR's $13,145.0 million of corporate debt principal matures inside twelve months, 78.3% falls due after five years [21], and cash and short-term investments of $4,789.7 million [22] plus $4,241.6 million of undrawn revolvers [23] give $9,031.3 million of liquidity. Year-one interest of $673.6 million is covered 5.5 times by fee-related earnings alone. The counter-fact is what the firm did with the drawdown year: it raised capital rather than returning it, issuing $2,543.4 million of Series D mandatory convertible preferred in March 2025 [24] and carrying $10,482.2 million of unfunded commitments to its own funds [25].
P4b, repurchase engine: not met, and this is the criterion the spec marks a hard fail rather than a scaled shortfall. Basic weighted-average shares rose from 545,096,999 in 2019 [26] to 890,342,060 in 2025, 8.5% a year; diluted from 557,687,512 to 955,756,926, 9.4% a year [27]. Executed repurchases across the eight years 2018–2025 total $1,401 million of cash, 1.5% of today's market value, or 0.19% a year, with FY2024 at nil and FY2025 at $3.4 million [28]. The absurdity check the framework applies runs the wrong way: at $102.66, retiring the entire share count takes 25.0 years of adjusted cash earnings ($91,527 million over $3,660.5 million), 20.9 years on unadjusted Adjusted Net Income, and 96 years at the fastest repurchase pace KKR has ever run — against a roughly three-year reference for a price that cannot survive. The levered exception is unavailable on all three of its legs: at 1.40x net debt to Adjusted EBITDA on the corporate-debt perimeter, or 1.41x on the carrying-value basis used in the yield computation, the balance sheet is moderate rather than levered; the implied adjusted yield is about 4.0% against the 25% the exception requires, and the share count is rising rather than falling.
The counter-fact is a genuine change of behaviour, not a rounding error. In Q1 2026 KKR repurchased 2,173,970 shares against 578 equity awards retired — the first quarter in the record where open-market buying dominates award retirement — and had spent $317 million through 1 May 2026 [29] at an average of about $91, some 11.4% below the 28 July close. The board added a $500 million automatic increment, leaving approximately $122 million remaining at 1 May 2026 [30]. Even so, weighted-average basic shares still rose 0.33% year-over-year in Q1 2026, and $122 million of remaining authorization is 0.13% of market value against a $500 million top-up worth 0.55%. Full treatment in Self-Help.
P4c, dividend cover: not applicable. Four seats. At $0.78 a share against the $102.66 close the yield is 0.76%, so the dividend carries no weight in the return case either way. The coverage arithmetic is recorded regardless: $649.9 million paid in FY2025 [31] is 17.8% of adjusted cash earnings, on a policy raised in each of the last five years, from the $0.62 a share announced in February 2022 [32] to $0.78 for 2026 [33].
Diagnosis
P5: met, at a probability of 0.76 with a spread of 0.10, carried from the adversarial trial and not re-elicited by the jury. Three order-randomised judges returned 0.76, 0.66 and 0.76; the mean is 0.727, the temporary-first seat averaged 0.76 and the permanent-first seats 0.71, an order gap of 0.05, and the trial records the ruling as not contested. The deciding evidence was the FY2025 segment table, where recurring operating earnings rose while the entire deceleration sat in the investing line: fee-related earnings $3,267,796 thousand to $3,714,313 thousand, up 13.7%, and total operating earnings $4,358,553 thousand to $4,985,804 thousand, up 14.4% [34].
Two facts belong beside that ruling. First, the permanent side's best-verified evidence — Global Atlantic's admitted return-on-equity compression, in a segment worth 22% of operating earnings — is why one seat recorded the probability stopping well short of 0.9. Second, the trial's own quote-check found failures on both sides: the permanent brief's Level III exhibit verified on figures but not on its attributed quote and omitted offsetting context on the same page, its rebuttal exhibit was discredited at two seats because pre-tax income rose 21.1% to $7,099,160 thousand on flat tax expense while net income fell on noncontrolling-interest attribution [35], and the temporary brief's forward-monetization quotes were cited to page 3 when they sit on page 4 [36]. Full treatment in Damage Math.
A temporary diagnosis does not offset the gate. It is the reason this name is worth understanding rather than dismissing, and it changes nothing about P1.
Instrument context
I1: not verifiable. Four seats. The tab-level finding is that listed KKR options extended to 21 January 2028 (541 days, 17.8 months) and 17 December 2027 at the 28 July 2026 close, with 30-day mean implied volatility of 41.5% — inside the framework's up-to-50-to-55 reference band and short of the 18-month target by seven days. The skeptic could not verify any of it: every evidence reference is a web source and this phase runs corpus-only, with no local options chain, long-dated open-interest or implied-volatility file. The jury therefore recorded not_verifiable rather than exists, and because the framework's watchlist-only overlay attaches only to a fits or leans-fit verdict, it does not apply here — watchlist_only is false in the tally. Full treatment in Clock.
What a 3x-in-3-years would require
The tally records the re-rating arithmetic as unavailable. Its re_rating_math block carries a null bar, null normalized adjusted FCF, null implied market cap at bar and null upside, with the note: "Re-rating math unavailable because the applicable bar or normalized adjusted FCF is missing." That is a direct consequence of fit_features.adjusted_fcf, adjusted_fcf_yield, yield_baseline, balance_sheet_class and market_cap all returning not_computable.
What the surviving claims do carry is the price side of the same test, computed from the filed segment measures rather than from the feature file.
Source: derived from the filed segment measures and CapIQ consensus normalized EPS (vintage 29 July 2026); earnings components from the FY2025 10-K [37].
On the mid-cycle normalization the 10% line sits at $34.23 or $30.42 a share, 67% to 70% below the current price and 59% to 64% below the 12 March 2026 trough. On FY2028 consensus the framework-basis 10% price is $67.00, 34.7% below today and 20.1% below the trough; on the unadjusted headline it is $86.00. Reaching 10% at $102.66 instead of by a lower price would take FY2028 framework EPS of $10.27, equivalent to headline EPS of $12.17 — 41.5% above the $8.60 consensus mean and 32.2% above the $9.20 consensus high.
The target test, stated as arithmetic rather than as a recommendation: three times $102.66 is $307.98 within three years. At the FY2028 consensus framework EPS of $6.700 that is 46.0x; on the unadjusted headline EPS of $8.60 it is 35.8x, which is approximately the 35.5x trailing multiple the stock carried at its January 2025 peak. So a 3x in three years is a claim that the January 2025 multiple returns in full and consensus is delivered on top of it.
The base rates come from this name's own record. Five completed NYSE-era drawdowns of 25% or more ran 33.9% to 57.7% deep, with a median of 47.7%, a median 14.5 months from trough back to the prior peak, and a median 22.3-month round trip; the slowest, 2014–16, took 28.7 months from trough to recovery and 53.3 months peak to peak. The current episode is the second deepest at 49.8% and took 13.3 months to reach its low. Those are round-trip base rates: regaining the $167.07 peak from $102.66 is +62.7%, not +200%. Full treatment in Clock.
Contested and undetermined
Contested: X1, X2, X3, X4 and S1 — all five exclusion criteria, and no pillar criterion. Three seats voted on each, and the split is identical across all five: seat A returned not_met, seat B returned no_hit, seat C returned met. Cross-family agreement is recorded as false on each, and the name-masked seat differed from the named seats on X1 through X4, which is what carries the prior_driven_risk flag and the low confidence tier.
Both readings, from the dockets. The first reading is that the exclusion test is not satisfied — seat A's not_met and seat B's no_hit say the same thing in different words. The second reading is seat C's met, which its written basis uses to mean the screen is passed, not that the exclusion fires: on X4 it records "the extreme-multiple prong is not met"; on X2, "the weak-ownership prong is absent"; on X1, "the theoretical Strategic Holdings route names no auto OEM and is only 3.9% of segment earnings". Read as prose, the three seats reach the same conclusion in three vocabularies. Read as verdict labels, they disagree, and the deterministic tally compares labels. The tally's own exclusion_hits array is empty; the contested marking and the confidence downgrade it drives stand as recorded, and neither is adjusted here.
Undetermined: P2, unanimously, with the missing datapoint named by every seat. In each juror's own words:
Seat A — fit_features.fcf_stability.rolling_5y_avg — empty; requires stock-based compensation for FY2016-FY2019 and a complete consecutive five-year acquisition window to build the adjusted-FCF series at all.
Seat B — a consecutive five-year adjusted-FCF series — fit_features.fcf_stability.rolling_5y_avg is empty and adjusted_fcf is null in every year (SBC missing FY2016-FY2019; no complete five-year acquisition window with SBC)
Seat C — rolling 5-year adjusted FCF stability series, including complete SBC and acquisition inputs
Seat D — five consecutive years of framework adjusted FCF and rolling-average volatility
Masked seat — Five consecutive fiscal years of adjusted FCF (FCF minus SBC minus trailing 5-year average acquisitions) — SBC for FY2016-FY2019 and a complete consecutive five-year acquisition window are absent, so fit_features.fcf_stability has an empty rolling_5y_avg and a null CV.
I1 is recorded as not_verifiable rather than undetermined, for the reason given above: a citable in-corpus options source giving listed expiries of at least 12 months, contract-level open interest and spreads, and a dated implied volatility does not exist in this run's corpus.
Provenance
Source: the run's deterministic fit tally (jury composition, agreement, spreads, mask divergence, skeptic counts) and the adversarial trial tally (order stability).
Two model families sat on the jury and agreed on every criterion that decides the verdict, including the gate; they disagreed only on how to label five exclusion criteria whose written reasoning matches. The verdict was pressed harder than the confidence tier suggests — but the tier is computed from label agreement, not from reasoning, and a masked seat that diverges on four criteria is precisely what the framework treats as a signal that the answer may be running on priors rather than on evidence. Two specific findings did not survive intact: the 3 February 2026 trigger was weakened to a dated price-and-volume window with an unsourced proximate headline, and the entire instrument-context finding was recorded unverifiable because its sources are external to the corpus.
The falsifier ledger
These are the standing conditions under which the run's reading would have to change. Thresholds, direction and window are as recorded.
Name-specific conditions, with their thresholds and windows.
- Fee engine. FRE per share falls below $1.13 for two consecutive quarters (Q2'26/Q3'26), or FPAUM declines sequentially from $615bn — the recurring engine, which grew +13.7% in FY2025 and +23% per share in Q1'26, would then be compressing rather than the multiple.
- Embedded gains. Total embedded gains fall below ~$15bn by 4Q'26 results without a commensurate rise in realized carry - meaning the $18.3bn reservoir is being written down at DCF-heavy Level III marks (55% PE / 91% real assets) rather than harvested, which would simultaneously validate the permanent side's valuation-sensitivity exhibit.
- Insurance. Insurance operating earnings decline year-over-year, or Global Atlantic requires a capital raise, ratings action, or material surrender/recapture event - turning the conceded, management-labelled-cyclical spread compression into a realized structural ROE reset in the 22%-of-operating-earnings segment.
- Realizations. FY2027 gross realized carry fails to exceed FY2026's despite the >$1.2bn signed forward pipeline, i.e. 'delayed monetizations… would not be lost… shift to 2027 and beyond' proves untrue - two consecutive realization-drought years with no catch-up.
- Fundraising. New capital raised over the four quarters to 1Q'27 falls below ~$100bn versus the verified $129bn record — the only clean read on whether clients repriced the franchise itself.
The framework's standing templates, carried at the level the system states them, with no name-specific threshold attached:
- adjusted FCF or EBITDA declines where flat-or-better was underwritten.
- revenue declines for a third consecutive year.
- capital allocation pivots to debt paydown over repurchases.
- share count inflects upward.
- the industry repricing cycle fails to materialize where industry-wide mean reversion was underwritten.
The ledger as recorded. The conditions above are restated in several places across the run's briefs, at different levels of detail. The remaining entries are reproduced verbatim below — including the internal source tags two of them carry — so the ledger the verdict machinery holds and the ledger on this page are the same ledger.
The two tagged entries point at pages this report already links: the Q1 FY2026 call [38], the Level III valuation-weights disclosure [39], the Global Atlantic surrender risk factor [40] and the insurance-subsidiary ratings risk factor [41].
Data gaps
The run could not answer the following, and the verdict was reached in spite of them rather than by working around them.
The framework's own yield machinery does not compute for this company. fit_features returns not_computable for adjusted_fcf, adjusted_fcf_yield, yield_baseline, balance_sheet_class, fcf_stability, float_retirement_years and market_cap. The root cause is structural rather than a data-feed failure: KKR's consolidated cash-flow statement includes its funds' and Global Atlantic's flows, so no meaningful reported free cash flow exists. Stock-based compensation is missing for FY2016–FY2019 and no complete consecutive five-year acquisition window with SBC exists, which is what empties fcf_stability and nulls adjusted_fcf in every year. data/financials/cash_flow.json carries capex and free cash flow only through FY2019 and no SBC field for any year. Every yield, float-retirement and balance-sheet-class figure on this report is therefore derived from the filed segment measures with workings shown, and the adjusted-FCF substitute omits the acquisition deduction, which biases it upward. The 25.0-year float-retirement figure and the 1.40x net-debt-to-Adjusted-EBITDA classification are the analyst's, computed from cited filing pages.
Market capitalisation is reconstructed, and the null cascades. fit_features.market_cap is null with the reason "no positive annual period-end or outstanding share count". The U2 screen, every yield, every float-retirement figure and every consensus_forward_yield entry had to be computed from the 10-K cover-page share count (891,550,894 at 24 February 2026) and the price feed instead. fit_features.share_count_trend.per_year is empty and both CAGRs are null; the share-count series was read directly from the audited statements of operations across three 10-Ks.
Revenue history is stale in the feature file. fit_features.revenue_trajectory stops at FY2020 and tracks the Fees and Other line rather than GAAP total revenues, so consecutive_decline_years = 0 and three_year_hsd_decline = false are computed on a stale window. FY2021–FY2025 revenue was read off the filed statements of operations instead ($19,464.3 million for FY2025); the flag value is unchanged by the extension.
Consensus vintages are incomplete on both ends. data/sp/estimates.json carries dated revision snapshots only for FY2027 and FY2028. There is no FY2026 vintage at any date, so the FY2026 pre-cut figure used in the NPV model ($6.7531) is imputed by grossing the current $6.11654 up by the 9.43% average out-year cut; if a genuine pre-trigger FY2026 vintage exists above that level, the measured cut is larger and the trigger-window gap smaller. The earliest vintage of any kind is 29 January 2026, so the consensus path across the first year of the drawdown — during which the price fell 31.2% — cannot be reconstructed at all. Driver-level consensus has no historical vintages either: data/sp/va.json is a single 21 July 2026 snapshot. Vendor free-cash-flow consensus is internally inconsistent with the same file's cash-from-operations estimates and publishes no contributor count, so the consensus check uses normalized EPS instead.
The seller cannot be identified. FINRA returned zero reported short-interest rows for KKR, and the short-interest history, short-sale-volume, borrow-pressure, peer-context and public-net-short files are all empty, so short-interest level, change, days-to-cover and borrow cost cannot be stated in either direction. data/governance/beneficial_owners.json parses 51 Schedule 13D/G filings but resolves no owner names and no percentages, so institutional turnover through the drawdown cannot be quantified; the 2026 insider record comes from data/governance/insider_activity.json because the insider-transactions index ends at 2025-05-06.
Competitive structure rests on inference. KKR's own competition disclosure names no competitor and discloses no market share, so the peer AUM figures behind the P1 market-structure finding come from the peers' own FY2025 10-Ks, and the industry pool used as the denominator is a 2022 Preqin-based estimate carried in KKR's April 2024 investor day — the implied shares are upper bounds, not measurements. The Strategic Holdings segment's 19 constituent companies are not individually named in the FY2025 10-K, so the X1 auto-OEM check rests on the absence of any automotive reference in the business and segment disclosure rather than on a published holdings list. Peer valuation multiples, the current market capitalisation and the analyst rating distribution have no filing page behind them.
China exposure is measured once, in 2023. No China revenue line, China asset line or China-specific risk factor exists in the FY2025 10-K. The only quantified figure in the corpus is the April 2024 investor day footnote measured at 31 December 2023, so the S1 quantification is 31 months old, and the FY2025 10-K does not disaggregate the $410.1 billion balance sheet by geography, so asset-side dependence cannot be measured at all.
The trigger has no named headline, and web research was unavailable. No document in this corpus names the specific announcement that caused the market-wide move of 3 February 2026; the mechanism is cited to three peer filings and to KKR's own call, and the date is fixed by the price and volume record. The search tool exits with a missing-dependency error and the research provider returned an insufficient-credit error, so no external confirmation could be obtained for the trigger, the pre-trigger consensus record, current competitive and technology threats, corporate-bond refinancing context, or the options chain behind I1.
Instrument facts are partial. The implied volatility of the 21 January 2028 series specifically was not verifiable from available sources — only the 30-day measure (41.5%, data date 28 July 2026) is dated and citable. Contract-level open interest for the 17 December 2027 and 21 January 2028 expirations was not verifiable from available sources; liquidity is characterised only at session level, 6,668 calls and 1,805 puts on 28 July 2026.
The record stops before the next print. No transcript later than the Q1 2026 call of 5 May 2026 exists in the corpus, and second-quarter 2026 results were scheduled for 30 July 2026, one day after this report was written — so realized carried interest against the $720 million Q1 run-rate, the updated forward monetization figure against $1.2 billion, repurchase activity after 1 May 2026 and the authorization balance are all unobserved. No successor Investor Day or medium-term guidance framework has been announced to replace the 2024–2026 targets that expire 31 December 2026, so the post-2026 guidance-reset catalyst has no date. KKR does not publish a year-by-year debt maturity schedule; the finest grain in the filings is a four-bucket contractual-obligations table. KKR's own corporate credit ratings are not disclosed anywhere in the corpus — the A and A2 ratings in the 10-K are Global Atlantic life-insurance subsidiary financial-strength ratings. The corpus holds no KKR annual report before FY2021, so the multi-decade operating record is asserted from the 2008–2009 IPO disclosures rather than from a continuous filed series, and no FY2019 After-tax Distributable Earnings was located, so the segment-basis series starts at FY2020. Enterprise value is approximate — consolidated debt is dominated by non-recourse fund and CFE obligations, so market value is used for every damage measure — and no KKR filing or presentation in the corpus discusses the share price, the drawdown or the multiple directly.
What this tab establishes
KKR is a 50-year-old alternative asset manager that also owns a US life insurer and a portfolio of consolidated operating companies: $744 billion of assets under management, $19.5 billion of FY2025 revenue, $410 billion of balance-sheet assets, 5,043 employees. Both universe tests clear — NYSE-listed common stock of a Delaware corporation, roughly $92 billion of market value. No auto-OEM hit, no Chinese listing, and China sits under 2% of firm AUM. Market structure is a concentrated top tier inside a fragmented industry.
What the firm sells
KKR raises third-party capital, invests it, and charges for doing so. Founded in 1976, it pioneered the leveraged buyout and spent five decades widening from US buyouts into leveraged and alternative credit, infrastructure, real estate, energy, growth equity and core private equity, operating from 36 offices as of December 31, 2025 [1]. It managed $744 billion of assets at that date, of which $219 billion sits inside Global Atlantic, the retirement and life insurer it bought in 2021 and took to full ownership on January 2, 2024 [2]. It employed 5,043 people at year-end — 2,705 in asset management, 1,491 in insurance, 847 in subsidiary organizations [3].
Two sentences for a cold reader: KKR is a fee-and-carry machine that manages $744 billion for pension funds, sovereign wealth funds, insurers and — increasingly — individuals, earning management fees on committed and invested capital plus a share of investment profits. Bolted onto it is a $264 billion insurance balance sheet that sells annuities and reinsurance to fund long-dated liabilities, which KKR's own credit platform then invests.
Assets Under Management ($M)
FY2025 Revenue ($M)
Total Assets ($M)
Employees
Sources: AUM and headcount, FY2025 Form 10-K [4] [5]; revenue is the sum of the filed revenue lines, Consolidated Statements of Operations [6]; total assets, Consolidated Statements of Financial Condition [7].
The GAAP revenue line understates how much of that $410 billion belongs to someone else and overstates how much of the income statement is KKR's. Consolidated net income for FY2025 was $6,145.4 million, of which $3,774.9 million went to noncontrolling interests — redeemable and non-redeemable combined — and $2,370.5 million to KKR itself — $2.34 per diluted share [8]. Management's own operating measure, Total Operating Earnings, was $4,985.8 million; total segment earnings $5,890.3 million; adjusted net income $4,377.5 million [9]. At $102.66 a share and 891.5 million common shares, the market values KKR at roughly 21 times adjusted net income and 18 times total operating earnings; both measures are struck before the allocation of income to exchangeable securities [10], so on the larger adjusted share count the multiples are one to two turns higher. The cash-flow translation of those earnings is worked through in Yield.
Universe screen
Both of the framework's universe tests clear, and the facts are current.
Instrument and venue (U1). KKR is a Delaware corporation whose common stock trades on the New York Stock Exchange under the symbol KKR, Commission File Number 001-34820 [11] [12]. This is a US primary listing of ordinary common stock — not an ADR, not a foreign private issuer, not a Chinese issuer of any form. The lineage runs the right way: the July 2010 prospectus distributed the units of the Guernsey predecessor and listed the common units on the New York Stock Exchange under the symbol KKR, delisting from Euronext Amsterdam in the process [13], and on July 1, 2018 the firm converted from a Delaware limited partnership to a Delaware corporation [14]. Three other KKR securities are separately NYSE-listed — the 6.25% Series D mandatory convertible preferred and two subordinated note issues — but the common stock is the instrument in question [15].
Market capitalization (U2). 891,451,844 common shares were outstanding at December 31, 2025 and 891,550,894 as of February 24, 2026 [16] [17]. At the July 28, 2026 close of $102.66, that is $91.5 billion of common equity value; independent market data for the same session put the figure at $92.2 billion on 897.9 million shares. Either arithmetic sits roughly nine times above the $10 billion line. The 10-K's own cover-page cross-check — $91.1 billion of common stock held by non-affiliates at June 30, 2025 — is the same order of magnitude [18].
One limitation belongs here rather than in a footnote. The deterministic feature file returns market_cap: null, with the reason "no positive annual period-end or outstanding share count", and every field that depends on it — the adjusted-yield series, the float-retirement calculation — is not_computable in consequence. The market-cap figure above is therefore reconstructed from the filed share count and the price feed, not read off the feature file. It is not close to the threshold, so the screen is not sensitive to the reconstruction; the yield work in Yield is more exposed to the same gap.
Segment economics
Three reporting segments, and they do not contribute in proportion to their revenue.
All figures $ millions, segment basis. Source: FY2025 Form 10-K, Analysis of Non-GAAP Performance Measures [19] and Analysis of Asset Management Segment Operating Results [20]; the FY2023 and FY2024 segment earnings columns are from the three-year segment presentation in the notes [21]; Insurance revenue is the sum of the filed insurance revenue lines [22].
Insurance produced 60% of FY2025 revenue and 19% of segment earnings; asset management produced 40% of revenue and 77% of earnings. That gap is the shape of the business. Insurance revenue is gross premium and investment income against which policyholder benefits are paid; asset management revenue is fees and carry against a compensation ratio.
Asset management. Management fees on a segment basis reached $4,100.8 million in FY2025 from $3,461.4 million, with fee-related earnings of $3,714.3 million after $940.7 million of fee-related compensation and $720.2 million of other operating expense [23]. Of the $743.9 billion of AUM, $604.1 billion is fee-paying, against $511.9 billion a year earlier [24]. The mix has moved hard away from the founding product: traditional private equity was over 70% of AUM at the end of 2010 and under 25% at the end of 2025, while total AUM went from $62 billion to $744 billion over the same span [25].
Source: FY2025 Form 10-K, Asset Management [26]. The 2021 step reflects the consolidation of Global Atlantic.
Insurance. Global Atlantic was founded inside Goldman Sachs in 2004, separated in 2013, and sold roughly 60% of itself to KKR on February 1, 2021 before KKR bought the rest on January 2, 2024 [27]. It serves over 3.5 million policyholders, and its reserves split 41% individual and 59% institutional — fixed and indexed annuities and preneed life on one side, block and flow reinsurance, pension risk transfer and funding agreements on the other [28]. A further $58 billion of Global Atlantic AUM comes from third-party sponsored vehicles rather than KKR's own capital [29].
Strategic Holdings. First reported in Q1 2024, this segment holds KKR's own stakes in operating companies acquired through its core private equity strategy — 19 companies at December 31, 2025, contributing KKR's pro-rata share of $4.4 billion of LTM adjusted revenue and $1.1 billion of LTM adjusted EBITDA, both measured as of September 30, 2025 [30] [31]. It contributed $232.0 million of segment earnings in FY2025, under 4% of the total — small, and the filing states the segment is not limited to any industry [32].
One ownership fact belongs in the orientation. KKR employees own approximately 30% of the outstanding common stock, assuming exchange of all vested equity [33]. The declared annualized dividend is $0.78 per share from Q1 2026, a yield of 0.8% at $102.66 — this is not a dividend-yield case [34].
Revenue by geography
The 10-K disaggregates asset management and strategic holdings revenue three ways. Insurance is not disaggregated, but Global Atlantic's four US insurance subsidiaries are domiciled in Massachusetts, Iowa and Indiana and licensed across all 50 states, so it is substantially an American book [35].
All figures $ billions, FY2025. Source: FY2025 Form 10-K, Note 3 Revenues [36]. Region is determined by the geographic focus of the investment vehicle or where the portfolio company is headquartered.
Adding the $11.6 billion insurance segment to the $4.6 billion Americas asset-management figure, roughly 83% of FY2025 revenue was earned in the Americas, 9% in Asia-Pacific and 7% in Europe and the Middle East. Asset management on its own is more international — 23% of its revenue came from Asia-Pacific, driven by capital allocation-based income of $1.1 billion out of $3.8 billion [37]. The filing does not disaggregate the $410 billion balance sheet by geography; that is a gap the corpus cannot close.
Market structure
This is the raw material the year-10 durability question runs on, so it is worth being exact about what the record supports and what it does not.
The top tier is concentrated. Six managers disclosed the following AUM at December 31, 2025.
Sources: Blackstone FY2025 Form 10-K, more than $1.3 trillion [38]; Brookfield Asset Management FY2025 Form 10-K, over $1 trillion [39]; Apollo FY2025 Form 10-K, $938.4 billion [40]; KKR FY2025 Form 10-K, $744 billion [41]; Ares FY2025 Form 10-K, $622.5 billion [42]; Carlyle FY2025 Form 10-K, $477 billion [43]. Blackstone and Brookfield are plotted at their disclosed floors.
Those six manage at least $5.1 trillion between them. Set against the industry pool KKR itself cites — roughly $15 trillion of traditional alternatives AUM in 2022, projected to reach $24 trillion by 2028 [44] — the top six hold on the order of a third of the industry, and KKR alone roughly 5%. The pool has grown since 2022, so treat those shares as upper bounds rather than measurements. This is not a monopoly, a duopoly, or a classic oligopoly. It is a scale-concentrated top tier sitting on a long fragmented tail: a structure where the largest firms take a disproportionate share of new institutional commitments, but where no participant sets price.
The company says the same thing, more bluntly. KKR's own Item 1 opens the competition section with "Our asset management and capital markets businesses operate in an intensely competitive industry", naming traditional and alternative asset managers, investment banks, commercial finance companies, sovereign wealth funds and strategic buyers as competitors, and adding that fundraising competition turns on performance, reputation, "and pricing and fund terms, including fees" [45]. The risk factors go further: "There are numerous funds focused on private equity, real assets, credit, and hedge fund strategies that compete for investor capital", and the filing notes that traditional managers have acquired alternative managers while hedge funds take control positions and private equity funds buy debt — convergence that "heightens competition for investments" [46]. The insurance side is described as "highly competitive", explicitly including annuity businesses owned by rival alternative managers [47]. No named competitor and no market-share figure appears anywhere in KKR's own competition disclosure; the shares above are assembled from peer filings, not from KKR.
Barriers and capital intensity
Regulatory entry barriers are real but not prohibitive for asset management. KKR runs its advisory business through six named SEC-registered investment advisers subject to the Investment Advisers Act, its fiduciary provisions, periodic SEC examination and the SEC's power to restrict advisory activity for non-compliance [48]. KKR Capital Markets is a broker-dealer registered with the SEC and in 53 US states and territories, subject to the uniform net capital rule [49]. In Europe an Irish-authorized subsidiary operates under AIFMD, and several UK subsidiaries are FCA-authorized under FSMA [50]. Registration as an adviser is a compliance burden, not a license the regulator withholds from newcomers — the private-credit boom of the last decade is evidence of how permeable it is.
The insurance barrier is the harder one. Global Atlantic's four US insurance subsidiaries are licensed in all 50 states, the District of Columbia, Puerto Rico and the US Virgin Islands, with the domiciliary state as primary regulator [51]. Those regulators run periodic examinations under NAIC guidelines, restrict dividends above statutory limits to approved "extraordinary" distributions, and require statutory reserves under Regulation XXX and AG38 that can exceed GAAP reserves; changes of control of an insurer require regulatory approval [52]. This is the framework's "the regulator does not let a garage startup take share" condition — but it applies to the segment that generated 19% of FY2025 segment earnings, not to the 77% that came from asset management.
Capital intensity cuts both ways. Total assets of $410.1 billion sit against $30.9 billion of stockholders' equity [53], and $264.2 billion of that asset base — 64% — is the insurance balance sheet: $192.0 billion of investments, $48.0 billion of reinsurance recoverable and $5.9 billion of insurance intangibles [54]. Weight of capital is a barrier: it takes years and regulatory consent to assemble a $264 billion annuity book. But it also means a large fraction of reported assets carries credit and duration risk rather than fee streams, and the ratings that make the liabilities saleable — A from A.M. Best, A2 from Moody's, A from Standard and Poor's and A from Fitch on the life operating subsidiaries — are themselves a maintenance requirement, not a moat [55].
How essential the product is. Two different answers. Institutional and retail allocation to alternatives is a discretionary choice made against public-market alternatives, and fee terms are explicitly a competitive variable in KKR's own words [56]. Retirement income for 3.5 million annuity holders is not discretionary, and the contractual liabilities behind it run for decades [57]. The durability question therefore looks different for each segment — it is worked through in Durability.
Operating history. Fifty years as a firm, from 1976 [58]; sixteen as a US-listed entity, from the July 2010 listing [59]; and eight in the current corporate form [60]. The 30-to-50-year history the framework asks for is met at the firm level, but two of the three current reporting segments are recent: insurance since 2021, Strategic Holdings since Q1 2024 [61] [62]. The business that will produce year-10 cash flow is not the business that produced the last 50 years of it.
Exclusion screen
Three checks the corpus can settle at this stage. The promotional-CEO and structural-decline tests belong to Self-Help and Durability.
Auto OEM (X1) — no hit. KKR is classified under SEC SIC 6282, Investment Advice, and manufactures nothing. Its Strategic Holdings segment holds 19 operating companies and the filing states the segment is not limited to any industry [63], so a vehicle manufacturer could in principle sit inside it. The word "automotive" appears exactly once in the 333-page FY2025 10-K, in a director biography describing prior service at Honeywell Transportation Systems — nowhere in the description of the business, the segment disclosure or the fund performance tables. On the record available, the exclusion does not bite.
Consensus-saturated positioning (X4) — partial, and pointing in two directions. The valuation leg does not trigger. On market data for the July 28, 2026 session, KKR trades at 3.6 times trailing revenue against a peer median near 6.2 times, and at 35.7 times trailing earnings against a peer median near 45 times.
Source: market data as of the July 28, 2026 close; price-to-sales is market cap divided by trailing revenue. Trailing revenue is not comparable across this set — KKR and Apollo consolidate an owned annuity balance sheet whose premiums and investment income run through revenue, while Blackstone, Ares and Carlyle do not, which mechanically depresses their price-to-sales ratios relative to the fee-only managers.
The chart shape leg is where the history matters. KKR closed 2015 at $15.59 and reached an intraday high of $163.08 in 2024 — a bottom-left-to-top-right decade of exactly the kind the framework excludes. That chart has since broken: from a closing peak of $167.07 on January 31, 2025 to a trough of $83.88 on March 12, 2026, a 49.8% decline, with the stock at $102.66 on July 28, 2026, still 38.6% below the peak.
Source: daily price history, as reported; 2026 is the July 28, 2026 close, not a year-end. The drawdown itself is anatomized in Dislocation.
What has not relieved is the coverage. Of 21 published ratings, 6 are strong buy, 12 buy, 3 hold and none sell, with a mean target price of $123.48 — 20% above the current price, as of July 29, 2026. The sell side has not capitulated on this name; it has marked its target down and kept its rating. The framework's concern with darlings is that where consensus already owns the story there is no edge, and on the pricing evidence the story has been partly repriced while on the coverage evidence it has not been abandoned. Whether the selling was capitulation or repositioning is a question for Dislocation.
China exposure (S1) — quantified, and small. KKR's most explicit disclosure is a footnote to its April 2024 investor day stating that China investments represented under 2% of total firm AUM as of December 31, 2023 [64]. That figure has not been restated in a later deck, so it is a 2023 measurement carried forward. Three current facts bound it. Asia-Pacific dedicated AUM was more than $80 billion of the $744 billion total at the end of 2025 — roughly 11%, up from $18 billion in 2018 — spread across Asia private equity, real estate, infrastructure and credit [65]. Greater China accounts for 47 of the roughly 900 Asia-Pacific employees [66], down from 64 of 570-plus in the April 2024 deck [67]. And within Asia-Pacific capital invested at fair value, Greater China was 14% against Japan's 39% [68]. Asia-Pacific as a whole did generate $1.8 billion of the $7.8 billion of FY2025 asset management and strategic holdings revenue — 23% — but that is predominantly Japanese, Indian and Australian, not Chinese [69].
The FY2025 10-K discusses China chiefly as a macro condition — weak domestic demand, property-sector contraction, trade tensions — and as a jurisdiction where KKR holds an operating authorization alongside Australia, Canada, India, Korea and others. There is no China revenue line, no China asset line, and no China-specific risk factor. The honest statement is that KKR carries no material China dependence on the evidence available, with the caveat that the only precise number is 31 months old.
What this tab establishes
KKR fell 49.8% from a $167.07 close on 31 January 2025 to $83.88 on 12 March 2026, and trades at $102.66. The fall came in four legs; the largest ran 3 February to 12 March 2026 on average volume 3.7 times normal, with a measured twenty-day spike of 3.93 times the pre-peak median. No company guidance cut preceded that leg. The repricing hit the whole listed alternative-manager group, on AI-disruption fear applied to private-market portfolios.
The Drawdown
Peak — 31 Jan 2025
Trough — 12 Mar 2026
Current — 28 Jul 2026
Peak to trough
Days peak to trough
Source: derived from the daily price record; figures as published in the run's deterministic feature file (fit_features.capitulation_gauge.drawdown).
Source: daily closing prices as reported; month-end observations plus the 12 March 2026 trough close.
The fall is not one event. Measured with a 12% reversal filter, four separate declines of 16% or more are separated by three rallies of 13% or more. Peak to current is 38.6%; peak to trough is the 49.8% the feature file records.
Source: derived from the daily closing-price record, 31 January 2025 to 28 July 2026, using a 12% reversal filter.
Leg 7 is the one that made the low. It divides cleanly in two. From the 11 December 2025 local high of $142.77 to $114.36 on 2 February 2026 the stock lost 19.9% across 34 sessions on average daily volume of 4.05 million shares, 1.41 times the pre-peak median — decline without an event, at ordinary turnover. From 3 February to 12 March 2026 it lost a further 26.7% across 27 sessions on average daily volume of 10.64 million shares, 3.72 times the pre-peak median.
The Trigger
Three dated documents bear on the fall, and they do not carry equal weight.
The first is company-specific and small. On 7 November 2025, on the third-quarter call, KKR disclosed that roughly $350 million of gross carried interest collected from its second Asia private equity fund — raised twelve to thirteen years earlier, stopped investing about eight years earlier — had to be repaid, with the compensation reversal taken as a fourth-quarter charge worth about $0.18 of adjusted net income per share; management stated it saw no other material clawback risk across the portfolio [1]. The stock closed up 1.68% that day on 3.18 times median volume.
The second is the fourth-quarter print. KKR furnished its FY2025 results on 5 February 2026 [2], reporting $1.08 of fee-related earnings per share, $1.42 of total operating earnings per share and $1.12 of adjusted net income per share, the last including the carried-interest repayment obligation; excluding it, $1.30 [3]. Against consensus that was a 1.6% shortfall on normalised EPS and an 8.4% shortfall on revenue. The stock closed down 5.35% that day on 5.78 times median volume. The same morning KKR announced the $1.4 billion Arctos acquisition [4].
The third is not KKR's document at all, and it is the one that moved the price. On 3 February 2026 — two sessions before the results, with no KKR filing or release on the tape — the stock fell 9.69% on 11.5 million shares, 4.02 times the pre-peak median. Brookfield Asset Management's fourth-quarter call the following morning opened its question-and-answer session on the point: "a lot of anxiety surfaced in the market yesterday around AI-driven disruption and including within the alternative space" [5]. Carlyle's FY2025 Form 10-K puts the magnitude on the record: "The software sector in particular has sold off on 'AI disruption' fears and is down 33% year-to-date through February 24, 2026" [6]. EQT described the same quarter as "significant share price volatility and pressure on listed software companies as fears of an AI led business model disruption for this sector spread" [7].
The transmission mechanism into a private-markets manager is disclosed and quantified. Software is about 7% of KKR's AUM — roughly 15% inside private equity, 5% across credit, 2.5% inside Global Atlantic — and because private marks reference public comparables, the marks on those names fell in the first quarter of 2026 even though the underlying companies grew revenue and EBITDA at high single digits [8]. The first analyst question on the 5 February call named the fear directly, asking how KKR had "re-underwritten your private portfolios, your balance sheet, even your monetization pipeline for tariffs and AI" [9].
The event leg is therefore separable from the drift that preceded it. The 19.9% decline from 11 December 2025 to 2 February 2026 carried no company event and 1.4 times normal volume. Everything from 3 February onward carries both.
Sources: daily price and volume record; Form 8-K of 5 February 2026 [10]; SEC Form 4 filings for the 27 February purchases.
The Fear Gauge
The measured spike is 3.93 times. The feature file computes it as the highest twenty-session average volume inside the peak-to-trough leg divided by the median daily volume over the 180 calendar days before the peak: 11,243,613 shares against 2,863,900 shares. That twenty-session window ended on 3 March 2026 — it spans 3 February to 3 March, and so covers the whole event phase and none of the drift.
Source: derived from the daily volume record; base is the median daily volume over the 180 calendar days before the 31 January 2025 peak, 2,863,900 shares, the same base the feature file uses.
Two features of that profile matter. February 2026 averaged 10.8 million shares a day, 3.77 times the base, and the two heaviest sessions of the whole drawdown — 20.8 million shares on 4 February and 20.3 million on 27 February — sit inside it. March ran 2.80 times, then April fell back to 1.66 times and July to 1.14 times. Turnover normalised within weeks of the low, which is the shape of exhaustion rather than a persistent re-rating of the shareholder base.
The one heavier month in the record is June 2024 at 4.96 times, and it was a buying event: KKR entered the S&P 500 in the June 2024 rebalance [11], and 145.6 million shares traded on 21 June 2024 as index funds established positions. No comparable index-driven forced sale appears anywhere in the drawdown window.
Management's own framing of the frequency belongs on the record because it bears on how unusual this is. On the 5 February call the co-CEO stated that across sixteen or seventeen years as a public company, "this is the tenth time we've seen our stock down more than 20% in a month" [12]. A 20% monthly drawdown roughly every twenty months is a high base rate; the 49.8% peak-to-trough figure here is a larger event than that base rate describes, but the genre is not rare for this stock.
Who Was Selling
The direct evidence on seller identity is thin, and one line of it is missing outright: FINRA returned no reported short-interest position rows for KKR in this run, so short-interest level and change cannot be stated. Daily short-sale volume, borrow-pressure indicators and holder-level net-short disclosures are all empty as well. That is a real gap in this tab's evidence, not a finding of low short interest.
What the record does establish is who was on the other side, in size and on dated filings.
Source: SEC Form 4 open-market purchase filings (transaction code P), 9 February to 4 March 2026, as staged in this run's governance data.
Thirteen open-market purchases across five insiders totalled 516,097 shares for $50.9 million at an average of $98.69, every one of them inside the event phase. The lowest-priced pair came on 27 February — the 7.10-times-volume session — with each co-CEO taking 50,000 shares, Nuttall at $87.81 and Bae at $88.56, within 5% of what turned out to be the closing low.
The company bought alongside them. On the 5 May 2026 call KKR disclosed that it had "repurchased or retired $317 million of stock this year through May 1 at an average price of approximately $91", with the board authorising a further $500 million, and confirmed the personal purchases: "you would have also seen our co-CEOs and a number of our directors buying stock personally in the quarter" [13]. The two preceding years read differently: the feature file records buyback cash of $0 in FY2024 and $3.4 million in FY2025. Four months of 2026 bought back roughly a hundred times the prior two years combined. The mechanics of that programme belong to Self-Help; what it establishes here is that the marginal buyer at the low was the issuer and its own principals.
On the anchored side, employees own roughly 30% of the stock [14], and S&P 500 index funds have held since June 2024 [15]. Neither block is a discretionary seller. No index deletion, fund liquidation or disclosed forced sale appears in the window. The Schedule 13D/G filings staged in this run resolve 51 filings but no owner names, so institutional holder-base change cannot be quantified from the corpus.
One distinction is worth drawing precisely, because the two are easily conflated. The redemption pressure discussed through this period sat in KKR's products, not its stock: private BDC redemptions in the wealth channel, against which KKR disclosed that direct lending is $39 billion or 5% of AUM and its private BDC roughly $3 billion, or 0.4% [16]. Fund-level redemptions are not equity-holder liquidation, and nothing in the corpus links them.
Finally, the selling was not name-specific. Measured from the same 31 January 2025 peak to the same 12 March 2026 date, the four listed peers in this run's corpus with usable price feeds fell between 19% and 51%.
Source: derived from each company's own daily closing-price feed; peak-to-trough measured 31 January 2025 to 12 March 2026, February leg measured 2 February to 12 March 2026.
Over the 3 February to 12 March window KKR lost 26.7% while Ares lost 34.1%, Blackstone 27.7%, Carlyle 24.9% and Apollo 24.7%. The dispersion across the five names is under ten percentage points on a move of roughly a quarter — the group repriced together.
Estimates Against Price
The reported numbers did not fall. Across the eight quarters the run's revision data covers, KKR beat consensus normalised EPS in seven. The single miss was the fourth quarter of 2025 at 1.6% below consensus — the quarter carrying the pre-announced carry repayment, which management had flagged a full quarter ahead [17]. The first quarter of 2026, reported 5 May, beat by 10.3% on EPS and 11.2% on revenue.
Forward consensus did fall, and the timing is measurable because the estimate feed carries dated vintages.
Source: derived from the run's consensus estimate vintages (29 January, 29 April, 28 June and 28 July 2026) and the daily closing-price record.
FY2027 consensus EPS went $8.13 on 29 January 2026, $7.65 on 29 April, $7.40 on 28 June and $7.35 on 28 July — down 9.6% over six months. FY2028 went $9.48 to $8.60, down 9.3%, and has drifted up slightly since April. FY2027 revenue fell 3.4%. Over the identical six months the price fell 10.7%, from $114.98 to $102.66.
Measured to today, therefore, price and estimates have moved close to one-for-one — 10.7% against 9.6%. Measured to the trough they had not. The price fell 27.0% between 29 January and 12 March 2026; the next dated estimate vintage, struck on 29 April and so seven weeks after the low, had FY2027 EPS down only 5.9% from the January mark. The estimate cut standing on 12 March was therefore no larger than 5.9%, against a price cut of 27.0% — the price move outran the earnings revision by at least four and a half times through the capitulation, then the gap closed from both ends as the stock recovered 22.4% off the low and estimates continued to slide.
The decomposition against reported earnings is exact. FY2024 adjusted net income per share was $4.70 and FY2025 was $4.87, up 3.6%; fee-related earnings per share went $3.66 to $4.13, up 12.8% [18].
Source: derived — price divided by the most recently completed fiscal year's adjusted net income and fee-related earnings per adjusted share, $4.70 and $3.66 for FY2024 and $4.87 and $4.13 for FY2025, as filed [19].
At the peak the market paid 35.6 times the just-completed year's adjusted net income per share and 45.6 times fee-related earnings per share. Today it pays 21.1 times and 24.9 times. Multiplying through: earnings per share up 3.6% against a multiple down 40.7% gives 0.614, or a 38.6% price fall, matching the observed decline. On the fee-related line, up 12.8% against a multiple down 45.5% gives the same 38.6%. On forward consensus of $6.12 for FY2026, today's price is 16.8 times.
None of the peak-to-current decline is attributable to reported earnings going backwards. All of it is multiple.
The one forward number management did walk down came after the low. Having entered 2026 guiding to "$7-plus" of adjusted net income per share on a constructive monetisation environment, KKR said on 5 May 2026 that with "modestly less visibility today than what our budget would have suggested," it was "more likely that we land below that level", while noting that delayed monetisations would shift into 2027 rather than disappear [20]. The stock fell 1.29% that session on 1.92 times median volume. The guidance change followed the drawdown by eight weeks; it did not cause it.
What the Record Cannot Show
Three gaps bound what this tab can claim. Short interest — level, change, days-to-cover, borrow cost — is entirely absent from the run's data; the provider returned zero rows, so no statement about short positioning is available in either direction. The beneficial-ownership file resolves 51 Schedule 13D/G filings without owner names, so quarter-by-quarter institutional holder turnover cannot be traced. And the specific market event of 3 February 2026 is dated and corroborated by three separate peer filings as an AI-disruption repricing, but no primary document in this corpus names the announcement that started it; the mechanism is established, the proximate headline is not.
What the price fall means for value is not settled here. The near-term earnings and cash arithmetic against the change in market capitalisation, and the temporary-versus-permanent question, are worked in Damage Math; the yield the current price implies is computed in Yield.
What this tab establishes
Consensus cut KKR's out-year earnings roughly 9.5% around the trigger. Market value fell $56.8 billion, 38.0%, from the January 2025 peak, and $11.1 billion, 10.7%, from the pre-trigger estimate vintage. A conservative two-scenario discounted-cash-flow puts the destroyed NPV at 9.3% if the hit is permanent and 1.5% if it is monetisation timing. The judges put the probability the impairment is temporary at 0.76. The gap is wide against the peak and thin against the trigger.
The near-term hit, quantified
The framework's numerator is how far forward earnings actually fell. Dated consensus vintages exist for FY2027 and FY2028 only; the 180-day vintage is 29 January 2026, four sessions before the 3 February repricing that opened the event leg described in Dislocation, so it brackets the trigger cleanly.
Source: consensus estimate vintages, 29 January and 28 July 2026; company-reported per-share basis reconciled to the FY2025 Annual Report segment table [1].
The company's own guidance moved over the same six months, and the record is precise. At its April 2024 investor day KKR set a 2026 adjusted-net-income target of $7-plus per adjusted share. On the 5 February 2026 call it was still reaffirmed conditionally: "presuming a constructive monetization environment, we also continue to feel confident that we can achieve $7-plus per share of adjusted net income. However, if the environment does deteriorate, we may delay some of our monetization activity… we'd be earning less in 2026, but… that would be in service of more earnings in 2027 and beyond" [2]. On 5 May 2026 the condition bound: "if you were handicapping our ability to reach $7 per share, we do think it is more likely that we land below that level. Importantly, if that were to happen, any delayed monetizations that impact 2026 would not be lost as we would expect them to shift to 2027 and beyond" [3].
Two things about that guidance change are worth stating exactly. It is not quantified — management said "below $7" and gave no replacement number [4]. And consensus was already below it: the FY2026 mean of $6.12 across 22 analysts sits 12.6% under the $7 anchor, so the sell side had discounted the target well before management withdrew it. Against FY2025 delivered adjusted net income of $4.87 per adjusted share [5], the FY2026 consensus is still 25.7% higher, and the FY2027 consensus of $7.35 is 51% higher. Forward earnings never fell below the last delivered year.
The price over the same window
Market capitalisation is derived here, because the deterministic feature file returns not_computable for it. The denominator is KKR's own adjusted share count — common stock plus vested exchangeable securities, the same base as its per-share earnings measures — taken from the disclosure nearest each date.
Sources: daily closes from the price record; weighted average adjusted shares of 893,849,528 (FY2024) and 901,069,396 (4Q'25) [6] and 901,461,945 (1Q'26) [7]; cross-checked against 891,550,894 shares of common stock outstanding at 24 February 2026 [8].
Peak to last: minus $56.79 billion, minus 38.0%. Pre-trigger to last: minus $11.06 billion, minus 10.7%. Peak to trough: minus $73.72 billion, minus 49.4%. The percentage on market value is fractionally shallower than on price because the adjusted share count rose 0.85% over the span.
Enterprise value moves nearly one-for-one with equity here, and consolidated EV is not the useful measure. KKR's balance sheet carried $39.88 billion of asset-management debt obligations at 31 December 2025, of which $30.23 billion is debt of consolidated collateralised financing entities — CLO notes secured on those vehicles' own assets — and $9.65 billion is financing facilities of consolidated funds [9]. Neither is a claim KKR services from its own earnings. KKR's own senior and subordinated notes totalled $9.37 billion of principal at 31 December 2025 against $8.58 billion a year earlier [10], and it issued $2.5 billion of Series D mandatory convertible preferred stock during 2025 [11]. On that basis enterprise value ran roughly $157.9 billion at the peak and $104.4 billion now — minus 33.9%, against minus 38.0% on equity — and minus 9.6% across the trigger window, against minus 10.7% on equity. Every measure below uses equity value, which is the tighter of the two.
Source: consensus vintages 29 January, 29 April, 28 June and 28 July 2026 (price taken at 26 June, the last session before the 28 June vintage date); closes from the price record.
The two lines separate hard through March and re-converge by July. At the 12 March trough the price was down 27.0% from the January vintage while the deepest estimate cut measurable by the next vintage was 9.6%, on FY2028. By 28 July the price is down 10.7% and the FY2027 cut is 9.6% — a spread of 110 basis points.
Two scenarios, and what each destroys
The question the framework asks is whether a small hit to near-term earnings destroyed a large share of the NPV of all future cash flows. The arithmetic below is a delta calculation, not a valuation: it compares the present value of the pre-cut consensus path against the post-cut path, so the answer does not depend on whether the absolute level is right.
Assumptions, all stated. Discount rate 10%, applied to adjusted net income per adjusted share, which is KKR's after-tax distributable measure. Explicit forecast FY2026 to FY2028 from consensus. Terminal value at end-FY2028 on a Gordon formula at 3% perpetual growth — conservative against a consensus FY2026-28 EPS compound rate of 18.6%. The pre-cut FY2026 figure is imputed by grossing the current $6.117 up by the 9.4% average out-year cut, since no FY2026 vintage exists; the FY2027 and FY2028 pre-cut figures are the actual 29 January vintages. Temporary means the FY2026-28 shortfall is deferred, so the terminal base reverts to the pre-cut FY2028 level and no catch-up earnings are credited. Permanent means the level shift persists, so the terminal base is the post-cut FY2028 level.
Source: derived from consensus estimate vintages of 29 January and 28 July 2026 at a 10% discount rate and 3% perpetual growth; per-share basis reconciled to reported adjusted net income per adjusted share [12].
The workings reproduce from the rows above. Explicit stage: 6.753/1.10 + 8.129/1.21 + 9.479/1.331 = 19.98 pre-cut, and 6.117/1.10 + 7.351/1.21 + 8.600/1.331 = 18.10 post-cut. Terminal: 9.479 × 1.03 / 0.07 = 139.48, discounted three years at 1.331 to 104.80; 8.600 × 1.03 / 0.07 = 126.54, discounted to 95.07.
- Permanent: minus $11.61 per share, minus 9.30%. A proportional level shift scales the whole path, so this figure is essentially discount-rate independent — it computes to minus 9.30% at 8%, 9%, 10% and minus 9.31% at 12%.
- Temporary: minus $1.89 per share, minus 1.51%. The deferral costs only the time value of three years of shifted cash. At 8% the cost is 1.11%; at 12%, 1.88%.
- Weighted at the trial's 0.76: 0.76 × 1.51% + 0.24 × 9.30% = 3.38%.
The gap, and the window it depends on
Source: derived — price damage from the market-value table above; NPV damage is 3.38% of the starting market value under the two-scenario model, weighted at the trial's p_temporary of 0.76.
On the trigger window the price destroyed $11.06 billion and the probability-weighted NPV damage is $3.50 billion, leaving a $7.56 billion gap, 7.3% of the pre-trigger market value. On the full drawdown the price destroyed $56.79 billion against $5.05 billion of weighted NPV damage — a $51.74 billion gap, 34.6% of the peak market value.
Those two answers are far apart, and the honest reading is that they measure different things.
The trigger-window gap nearly disappears under a pure permanent reading. If every dollar of the 9.3% cut is a permanent level shift, the NPV damage is $9.64 billion against $11.06 billion of price damage — a gap of $1.42 billion, 1.4% of the starting market value. Put plainly: judged only against the news it responded to, the market did not obviously overreact. The gap on that window exists only because the trial puts three-quarters of the weight on the shortfall being timing.
The full-drawdown gap is large but is not damage arithmetic. Over the eighteen months from the January 2025 peak, delivered earnings rose — adjusted net income per adjusted share went from $4.70 in FY2024 to $4.87 in FY2025 [13] — and forward consensus rose with them. The entire move is multiple: 35.5 times trailing adjusted net income per share at the peak, 13.7 times FY2026 consensus at the trough, 16.8 times now. That is a repricing of the growth-and-quality premium, not the market anchoring to an earnings cut. The framework's canonical damage-anchor setup — a guidance cut the stock tracks roughly one-for-one — is not what happened here.
The reverse arithmetic makes the point without any scenario. At $102.66 and a 10% discount rate, the consensus FY2026-28 path plus a terminal value implies perpetual growth of 2.2% beyond 2028. At the pre-trigger $114.98 on the pre-cut path it implied 2.3%. The market has been paying for roughly inflation-rate growth in perpetuity at both prices; what changed between January 2025 and today is that it stopped paying for much more than that.
The trial, and the ruling
The temporary-or-permanent question was argued by two opposing briefs, each citing the corpus, and ruled on by three judges reading in different orders, blind to this tab.
The case for temporary, at its strongest
The shortfall sits entirely in one line, and that line is a timing variable. FY2025 total operating earnings — the recurring block — rose 14.4% to $4,985.8 million, while total investing earnings fell 21.4% to $904.5 million; adjusted net income still rose 4.2% to $4,377.5 million [14]. Of the $246.4 million decline in investing earnings, $210 million is a single disclosed item: the Asian Fund II clawback, which KKR sized in advance and which no other fund's clawback exceeded [15]. Add it back and net realised performance income was $701.7 million against $608.8 million, up 15.3%.
The recurring engine accelerated through the drawdown. First-quarter 2026 management fees were $1,193 million, up 30%; fee-related earnings $1,016 million, up 24%, at a 69% margin; total operating earnings $1,325 million, up 19%; fee-paying assets under management $615 billion, up 17% [16]. Fee-related earnings per share were $1.13, up 23%, and 85% of trailing pre-tax segment earnings came from the recurring streams [17]. Client demand — the only direct test of franchise damage — set a record: $129 billion of new capital in 2025, "the highest fundraising year in our fifty-year history and almost double where we were as a firm two years ago", alongside total embedded gains of $19 billion at 31 December, a record and up 19% year on year [18]. Deferred exits are not lost exits: management put more than $1.2 billion of signed forward monetisation revenue on the table, "the largest forward monetization figure we've discussed on a call in our history" [19]. And the pattern has a precedent inside KKR's own record: fee-related earnings rose from $1,970.0 million in 2021 to $2,167.4 million in 2022 to $2,383.8 million in 2023 straight through a 48.4% peak-to-trough drawdown [20].
The case for permanent, at its strongest
KKR made its insurance exposure structural and irreversible. It bought the remaining 37% of Global Atlantic for approximately $2.7 billion in cash, taking ownership to 100% [21], and Global Atlantic now supplies $219 billion of KKR's $744 billion of assets under management [22]. That is spread income, not contracted fee income, and it earns a lower-quality dollar: FY2025 insurance revenue of $11.63 billion produced segment earnings of $1.11 billion, against asset-management revenue of $7.84 billion producing $4.55 billion [23].
The marginal return on that book is compressing, and management said so on the record. Liability-side competition is "very high", asset spreads are "as tight as they've been in a very long time", the combination is "putting some increased competitive pressure on ROEs", and KKR "pull[ed] back on the origination front in Q1" [24]. The remedy is not cost reduction but taking more duration risk: roughly 80% of first-quarter originations carried seven years of duration or more, against 37% for full-year 2024 [25]. The 10-K names what that costs in a bad state: higher rates "may result in increased surrenders on interest-sensitive products… as policyholders seek higher investment returns elsewhere", creating cash-flow mismatches [26], and a ratings downgrade can force capital raising or a change of business plan [27].
And the earnings the temporary case banks are marks, not cash. KKR recognises carried interest "as if the fair value of the underlying investments were realized as of the reporting date, irrespective of whether such amounts have been realized" [28]. Those fair values lean heavily on discounted cash flow: the weight ascribed to the discounted-cash-flow methodology was 55% for Level III private equity and 91% for Level III real assets at 31 December 2025 [29]. A reservoir measured that way is not the same asset as a signed exit.
The ruling
Source: the profile's adversarial diagnosis trial ruling (ruchir/trial/tally.json), three independent judges, order-randomised.
The judges put the probability the impairment is temporary at 0.76, with a per-seat range of 0.66 to 0.76 and a mean of 0.73. The result is not contested: the spread is 0.10, and reading order moved the answer by 0.05 — 0.76 when the temporary brief was read first, 0.71 when the permanent brief was. That probability is the report's diagnosis and this tab does not adjust it.
Two things about how the ruling was reached are worth carrying forward, because they bear on how much weight the losing side's evidence retains. The permanent brief's rebuttal exhibit — FY2025 GAAP net income falling to $2,370 million from $3,076 million — was discredited by two seats on its own source: the same one-page table shows pre-tax income rising 21.1% to $7,099 million on flat tax expense [30], so the decline sits below the pre-tax line in noncontrolling interests, not in earnings. Its strongest exhibit survived: two seats named the admitted Global Atlantic return-on-equity compression as the best-verified permanent evidence, and one recorded that it is why the probability stops well short of 0.9. On the other side, the temporary brief's forward-monetisation exhibit was cited to the wrong page — the quotes are verbatim and in context but sit on page 4, not page 3 — and one seat could not check the peer de-rating exhibit at all, so that comparison carries no verified weight in the ruling.
Which line broke, and whether it self-corrects
Driver-level consensus, on its 21 July 2026 vintage, isolates the break precisely. Of KKR's forecast operating lines, exactly one is modelled to fall in FY2026.
Source: driver-level consensus, vintage 21 July 2026; FY2025 comparatives reconcile to the FY2025 Annual Report segment table [31].
Fee-related earnings are modelled up 19.2% in FY2026 and up 60% by FY2028, at a margin widening from 69.2% to 70.6%; fee-paying assets under management from $602 billion to $867 billion. The line that falls is Global Atlantic: insurance operating earnings of $1,075 million in FY2026 against $1,109 million delivered in FY2025, minus 3.1%. Underneath it, the return on average equity the street models runs 11.4% in FY2025, 9.1% in FY2026, 10.2% in FY2027 and 11.6% in FY2028.
That shape is itself a claim about the mechanism: a 230 basis-point return trough in one year, 116 basis points back in the next, and above the FY2025 level by FY2028. The sell side is modelling a spread cycle, not a reset.
The repricing mechanism management describes is the annuity spread cycle in both directions: "when there is increased levels of volatility… we believe liabilities will become cheaper. And definitionally, you're going to see spreads come out on the asset side and so the ROE potential is outsized", backed by $6 billion of dry powder equity that "translates into $60-plus billion of buying power on the liability side" — and, on the same page, "we also know that that's not going to last forever" [32]. The second mechanism is monetisation timing rather than cost: gross realised carried interest is contracted to arrive when exits close, and management put more than $1.2 billion of signed forward monetisation revenue behind the shift [33].
The structural argument against is not that revenue is declining — it is not, on any line — but that the fix carries its own liability. Doubling long-duration originations from 37% to 80% [34] buys spread by lengthening the book into exactly the surrender and asset-liability exposures the 10-K describes [35]. Nothing in the corpus records a surrender, recapture or ratings event; the risk is conditional and disclosed, not realised.
Two facts cut against reading this as a fear dislocation, and both belong on the page. The sell side is not scared: 19 of 22 recommendations are buy or outperform, none are sell, and the mean target of $123.48 sits 20.3% above the last close (sell-side consensus, 28 July 2026). And KKR entered this drawdown priced as a consensus favourite at 35.5 times trailing adjusted earnings — so a large part of the 38% fall is the unwinding of that premium rather than a response to anything that went wrong.
What would change this read
The trial's own flip conditions are the falsifiers, and each is dated and checkable. Fee-related earnings per share falling below $1.13 for two consecutive quarters — second-quarter 2026 reports in early August, third-quarter in November — or fee-paying assets under management declining sequentially from $615 billion, would convert a timing story into fee compression. Total embedded gains falling below roughly $15 billion by the fourth-quarter 2026 results, from $18.3 billion at 31 March 2026 [36], without matching cash realisations, would mean the reservoir is being written down at marks rather than harvested. Insurance operating earnings declining year on year from $1,109 million, or any capital raise, ratings action or material surrender at Global Atlantic, would turn the conceded cyclical spread compression into a realised return reset. And FY2027 gross realised carry failing to exceed FY2026's would falsify the claim that delayed monetisations "would not be lost".
On the damage arithmetic specifically, the read here changes if a FY2026 consensus vintage from before the trigger turns up materially above the $6.75 imputed here — that would widen the measured cut and shrink the trigger-window gap further — or if the estimate cut continues past 9.5% without the price falling further, which would close the remaining gap from the other end.
What this tab establishes
On the framework's own basis — free cash flow less stock-based compensation less the five-year average of acquisition spend — KKR's adjusted yield computes to 2.9% on FY2025 and 2.6% on the three-year average against a 10% reference line. The deterministic feature file returns not_computable for every yield field, because KKR's GAAP cash-flow statement consolidates its funds and its insurance company. Both the filed basis and a segment substitute are shown below.
The adjustment, line by line
The framework's yield basis is reported free cash flow minus stock-based compensation minus the trailing five-year average of acquisition spend. Every input below comes off the filed consolidated statements of cash flows.
All figures $ millions. Sources: FY2025 Form 10-K, Consolidated Statements of Cash Flows [1] and Financing Activities [2]; FY2023 Form 10-K [3]; FY2022 Form 10-K [4]; FY2021 Form 10-K [5]. Adjusted FCF is derived: reported FCF less equity-based compensation less the trailing five-year average of acquisition spend.
Two mechanics in that table need stating before the number is used for anything.
The acquisition average. Cash acquisition spend over FY2021–FY2025 was the Global Atlantic majority purchase of $473.8 million in 2021 [6], KJRM at $1,690.7 million in 2022 [7], nil in 2023, the $2,622.2 million cash consideration for the remaining Global Atlantic equity in 2024 [8], and $146.3 million in 2025 [9]. That sums to $4,933.0 million, a five-year average of $986.6 million. The 2024 Global Atlantic buy-in sits in financing activities rather than investing, because it purchased a noncontrolling interest; excluding it on that technicality drops the average to $462.2 million and lifts every adjusted figure below by $524.4 million. The inclusive figure is used throughout because it is cash paid to acquire an asset.
Why the reported FCF line is not an economic measure. KKR's consolidated funds are treated as investment companies for accounting purposes, so their purchases and sales of investments run through operating activities [10]. FY2025 operating cash flow of $477.8 million is struck after $42.9 billion of investments purchased and $33.7 billion of proceeds in asset management and strategic holdings, and after $5.0 billion of interest credited to policyholder account balances at Global Atlantic [11]. Those flows belong to fund investors and policyholders. Of the $6,145.4 million of FY2025 consolidated net income, $3,774.9 million was attributable to noncontrolling interests [12].
Source: derived from the filed consolidated statements of cash flows, FY2021–FY2025 Forms 10-K [13].
The series swings from negative $7.9 billion to positive $4.8 billion and back to negative $1.4 billion in consecutive years without KKR's fee business changing direction once. A yield computed on it would be an artefact of how much capital the funds deployed that year. On the three years FY2023–FY2025 the average adjusted figure is $253.1 million, which on a market capitalisation of $92.5 billion is a yield of 0.3%. That number should not be used, and this tab does not use it.
fit_features.adjusted_fcf reports the same obstruction from a different direction: it returns not_computable — "missing SBC for FY 2016, 2017, 2018, 2019; no complete consecutive five-year acquisition window with SBC" — and with it adjusted_fcf_yield, yield_baseline, balance_sheet_class, fcf_stability, float_retirement_years and market_cap are all null. Everything below is derived from the filings and from the price feed, with the workings shown, and the gap is recorded.
The same three deductions, on a basis that measures KKR
KKR reports a segment measure, Adjusted Net Income, that strips consolidation and marks and states the earnings attributable to its own equity holders after interest, preferred dividends and taxes on adjusted earnings [14]. ANI excludes equity-based compensation by construction, so the framework's SBC deduction applies to it unchanged; the acquisition deduction is the same five-year average. Capital expenditure of $160.8 million in FY2025 is already close to the $67.9 million of depreciation and amortisation carried inside the segment expense base [15]; the $92.9 million gap is 10 basis points of market capitalisation and is left in.
Earnings in $ millions. Adjusted Net Income (After-tax Distributable Earnings before the FY2024 renaming) from FY2025 Form 10-K [16], FY2023 Form 10-K [17] and FY2022 Form 10-K [18]; equity-based compensation from the filed cash-flow statements [19]; adjusted share counts from FY2021 Form 10-K [20], FY2023 Form 10-K [21] and the Q4 2025 earnings release [22]; year-end closing prices as reported.
The share count is the flat part of this arithmetic. Adjusted shares outstanding went from 877.6 million at the end of 2020 to a weighted-average 899.5 million in FY2025 — 2.5% over five years, about half a point a year [23] [24]. The FY2025 equity-based compensation deduction of $722.1 million is therefore not paying for a rising count; it is paying for a roughly stable one.
The yield, three ways
Market capitalisation is 901,461,945 weighted-average adjusted shares at 1Q 2026 [25] times the 28 July 2026 close of $102.66, or $92.54 billion. GAAP common shares outstanding were 897,872,941 at 7 May 2026 [26], so the two counts are within 0.4% of each other. Not included: 21.0 million shares that vested after 31 March 2026 and 21.4 million from Series D conversion by March 2028 [27], which together would take the count to roughly 944 million and the capitalisation to $96.9 billion.
Adjusted Yield, FY2025
3-Year Average
Own 6-Year Baseline (median)
Reference Line
Derived: framework-basis adjusted earnings divided by market capitalisation of $92.54 billion; baseline is the median of the FY2020–FY2025 year-end yields in the table above.
Current. FY2025 framework-basis earnings of $2,668.8 million on $92.54 billion is 2.88%. On the twelve months to 31 March 2026 — ANI of $4,593.0 million, being FY2025's $4,377.5 million less the $1,034.0 million first quarter of 2025 plus the $1,249.5 million first quarter of 2026 [28], less trailing equity-based compensation of $710.6 million [29] [30] and the same $986.6 million acquisition average — the figure is $2,895.9 million, or 3.13%.
Three-year average. FY2023, FY2024 and FY2025 framework-basis earnings of $1,988.7 million, $2,498.5 million and $2,668.8 million average $2,385.3 million, which on today's capitalisation is 2.58%.
Own baseline, and the jump test. The six year-end yields — 4.06%, 5.01%, 5.68%, 2.70%, 1.89%, 2.33% — have a median of 3.38%. The current 3.13% sits at 0.93 times that median. The fortress signature the framework looks for is a stable low-single-digit yield that suddenly doubles; the threshold is two times a positive baseline. KKR does not show it. A 50% drawdown from the January 2025 peak of $167.07 to the March 2026 trough of $83.88 returned the yield to roughly where it stood in 2022, because the denominator had run ahead of a rising numerator through 2023 and 2024 rather than sitting still.
Source: derived from Adjusted Net Income and equity-based compensation per the filings cited above, divided by market capitalisation at each year-end close; "Now" uses trailing-twelve-month earnings to 31 March 2026 and the 28 July 2026 close.
The unadjusted comparison is worth putting on the page so the size of the adjustment is visible: before deducting anything, FY2025 ANI of $4,377.5 million is a 4.73% yield and the trailing-twelve-month figure is 4.96%. Fee Related Earnings alone, $3,714.3 million in FY2025 [31], are 4.01%. The two deductions cost 185 basis points of the headline; the headline itself was already less than half the reference line.
Which bar applies
The framework picks the reference line off the balance sheet, and fit_features.balance_sheet_class returns "unknown" — "debt or cash missing for FY 2025". The computation, from the filed debt note:
$ millions. Corporate notes of $9,235.1 million carrying value from FY2025 Form 10-K [32]; Global Atlantic notes of $3,971.1 million and other debt obligations of $40,612.7 million from the scheduled principal payment tables [33]; cash and short-term investments of $4,789.7 million from the segment balance-sheet reconciliation [34]; Adjusted EBITDA of $5,958.2 million from the FY2025 reconciliation [35].
The revolving credit facilities were undrawn at 31 December 2025, carrying $750.0 million of financing available inside one year and $3,491.6 million in one to five years [36]. Global Atlantic's debt is non-recourse to KKR beyond Global Atlantic's assets [37], and the $40.6 billion of other debt obligations is issued by consolidated collateralised financing entities and levered investment vehicles, supported solely by the assets held at those entities and non-recourse to KKR beyond the collateral and committed capital [38].
At 0.75 times on the recourse perimeter and 1.41 times including Global Atlantic, the classification is moderate — above the 0.5 times fortress threshold, well below the 3.0 times levered threshold — and the applicable reference line is 10%. Only the third perimeter, at 8.23 times, would select the 25% levered line, and that perimeter contains debt KKR does not owe.
The bar selection turns out not to be the binding question. At 2.88% on FY2025 the name sits 712 basis points below the 10% moderate line, 512 basis points below the 8% low edge of the fortress band, and 2,212 basis points below the 25% levered line. On the three-year average of 2.58% the shortfall against the 10% line is 742 basis points, and on the trailing twelve months at 3.13% it is 687. There is no classification under which the current figure reaches its bar.
Normalized mid-cycle yield
KKR is cyclical in one of its two earnings blocks and not in the other, so the normalization applies to a defined piece rather than to the whole.
Total Operating Earnings — Fee Related Earnings plus Insurance Operating Earnings plus Strategic Holdings Operating Earnings — was $4,985.8 million in FY2025, up from $4,358.6 million in FY2024, and ran at $1,325.0 million in the first quarter of 2026 against $1,112.9 million a year earlier [39] [40]. That block is at a record and growing near 20%; it is not depressed and needs no normalization.
Total Investing Earnings — net realized carried interest and net realized investment income — is the cyclical block, and it is running below its own history. The workings:
- Years used: FY2021 $2,273.7 million, FY2022 $1,818.5 million, FY2023 $986.1 million, FY2024 $1,151.0 million, FY2025 $904.5 million — realized performance income and realized investment income, each net of their compensation, per the filed segment tables [41] [42] [43]. Five-year average $1,426.8 million, against FY2025's $904.5 million — a shortfall of $522.3 million pre-tax.
- Tax assumption: income taxes on adjusted earnings of $1,108.1 million over Total Segment Earnings less interest of $5,485.5 million is a 20.2% rate [44] [45]. The after-tax uplift is $416.8 million.
- Mid-cycle result: ANI of $4,794.3 million; framework basis $3,085.6 million after the same two deductions; yield 3.33%.
The window matters and cuts against the uplift. In November 2023 KKR changed its compensation framework, lowering the targeted share of compensation from fee-related revenues and raising the share from realized carried interest [46]. Net realized performance income after FY2023 is therefore struck against a higher compensation charge than before it, so the FY2021–FY2023 figures in that average are not comparable and bias it upward. Recomputing on the post-change window only — FY2024 $1,151.0 million, FY2025 $904.5 million, trailing twelve months to March 2026 $932.1 million [47] — gives an average of $995.9 million, a shortfall of $91.4 million pre-tax and $72.9 million after tax, mid-cycle ANI of $4,450.4 million and a framework-basis yield of 2.96%.
The honest range is 2.96% to 3.33%, against the 10% line: 667 to 704 basis points short. To close it on mid-cycle earnings the price would have to be $34.23 on the wider window or $30.42 on the narrower one, against $102.66 today and $83.88 at the March 2026 trough.
The consensus check
fit_features.consensus_forward_yield carries a free-cash-flow consensus of $8,827.3 million for FY2026, $8,813.6 million for FY2027, $14,310.1 million for FY2028 and $2,792.6 million for FY2029, each with yield_on_current_mcap null because the feature file could not resolve a market capitalisation. Those figures cannot carry the check. The same vendor file gives FY2026 cash from operations of negative $2,585.8 million and capital expenditure of $141.0 million, which would imply free cash flow of negative $2,726.8 million rather than positive $8,827.3 million; the two series are drawn from different contributor sets, no contributor count is published for the free-cash-flow line, and the FY2029 figure collapses to a fifth of FY2028's. The inconsistency is the same one the filed statements produce — a consolidated cash-flow statement that is not a measure of KKR's own cash generation.
The usable proxy is normalized earnings per share, which for an alternative manager is Adjusted Net Income per adjusted share. The vendor's FY2025 actual of $4.87 matches KKR's reported ANI of $4,377.5 million over 899.5 million weighted-average adjusted shares to the cent, which confirms the mapping. Contributor counts are 22 for FY2026 and FY2027 and 10 for FY2028; the FY2028 estimate carries a $7.76 to $9.20 range.
Source: consensus normalized earnings per share of $6.12 (FY2026), $7.35 (FY2027) and $8.60 (FY2028) from the estimates feed, vintage 29 July 2026, divided by the 28 July 2026 close; framework basis deducts equity-based compensation of $0.80 per share and the five-year acquisition average of $1.10 per share, both per the FY2025 filings [48].
Consensus does not clear the bar, on either reading. On the headline it reaches 8.38% only in FY2028, and on the framework basis 6.53%. The setup is therefore not the one where the sell side already agrees and the buy side is merely frightened, so the mean-reversion path has to be written explicitly.
The path, and what it would take. Management entered 2026 guiding to $7-plus of ANI per share — about 45% growth — and told the first-quarter call that it is "more likely that we land below that level", attributing the shortfall to monetization timing rather than to lost value, with delayed exits expected to shift into 2027 and beyond [49]. Consensus at $6.12 already sits below that target. The mechanism running in KKR's favour is visible and quantified: management fees grew 30% year-over-year in the quarter [50], embedded gains stand at $18.3 billion [51], over 90% of capital is perpetual or committed for eight years or more against $125 billion of committed but uncalled capital [52], and the forward monetization figure of over $1.2 billion is the largest the firm has disclosed on a call [53].
That mechanism is real and it is not enough. Consensus already models cumulative normalized-EPS growth of 40% from FY2026 to FY2028, and the framework-basis yield still ends at 6.53%. Reaching 10% on FY2028 consensus requires a price of $67.00 — 34.7% below today and 20.1% below the March 2026 trough. Reaching it on FY2028 without the two deductions requires $86.00, which is 16% below today and just above the trough. Put probabilities on it at the current price: the chance that the framework-basis adjusted yield clears 10% within three years without a further large price decline is under 5%, because it would need FY2028 headline earnings of $12.17 per share — 41.5% above the $8.60 consensus mean and 32.2% above the $9.20 consensus high. Widening to the fortress 8–9% band does not change the answer at today's price; the FY2028 framework figure of 6.53% is 147 basis points below even the 8% edge.
The counter-fact, stated at full strength. At the March 2026 trough of $83.88, FY2028 consensus normalized EPS of $8.60 was a 10.25% yield — the bar, cleared, on the unadjusted headline. The whole distance between that and the framework's answer is the $1.90 per share of equity-based compensation and acquisition spend the framework deducts and the street's normalized measure does not, plus the 22% the stock has recovered since March. Anyone who treats KKR's equity compensation as a genuine non-cash item and its acquisitions as discretionary rather than recurring reaches a materially different conclusion, and the arithmetic above lets them recompute it.
Cash conversion
The conversion trend runs the right way. Fee Related Earnings margin — FRE over management fees plus transaction and monitoring fees plus fee-related performance revenues — moved from 60.6% in FY2020 to 69.1% in FY2025, and the recurring block's share of total segment earnings went from 54.7% to 84.6% over the same span.
Source: derived from Fee Related Earnings and fee-related revenues, FY2025 Form 10-K [54], FY2023 Form 10-K [55] and FY2022 Form 10-K [56]; recurring share is Total Operating Earnings over Total Segment Earnings per the same filings.
Part of the FY2024 step in FRE margin is the November 2023 compensation change moving cost from the fee line to the carry line rather than removing it [57]; the underlying improvement is smaller than the 850 basis points the chart shows. The recurring-share series is unaffected by that reclassification and moves 30 points over five years. Whatever else is true of this name, the deteriorating-conversion condition the framework watches for is not present.
Management's read on the same facts, from the first-quarter call: the firm repurchased or retired $317 million of stock through 1 May 2026 at an average price of approximately $91, the board authorised a further $500 million, and the co-CEOs and several directors bought stock personally [58]. The buyback record and the share-count trajectory are taken up in Self-Help; the drawdown itself in Dislocation.
Durability
KKR is 50 years old, manages $743.9 billion, and has 92% of that capital locked for eight years or longer [1][2][3]. Fee revenue has compounded 15.6% a year for a decade with no year down more than 2.8%. But the firm's own 10-K calls its industry "intensely competitive," the entry barrier that actually blocks a new entrant covers only the insurance fifth of earnings, and the framework's adjusted-FCF measure cannot be computed here at all.
Conviction Sources
The framework's year-10 gate draws conviction from five named sources. Each is graded below for KKR specifically, on the filed record — not on the firm's reputation.
Sources: FY2025 Form 10-K, Business Segments, Regulation, Competition and Human Capital [4][5][6]; peer 10-Ks for the AUM pool.
Market Structure
The Business tab describes what KKR does. What matters for year-10 conviction is whether the industry's shape protects the fee stream, and it does not do so the way a monopoly or duopoly would. At December 31, 2025 the six largest listed alternative managers held roughly $5.1 trillion between them: Blackstone about $1.3 trillion [7], Brookfield Asset Management over $1 trillion [8], Apollo $938.4 billion [9], KKR $743.9 billion [10], Ares $622.5 billion [11] and Carlyle $477 billion [12].
Sources: each firm's FY2025 and FY2024 Form 10-K, Item 1 Business — Blackstone [13][14], Apollo [15][16], KKR [17][18], Ares [19][20], Carlyle [21][22], Brookfield [23]. Blackstone and Brookfield state AUM to one decimal or as "over $1 trillion"; Brookfield's FY2024 10-K does not state a comparable figure in its business section, so it is excluded from the share arithmetic below.
KKR is 14.6% of that $5.1 trillion pool and the largest member, Blackstone, is 25.6%. Six firms of comparable order, none dominant, all competing for the same commitments — that is an oligopoly, not the monopoly or duopoly the framework treats as a source of year-10 conviction. And the pool itself is a slice of a market its own participants size in the tens of trillions.
Share is stable across the two year-ends for which all five comparable firms disclose a figure. KKR was 18.7% of the five-firm pool at end-2024 ($637.6B of $3,414.0B) and 18.2% at end-2025 ($743.9B of $4,081.8B) — a pool growing 19.6% while KKR grew 16.7%. Stability without gain. Two observations is a thin window, and it is the window the indexed peer filings support; the longer-run structural claim rests on KKR's own AUM series rather than on measured share.
The counter-evidence is the company's own language. KKR writes that its "asset management and capital markets businesses operate in an intensely competitive industry," and lists as competitors not only other alternative managers but traditional asset managers, investment banks, commercial finance companies, sovereign wealth funds and strategic corporate buyers [24]. The risk-factor version is blunter: "Some of our competitors may have greater financial, technical, marketing and other resources, and more personnel than us," and competition for fundraising turns on "investment performance… quality of services, pricing, fund terms including fees" [25]. Every one of those is an execution variable. Execution is not a moat under this framework, and the company describes its competitive position in almost entirely execution terms.
Regulatory Entry Barriers
Two regimes apply, and they do very different work.
The asset-management regime is the Investment Advisers Act of 1940. KKR's advisory subsidiaries are SEC-registered investment advisers subject to anti-fraud provisions, fiduciary duties, periodic examination, compliance-program, record-keeping and disclosure requirements [26]. KKR Capital Markets is a registered broker-dealer subject to the SEC's uniform net capital rule [27]. What that regime actually blocks is conduct, not entry: it imposes fiduciary obligations and compliance cost, and it does not stop a credible team from raising a fund. The regulator is not standing between a new entrant and KKR's fee pool the way a banking or insurance licence stands between a startup and a deposit base.
The insurance regime does block entry. Global Atlantic's four U.S. insurance subsidiaries are domiciled in Massachusetts, Iowa and Indiana and licensed in all 50 states, the District of Columbia, Puerto Rico and the U.S. Virgin Islands [28]. Every one is subject to minimum capital and surplus requirements, U.S. risk-based capital standards with regulatory action triggered at 200% RBC and below, and — for the Bermuda companies — a Bermuda Solvency Capital Requirement ratio the BMA expects to be held at 120% or better. Failure "will result in regulatory actions, including in certain circumstances regulatory takeover of the insurance company" [29].
That is a genuine barrier, and it covers Insurance segment operating earnings of $1,109.4 million against total operating earnings of $4,985.8 million — 22.2% of the recurring earnings base [30]. It also cuts the other way on cash: Commonwealth Annuity, the U.S. holding company's dividend conduit, "has negative unassigned surplus" and must obtain written Massachusetts approval before paying any dividend [31]. The same regulator that keeps entrants out also keeps cash in.
Capital Intensity
This conviction source does not apply to the business that produces KKR's recurring earnings. KKR employed 5,043 people firm-wide at year-end 2025 — 2,705 in Asset Management, of whom about 980 are investment, capital markets and Capstone professionals [32]. Purchases of fixed assets in FY2025 were $160.8 million and occupancy expense $135.9 million, against management fees of $4,100.8 million [33][34][35]. There is no replacement-cost wall here: the replacement cost of a fund franchise is a track record and a set of LP relationships.
Where capital intensity does appear is on the balance sheet — $410.1 billion of total assets [36], and roughly $30 billion of KKR and employee capital invested in or committed to its own funds and portfolio companies, of which about $15 billion is funded from the balance sheet and $10 billion committed [37]. That is real skin, and it is the mechanism by which Global Atlantic's regulatory capital becomes an entry barrier. It is not a moat around the fee stream.
Essentialness and Operating History
KKR is not essential in the way a pipeline or a water utility is essential: an LP that stops committing to KKR funds suffers no service interruption. What substitutes for essentialness here is contract. As of December 31, 2025, approximately 92% of AUM "consists of capital that has a duration of at least eight years at inception or longer, including what we refer to as perpetual capital" [38], and a further $118.4 billion of uncalled commitments sits ready to start paying fees [39]. That is the strongest year-10 fact in this tab: the fee base for much of the next decade is already contracted.
On operating history the source applies without qualification. KKR was founded in 1976, "pioneered the leveraged buyout strategy and has been a leader of the private equity industry for five decades" [40]; management marked the firm's 50th birthday on the Q1 2026 call and noted it has been public for about one third of that span [41]. The qualification is that the KKR of today is young: Global Atlantic was acquired in 2021 and fully bought in 2024 [42], and K-Series wealth AUM went from $8 billion in 2023 [43] to $34 billion in 2025 [44]. A 50-year history is evidence about a firm that has spent 46 of those years not being this firm.
The Contracted Fee Base
Fifteen years of AUM, as the company charts it: $62 billion at the end of 2010 to $743.9 billion at the end of 2025, an 18.0% compound rate with a single down year (2011, −3.2%).
Source: FY2025 Form 10-K, Business Segments — Asset Management [45]. The 2021-2025 chart values round the MD and A figures ($470.6B, $503.9B, $552.8B, $637.6B, $743.9B).
The recurring earnings that base produces have risen every year on record. Management fees went from $1,248.5 million in 2019 to $4,100.8 million in 2025; fee related earnings from $1,080.3 million to $3,714.3 million — a 22.9% compound rate through a period that included the 2022 drawdown in both equity and credit markets.
Sources: FY2025 Form 10-K, Analysis of Asset Management Segment Operating Results [46]; FY2023 [47], FY2022 [48], FY2021 [49] and FY2021 prior-year comparison [50] 10-Ks.
FRE margin on FY2025 asset-management fee revenues computes to 69.1%: management fees of $4,100.8M plus transaction and monitoring fees of $1,092.6M plus fee related performance revenues of $181.8M equals $5,375.2M, less fee related compensation of $940.7M and other operating expenses of $720.2M, gives $3,714.3M [51]. Management confirmed roughly the same margin in Q1 2026 [52]. A $3.7 billion earnings stream carrying a 69% margin is the size of prize that draws entrants, and the framework's test is whether anyone can take it.
Structural Threats
Private Credit and Direct Lending
This is the named, live threat, and it is the one the sector repriced on. Every peer's Q1 2026 call opens on it: Apollo's CEO calls the press "fixated on a $2 trillion slice of this market, which should properly be called levered lending" [53]; Brookfield's credit co-CEO argues for separating "the fundamentals of private credit" from "the excesses and select parts of direct lending" [54]; Ares notes the industry holds over $500 billion of undeployed credit capital, "larger than the size of the entire non-traded BDC industry" [55].
Sized against KKR, the exposure is bounded. Direct lending is $39 billion, 5% of AUM; the private BDC footprint is around $3 billion, 0.4% of AUM; the public BDC FSK is under 2% of AUM [56]. Applying KKR's firm-wide blended management-fee rate of 0.735% (FY2025 management fees over average FPAUM) to the entire $39 billion direct-lending book gives $286.6 million — 7.0% of FY2025 management fees and 7.7% of FRE. That is the upper bound if the whole business went to zero, which is not a scenario anyone in the corpus proposes. A plausible year-10 impairment — a credit cycle that halves the direct-lending fee base and slows growth in adjacent credit strategies — is in the low single digits of FRE.
The honest counter-fact on the other side: the threat is not confined to the $39 billion. Credit and Liquid Strategies is $322.0 billion of AUM, KKR's largest business line by AUM [57], and $43.8 billion of the firm's $94.6 billion of FY2025 capital invested went into it, driven by "a higher level of capital deployed across our private credit strategies, most notably direct lending" [58][59]. A credit cycle that damages the asset class's reputation reaches further than the direct-lending line item. Set against that, KKR raised $15 billion of credit capital in Q1 2026 — one of its larger credit quarters — with inflows more than doubling quarter over quarter, and reported wealth-channel redemptions of about $250 million against $4 billion of K-Series inflows [60].
Insurance Spread Compression
The second threat is quantified by management against itself. On the Q1 2026 call the CFO said competition on the annuity liability side "is very high," that on the asset side "spreads are as tight as they've been in a very long time," and that "the combination of those two things is putting some increased competitive pressure on ROEs" — which is why KKR pulled back on origination in the quarter [61]. Global Atlantic's individual retirement-product volumes had already fallen from $14,821 million in 2024 to $12,339 million in 2025, and institutional-channel volumes from $27,115 million to $20,953 million [62].
The exposed slice is Insurance segment operating earnings of $1,109.4 million, 22.2% of FY2025 total operating earnings [63]. A spread environment that permanently compressed Global Atlantic's ROE by a third would remove roughly $370 million, about 7.4% of operating earnings, before any offsetting growth in the in-force book. Management's own framing is that spread cycles mean-revert and that $6 billion of dry equity translating into "$60-plus billion of buying power" is positioned to buy the dislocation [64]. That is a cyclical read on a cyclical pressure, and it is the reading the record so far supports.
Fee-Rate Compression
The industry-wide fee-compression thesis is the one structural threat this tab searched for and did not find in KKR's numbers. Blended management fee rate on average fee-paying AUM:
Source: derived from reported financials — management fees divided by the average of opening and closing fee-paying AUM, FY2021-FY2025 10-Ks [65][66][67][68][69].
The 2022 step down (0.762% to 0.691%) is the Global Atlantic consolidation adding a large, low-fee-rate asset pool, not price concession. From 2022 to 2025 the blended rate rose 4.4 basis points while FPAUM grew from $411.9 billion to $604.1 billion. Peers describe the pressure in their risk factors — Ares writes that "institutional investors have continued increasing pressure to reduce management and investment fees charged by external managers" [70] — but on KKR's disclosed arithmetic, mix and repricing have more than absorbed it over four years. Four years is not ten, and the wealth channel KKR is scaling into carries different economics than the flagship funds; the rate is a series to watch, not a threat that has landed.
Technology and Regulatory Reversal
KKR's AI risk factor points at its portfolio, not at its fee stream: "artificial intelligence may materially disrupt the industries in which we invest, the businesses of our portfolio companies and the valuations of our investments" [71]. That is where the exposure sits. A capital allocator whose returns depend on holding companies for five to seven years across an industrial transition faces valuation risk in the portfolio, not disintermediation of the fee contract. The corpus contains no evidence that anyone is trying to make the fund-management function itself obsolete; the disintermediation vector that exists — LPs co-investing and investing directly to avoid fees — predates AI by two decades and has coexisted with the fee-rate series above.
On regulation, the recent movement has run in KKR's favor and could reverse. In June 2024 a Fifth Circuit panel "unanimously vacated the SEC's private fund adviser new rules and amendments to existing rules under the Investment Advisers Act of 1940" [72], and Brookfield's management points to a U.S. executive order laying groundwork for private-strategy access through workplace retirement plans as a source of "hundreds of billions to trillions of net new flows into alternatives over time" [73]. A benign regulatory posture toward retail and retirement access to private markets is embedded in every alternative manager's growth plan, KKR's included. A reversal — a DOL or SEC posture that restricts 401(k) or wealth-channel access — would remove the fastest-growing part of the fee base. K-Series AUM is $34 billion, 4.6% of total AUM today [74], so the direct year-10 exposure is small; the growth assumption built on it is not.
The 2008 Stress Test
The corpus contains one true stress test, and it is severe. KKR's 2010 registration statement records that fees were $235.2 million in 2008, "a decrease of $627.1 million, or 72.7%, from the year ended December 31, 2007," driven by a $641.8 million collapse in transaction fees [75]. Revenue fell by nearly three-quarters in one year.
The same page carries the offsetting fact. Fee-paying AUM was $43.4 billion at December 31, 2008 and $42.8 billion at December 31, 2009 — down 1.5% through the 2008-09 financial crisis [76]. The asset base held; the revenue mix broke. In 2007, transaction fees were at least 74% of total fees ($641.8M of $862.3M) [77]. In FY2025, management fees are 76.3% of asset-management fee revenues and transaction and monitoring fees 20.3% [78]. The mix that produced a 73% revenue collapse has been inverted. That inversion is the strongest single piece of evidence that the 2008 experience does not repeat in the same form — and it is an inference from mix, not from a second observed crisis.
Disqualifier Check
The framework's disqualifier is revenue declining high-single-digit for three consecutive fiscal years after a long existence. The deterministic feature file records revenue_trajectory.consecutive_decline_years = 0 and revenue_trajectory.three_year_hsd_decline = false.
Source: fit_features.revenue_trajectory, derived from the run's structured financial feed. The series carries no PDF page of its own; the underlying line agrees with the "Fees and Other" line of the consolidated statements of operations [79].
Two things about that series must be said plainly. It ends at FY2020 — five years before the current fiscal year — and it is not KKR's total revenue. FY2020's $2,006.8 million is the "Fees and Other" line; KKR's FY2020 GAAP total revenues were $4,230.9 million [80]. The extraction lost the tag after the Insurance segment was added in 2021. So the flag is correct on its own data but cannot, by itself, run the test the framework asks for. Extending the identical line item from the filings:
Sources: FY2025 [81], FY2024 [82], FY2023 [83], FY2022 [84] and FY2021 [85] 10-Ks. FY2016-FY2019 total revenues are not stated in the indexed filings.
On the extended fee line, ten fiscal years contain two down years — FY2019 at −2.8% and FY2022 at −1.0% — neither high-single-digit, and never two in a row. Compound growth is 15.6% a year. On GAAP total revenues, FY2025 fell 11.0% ($21,878.7M to $19,464.3M), an 11.0% fall that clears the framework's high-single-digit threshold; it is one year, not three, and its cause is disclosed: insurance net premiums fell from $7,898.8 million to $3,397.2 million [86], on fewer assumed reinsurance transactions carrying life-contingency or morbidity risk [87], while fee revenue rose. The GAAP line swings between $4.2 billion and $21.9 billion across six years because unrealised carried interest and insurance investment marks run through it; it is not a series from which trend can be read.
Structural decline: searched for and not found. On every series the corpus supports — AUM, fee-paying AUM, management fees, fee related earnings, the fee revenue line — the direction over ten years is up, and no decline streak reaches two years, let alone three.
FCF Consistency
The framework's P2 test is the rolling five-year average of adjusted FCF. It cannot be run here. fit_features.fcf_stability is empty, with the stated reason "fewer than five consecutive adjusted-FCF years," and fit_features.adjusted_fcf.latest_adjusted is null, with the reason "missing SBC for FY 2016, 2017, 2018, 2019; no complete consecutive five-year acquisition window with SBC."
The deeper problem is that the input would not mean anything if it were complete. KKR consolidates its funds and CLOs, and the purchases and sales of those funds' investments run through operating activities: FY2025 shows "Investments Purchased — Asset Management and Strategic Holdings" of $(42,904.1) million and proceeds of $33,698.2 million inside net cash from operations of $477.8 million [88]. Reported free cash flow on the feature file's definition (operating cash flow less capex) would be $477.8M − $160.8M = $317.0 million for a firm that earned $3,714.3 million of fee related earnings. The four years the feature file does carry — FY2016 to FY2019 — show FCF of −$1.50 billion, −$3.63 billion, −$7.71 billion and −$5.88 billion, which is fund deployment, not cash burn.
The nearest defensible substitute is the firm's own cash-earnings measure — after-tax distributable earnings, renamed Adjusted Net Income in the FY2024 filing on identical figures ($4,202.3M for 2024, $3,040.1M for 2023, $3,512.3M for 2022) [89][90]. It is not adjusted FCF: it is stated before the framework's SBC deduction (equity-based compensation was $722.1 million in FY2025 [91]) and before acquisition spend, and it is management-defined. Read with that caveat:
Source: derived from reported non-GAAP measures — after-tax distributable earnings, renamed Adjusted Net Income from FY2024, FY2021-FY2025 10-Ks [92][93][94][95][96]. This is not adjusted FCF; the framework's measure is not computable.
Three rolling five-year averages are available and they rise monotonically: $2,770.1 million (2019-2023), $3,287.9 million (2020-2024), $3,809.6 million (2021-2025). The year-to-year series is volatile in the way the framework tolerates — 2021's $3,916.1 million fell 22.4% to $3,040.1 million by 2023 [97] as carried-interest realizations dried up, then recovered past the old peak. There are no negative years in the window, so the insurance-and-banking cadence question (a negative episode every five to eight years, inherent to the model) does not arise on this measure. It would arise on a longer history that the corpus does not contain: an economic net loss of $1.2 billion in KKR's Private Markets segment in 2008 [98] is the one recorded episode, seventeen years back and under a different business mix.
What can be said: the recurring share of earnings has risen to the point where the cyclical part is a minority. Total operating earnings of $4,985.8 million were 84.6% of total segment earnings of $5,890.3 million in FY2025 [99]; management put the trailing-twelve-month figure at 85% on the Q1 2026 call [100]. What cannot be said is that the P2 test was run: it was not, because its input does not exist for this company.
The Year-10 Case
The case that year-10 revenue and adjusted FCF are higher. Ninety-two percent of $743.9 billion of AUM is contracted for eight years or more at inception or is perpetual, and $118.4 billion of uncalled commitments has not yet started paying fees [101][102]. Management fees and fee related earnings have risen in every one of the seven years on record, including 2022 [103][104]. The one prior crisis on record took fee-paying AUM down 1.5%, not 30% [105]. The blended fee rate has risen, not fallen, since 2022. The live threat — private credit — touches 5% of AUM directly and bounds at 7.7% of FRE. Fifty years of operating history sits behind the franchise [106]. On revenue, the case is strong.
The case for doubt. The framework's conviction sources mostly do not apply to this company: market structure is a six-firm oligopoly in which KKR holds 14.6% of AUM and management describes competition on performance, service, pricing and terms — execution variables, which carry no year-10 protection. Regulatory entry barriers gate the insurance fifth of operating earnings, not the fee engine. Capital intensity is absent from the business that generates the recurring earnings. The essentialness argument reduces to contract duration, and contracts expire: the eight-year lock is a floor under years one through eight, not under year ten. The 50-year history covers a firm that spent 46 of those years without an insurance balance sheet, a private-wealth channel or a $322 billion credit book. And the framework's adjusted-FCF measure — the thing the gate is half about — cannot be computed for KKR at all, because consolidated-fund deployment runs through operating cash flow. On the closest substitute, cash earnings fell 22.4% from 2021 to 2023 inside a five-year window.
The read. The gate is not met. Year-10 revenue being higher is a high-confidence call; year-10 adjusted FCF being higher, with the very high conviction this gate requires, is not — the measure is not computable, the earnings underneath it contain a carried-interest stream that has already fallen 22% inside five years and an insurance spread stream management itself describes as under ROE pressure, and the structural sources of conviction the framework relies on grade out as partial, absent or execution-based. The strongest evidence against this read is not small: 92% of a $744 billion asset base is contracted for eight years or longer, and every fee measure the company reports has risen every year for seven years. What would change the read is a longer adjusted-FCF record on a basis that strips consolidated-fund flows, four or more years of a stable-or-rising blended fee rate through a credit downturn, and evidence that the fee base regenerates rather than merely runs off — the 2027-2030 flagship re-up cycle is where that becomes observable.
Bottom Line
KKR can comfortably outlast the problem: no corporate debt matures inside twelve months, 78% of it falls due after 2030, and cash plus undrawn revolvers cover $9.0 billion [1]. What the balance sheet permits, capital allocation has not delivered. The share count has risen in every year of the record, and eight years of executed repurchases total $1.4 billion against a $91.5 billion market value. The 2026 buying is real but small; insider buying alongside it is the strongest self-help evidence on the page.
Debt and Maturities
The GAAP balance sheet shows $410.1 billion of assets [2], but most of that belongs to fund investors and policyholders. The debt that binds KKR itself is $13.1 billion of principal: $9.37 billion at Asset Management and $3.77 billion at the insurance business [3]. A further $40.1 billion of consolidated fund and CLO borrowings [4] sits on the same balance sheet and is explicitly non-recourse to KKR beyond the collateral and committed capital of each vehicle [5].
Note 16 schedules corporate principal year by year only as far as 2030, with everything beyond that in a single "Thereafter" line of $7,012.6 million at Asset Management and $3,273.7 million at Insurance [6]. The four-bucket contractual-obligations table below covers the same principal on the bands KKR uses in its own liquidity discussion, and reconciles exactly to the footnote — the $7,012.6 million Asset Management figure in the after-five-years bucket is the sum of the senior, subordinated and KFN notes shown in the "After 5 Years" rows of Note 16 [7].
Source: FY2025 Annual Report (Form 10-K), Contractual Obligations, Commitments and Contingencies, as of December 31, 2025 [8]; principal amounts tie to Note 16 Debt Obligations [9].
Nothing is due inside twelve months. Only $517.5 million falls due within three years — 3.9% of corporate debt. Of the total, $10,286.6 million, or 78.3%, matures after 2030.
Cash + Short-Term Inv ($M)
Undrawn Revolvers ($M)
Net Debt / Adj. EBITDA (x)
Year-1 Interest Covered by FRE (x)
Sources: segment cash and short-term investments of $4,789,653 thousand at December 31, 2025 [10]; revolver financing available of $750.0 million under one year plus $3,491.6 million at one to five years, with no principal drawn [11]; ratios derived from those figures against Adjusted EBITDA of $5,958,190 thousand [12] and Fee Related Earnings of $3,714,313 thousand [13].
The arithmetic behind the ratios: net debt of $13,145.0 million less $4,789.7 million of cash and short-term investments is $8,355.3 million, or 1.40 times FY2025 Adjusted EBITDA of $5,958.2 million — inside the framework's "moderate" band and nowhere near the 3.0 times that would make it levered. Year-one interest of $673.6 million is covered 5.5 times by fee-related earnings alone, the most recurring line in the business. fit_features.balance_sheet_class returns unknown because the deterministic feed lacks a FY2025 debt or cash field; the figures above are computed from the filed pages cited and are recorded as a feature gap rather than a substitution.
Refinancing risk is small and quantifiable. The legacy USD senior notes carry a 4.37% weighted-average coupon [14]. What KKR pays at the margin today is visible in its own 2025 issuance: $900 million of ten-year senior notes at 5.100% in August 2025 [15] and $590 million of forty-year subordinated notes at 6.875% in May 2025 [16]. The gap between the book rate and the marginal rate is 70 to 250 basis points, and with zero principal due inside a year, almost none of the book reprices before 2029.
Covenants do not bind capital allocation. The senior and subordinated indentures carry incurrence-style limitations on secured indebtedness and mergers, not maintenance leverage tests [17] [18]. The capital markets revolver's maximum debt-to-equity test applies only to the capital markets borrowers and is non-recourse to the rest of KKR [19]. The insurance operating credit agreement carries a debt-to-total-capitalization ratio and a net-worth threshold at that subsidiary [20]. KKR states it was in compliance with all debt covenants in all material respects at December 31, 2025 and that in management's opinion they do not materially restrict its operating business or investment strategies [21].
The counterweight is what competes with repurchases on the cash side rather than what forces debt paydown: $10.5 billion of unfunded commitments to KKR's own funds and $1.0 billion of underwriting and lending commitments in the capital markets business [22], and — during the drawdown year — capital raising rather than capital return, with $2.54 billion of Series D mandatory convertible preferred issued in March 2025 [23]. That preferred converts into 20.8 million additional common shares by March 2028 on the December 2025 reference [24].
The Repurchase Record
The framework's test is cash actually spent, not dollars authorized. The cash-flow statement gives it directly.
Sources: FY2018–FY2022 from fit_features.share_count_trend.buyback_cash_per_year, derived from the consolidated statements of cash flows; FY2023–FY2025 from the FY2025 Form 10-K financing activities [25]; the 2026 bar is the first quarter only, $191,244 thousand [26].
Eight completed years, 2018 through 2025, total $1,401 million of cash spent on repurchases. Against today's market value of roughly $91.5 billion that is 1.5% of the company retired over eight years, or about 0.19% a year. Two of those years — 2024 and 2025 — are effectively blank: nil in 2024 and $3.4 million in 2025 [27]. The share-count table in the equity note makes the composition plain: in 2024 KKR repurchased no shares at all and retired 1,170,857 equity awards; in 2025 it repurchased 36,411 shares and retired 1,071,587 equity awards [28]. For two years the program was a tax-withholding mechanism for vesting equity, not a repurchase engine.
Across the full life of the program, KKR has repurchased or retired 94.2 million shares for $2.8 billion since 2015, an average price of $29.36 [29]. That average was paid when the stock traded near a third of today's price, so the prices paid were good; the volume was not.
The share count is the framework's binding condition here, and it moves the wrong way.
Sources: consolidated statements of operations, FY2021 Form 10-K for 2019–2021 [30], FY2024 Form 10-K for 2022 [31], FY2025 Form 10-K for 2023–2025 [32].
Basic weighted-average shares rose from 545.1 million in 2019 to 890.3 million in 2025 — 63.3% more shares, a compound rate of 8.5% a year. On a diluted basis the rise is 557.7 million to 955.8 million, 9.4% a year. Ruchir's framework treats a persistently rising share count as disqualifying on its own — the reason Accenture drops out of his screen once adjusted — and KKR's count rises on every measure and in every year of the record.
The fair counter-fact is that the largest single step, 2021 to 2022, is not economic dilution. It is the KKR Holdings reorganization converting exchangeable partnership interests into common stock, which moved ownership from noncontrolling interests onto the common line rather than creating it. Excluding that step does not reverse the direction: from 2023 to 2025, after the reorganization was complete, basic shares still rose 2.6% and diluted shares 4.8%, and the Series D preferred adds a further 20.8 million shares by March 2028 [33]. The drivers are the two the framework names: equity compensation of $722.1 million charged in FY2025 [34], and acquisitions, of which the $2,622.2 million cash purchase [35] of the remaining Global Atlantic interest in January 2024 [36] and the Arctos closing in May 2026 are the two most recent.
fit_features.share_count_trend returns an empty per_year array and null CAGRs, with the stated reason that fewer than two annual share-count observations were available to the deterministic feed. The counts above are read directly from the audited statements of operations and the discrepancy is recorded as a feature gap.
The 2026 quarter is a genuine change of direction. KKR repurchased 2,173,970 shares in the first quarter of 2026 against 578 equity awards retired — the first quarter in the record where open-market buying dominates award retirement — and spent $191.2 million of cash doing it [37] [38]. Two officers received restricted holdings unit grants of 650,000 and 300,000 units on 29 April 2026, so roughly 44% of the quarter's repurchase was matched by two grants in the following month [39].
Management on Buybacks
The buyback question was answered in prepared remarks on the most recent call rather than extracted in Q and A. Robert Lewin, chief financial officer, set out the allocation framework first:
we have focused on four key tools available to us to allocate our cash flow … Importantly, we do not have a framework that assigns a specific amount of capital spend into any one of these areas. [40]
The four tools he named are strategic acquisitions, insurance, share buybacks and strategic holdings. Repurchases are one of four claims on the marginal dollar, with no standing allocation. Within that framework, the price did move behavior:
an area where we leaned in this quarter was share repurchases where we saw attractive risk adjusted returns given the volatility across our sector. We repurchased or retired $317 million of stock this year through May 1 at an average price of approximately $91. And our Board recently authorized an increase to our share repurchase program by an additional $500 million. [41]
Three figures bound how much that commitment can compound. The $317 million bought through 1 May 2026 is 0.35% of the $91.5 billion market value. The authorization left at that date was $122 million, with an automatic $500 million top-up once the remaining amount falls to $50 million and any further increase requiring separate board approval [42]. A $500 million tranche is 0.55% of the market value. The program is structured to replenish in half-billion increments, which is a deliberate ceiling on pace rather than a capacity constraint — the balance sheet section above shows the money is there.
The average price paid, approximately $91, sits 11.4% below the 28 July 2026 close of $102.66 and 8.5% above the 12 March 2026 trough of $83.88 — management bought during the drawdown, not at its worst point and not only after the recovery.
Insider Buying
Alongside the corporate buying, five insiders bought stock personally between 9 February and 4 March 2026, including both co-chief executives.
Source: SEC EDGAR Form 4 open-market purchase filings, 9 February to 4 March 2026 [43].
The five bought 516,097 shares for $50.9 million at prices from $87.81 to $104.93. Set against the Form 4 record back to 2009, this is the largest cluster of insider buying in KKR's listed history by a wide margin: every prior open-market purchase by a named officer or director — Robert Scully in 2010, 2013, 2017, 2021 and 2025, John Hess in 2011, Thomas Schoewe in 2012, Robert Lewin in 2020 and Matthew Cohler in 2022 — fell between $0.1 million and $1.8 million, and the largest of them is 3.6% of what the five spent here. Insiders committed roughly 16 cents of personal money for every dollar the company spent on its own stock over the same year to date.
Source: prior-year comparison derived from the run's full SEC EDGAR Form 4 record, data/insider_transactions/index.json, covering 18 November 2009 to 6 May 2025; the corpus Insider Activity extract cited above covers 2026 filings only.
The Levered Exception
The framework's exception for levered balance sheets requires three legs together: an adjusted yield around 25% or higher, a demonstrated multi-year reduction in share count, and free cash flow over revenue that is not deteriorating. None of the first two holds here, so the exception does not arise.
fit_features.adjusted_fcf_yield is not_computable — the deterministic feed lacks a market-cap input and lacks SBC for the earliest years, so no adjusted-FCF series was produced. GAAP free cash flow would not answer the question in any case: KKR's operating cash flow is dominated by investment purchases inside consolidated funds, running from negative $7.2 billion in 2021 [44] to positive $0.5 billion in 2025 as reported in the consolidated statements of cash flows [45]. The nearest defensible substitute, computed from the filed segment figures, is FY2025 adjusted net income of $4,377.5 million less the $717.0 million of equity-based compensation that measure explicitly excludes, giving $3,660.5 million [46]. On a $91.5 billion market value that is a 4.0% yield, before any deduction for average acquisition spend. The full computation belongs to Yield; what matters here is that 4.0% is not within reach of the 25% the levered path requires, and the balance sheet is moderate at 1.40 times rather than levered in any event.
The Absurdity Check
fit_features.float_retirement_years is not_computable, for the same reasons: it needs a positive adjusted-FCF figure and a market cap in the same currency, and neither was derivable by the deterministic feed. The arithmetic below is computed from cited primary figures and is recorded as a feature gap.
Sources: market value of $91,527 million derived from 891,550,894 shares outstanding at 24 February 2026 [47] and the 28 July 2026 close of $102.66 (fit_features.capitulation_gauge.drawdown.current); earnings figures from the FY2025 segment reconciliation [48]; the repurchase pace annualises the $317 million bought through 1 May 2026 [49].
At the current price, retiring the whole share count takes 25.0 years of adjusted cash earnings — $91,527 million divided by $3,660.5 million. Ruchir's reference point for a price that cannot survive is roughly three years. At the actual pace of repurchase, annualising the fastest buying KKR has ever done, the figure is 96 years.
Dividend Cover
The dividend is not part of the return case. KKR's policy from the first quarter of 2026 is $0.78 a share annually, raised from $0.74 — the seventh consecutive annual increase since the C-corporation conversion [50] [51]. On the 28 July 2026 close that is a 0.76% yield. Cover is not in question: common dividends paid in FY2025 were $649.9 million [52], 17.8% of the $3,660.5 million adjusted figure above and 14.8% of reported adjusted net income.
Promise Versus Delivery
The sample below is the seven most material forward commitments in the transcript archive from two to four years back, checked against what the later calls reported.
Sources: Q2 2024 call, 31 July 2024, for the April 2024 Investor Day targets [53]; Q3 2025 call for the reaffirmation and the operating-earnings retirement [54] [55]; Q4 2025 call for fundraising progress [56]; Q1 2026 call for the ANI revision [57]; quarterly outcomes cross-checked against the run's Calls curation.
The quarter-ahead guidance record is clean: every one of the three near-term numeric commitments in the sample was met or beaten, and the Calls curation finds five such items marked kept across the last eight calls with none marked missed. The two soft spots are both multi-year per-share targets set at the April 2024 Investor Day. The total-operating-earnings target was retired in November 2025 on the grounds that KKR's own cash-accounting choice for Global Atlantic made the metric less comparable — "It's just not a metric as relevant for '26 guidance given this dynamic" [58]. The adjusted-net-income target was reaffirmed in the same month — "we feel confident that we can achieve the $7-plus per share" [59] — and then walked down six months later: "if you were handicapping our ability to reach $7 per share, we do think it is more likely that we land below that level" [60]. One target reframed and one guided below, twenty-one months after both were set.
Against that sits ownership. Directors and executive officers as a group hold 206,873,438 shares, 23.20% of the common stock — George Roberts 9.41%, Henry Kravis 9.11%, Scott Nuttall 2.38%, Joseph Bae 2.07% [61]. At the 28 July 2026 close that group stake is worth $21.2 billion. Management states employees own roughly 30% of the stock [62].
The promotional-CEO exclusion was checked against these instances and does not fit. Its signature is big claims, repeated misses and low ownership. KKR's near-term commitments are met, its long-dated targets have moved twice in one direction with the reasons disclosed, and its officers own a fifth of the company and bought more of it with personal cash during the drawdown. The pattern that would change that read is a second Investor Day target withdrawn or walked down without a new number replacing it, particularly the fee-related earnings target, which is the one management still says it expects to exceed [63].
What Is Missing
Web research for current corporate-bond and refinancing context was unavailable in this run; the marginal-cost figures above come from KKR's own 2025 issuance rather than an external rate source. KKR's corporate credit ratings are not stated in the corpus — the "A" financial-strength ratings from A.M. Best, Standard and Poor's and Fitch and "A2" from Moody's disclosed in the 10-K belong to the Global Atlantic life insurance subsidiaries, not to KKR's senior notes [64]. Five of the deterministic features this tab would normally lean on — adjusted FCF, adjusted-FCF yield, balance-sheet class, share-count trend and float-retirement years — return not_computable, and each substitute above is computed from the filed pages cited rather than from the feature file.
What this tab establishes
KKR's 49.8% drawdown is a multiple event, not an earnings event: trailing adjusted net income per share rose 2.3% between the January 2025 peak and the March 2026 trough while the multiple paid for it fell roughly half. The clock runs on monetization — converting a near-record $18.3 billion embedded-gain balance into printed carried interest. Five prior NYSE-era drawdowns of 34–58% round-tripped in a median 22.3 months.
The gap, in arithmetic
The starting point for any re-rating question is what actually moved. On 31 January 2025 the shares closed at $167.07; on 12 March 2026 they closed at $83.88, a fall of 49.8% [1]. Over that same span the trailing adjusted-net-income figure the market could see went up: FY2024 adjusted net income was $4.76 per share and FY2025 came in at $4.87 (the four reported quarters sum to $4.86), a gain of 2.3%.
That forces the decomposition. The trailing multiple went from 167.07 ÷ 4.76 = 35.1x at the peak to 83.88 ÷ 4.87 = 17.2x at the trough — a compression of 50.9%. Multiplying the two effects, 1.023 × 0.491 = 0.502, reproduces the 49.8% price fall almost exactly. Nothing in the drawdown is earnings damage. All of it is the price of a dollar of KKR's earnings.
This matters for the clock because the two cases have different repair mechanics. A cut-earnings dislocation re-rates when the earnings come back and the market can see them in a printed quarter. A multiple dislocation re-rates when the market changes what it will pay for a stream that never stopped growing — which no single dated event controls, but which several dated events can inform. The Damage Math tab carries the temporary-versus-permanent question itself; this tab takes the mechanism and the timing.
What has to close the gap
Four mechanisms are identifiable and at least partly evidenced. They are not equally strong, and one commonly cited mechanism — buyback shrinking the denominator — does not carry weight here at the scale involved.
1. Monetization converting embedded gains into printed carry. This is the load-bearing mechanism, and it is the one management itself has put on a quarterly reporting calendar. Total embedded gains — gross accrued carry plus balance-sheet gains — stood at $19 billion at 31 December 2025, described as a record, and at $18.3 billion at 31 March 2026, up 11% year-over-year even after realizations [2] [3]. The conversion is running: first-quarter 2026 realized carried interest was $720 million, up 120% year-on-year, inside roughly $880 million of total monetization revenue [4]. Forward visibility from exits since 31 March plus signed transactions was put at over $1.2 billion of gross monetization revenue — "the largest forward monetization figure we've discussed on a call in our history" [5]. The counter-fact sits in the same paragraph: management simultaneously said the environment four months into 2026 had been "a bit more challenging" than budgeted, and that on the $7-plus adjusted-net-income target "it is more likely that we land below that level," with delayed monetizations expected to shift to 2027 and beyond [6].
2. A one-off charge rolling off. Fourth-quarter 2025 adjusted net income was $1.12 per share; excluding a carried-interest repayment obligation it was $1.30 [7]. The charge reversed compensation paid on roughly $350 million of gross carry collected years earlier from the Asia II fund, cost about $0.18 of quarterly adjusted net income per share, and management stated it did not see any other material clawback risk across the portfolio [8]. This mechanism has already fired: the fourth quarter of 2025 was the only quarter in the last seven to miss consensus, and the following quarter printed $1.39 against a $1.26 estimate.
3. The fee base stepping up mechanically. Committed-but-uncalled capital stood at $125 billion at 31 March 2026, with over 90% of KKR's capital perpetual or committed for eight years or more [9]. Fee-related earnings per share of $1.13 in the first quarter of 2026 were up 23% year-over-year, and management fees up 30% [10]. This is the closest thing here to a contractual repricing calendar: capital already committed begins paying fees as it is called, without a new fundraising decision.
4. A feared event failing to happen. The specific fear priced through February 2026 was private-credit stress. KKR's disclosed exposure: direct lending is $39 billion, or 5% of assets under management; the private business-development-company footprint is around $3 billion, or 0.4%; the public BDC is under 2% [11]. Against $4 billion of K-Series wealth inflows in the quarter, redemptions were about $250 million [12]. A fear this narrowly scoped expires by not materialising, quarter after quarter, rather than by a single event. The counter-fact: management explicitly guided to a wealth-flow slowdown in the second quarter [13], so the second-quarter K-Series number is a genuine test rather than a formality.
The mechanism that does not carry weight here. Repurchases were $317 million through 1 May 2026 at an average of roughly $91, with an additional $500 million authorized [14]. Against roughly 891 million shares, $317 million at $91 retires about 3.5 million shares, or 0.39% of the count; the incremental authorization is a further 0.55% at the current price. Weighted-average basic shares were 891,145,378 in the first quarter of 2026 against 888,246,698 a year earlier — a count that rose, not fell [15]. On the framework's terms a rising share count is a fact against fit, and it is stated here plainly rather than left to the Self-Help tab: the denominator is not the mechanism at this scale.
The catalyst calendar
Sources: Q2 2026 reporting date from the 1 July 2026 scheduling release [16]; prior reporting dates from the run's earnings calendar; Investor Day target progress from the Q4 FY2025 call [17]; consensus figures from the run's estimates feed.
The nearest catalyst is dated and imminent: KKR reports second-quarter 2026 results before market open on 30 July 2026, with a 9:00 a.m. ET call [18]. Consensus is $1.427 of adjusted net income per share against $1.39 printed in the first quarter. Two figures in that release carry more information than the headline: realized carried interest against the $720 million first-quarter run-rate, and the updated forward monetization figure against the $1.2 billion-plus disclosed on 5 May.
The 2026 guidance framework itself expires with the year. The $4.50-plus fee-related-earnings and $7-to-$8 adjusted-net-income targets for 2026 were set in November 2023 and November 2021 respectively [19]; the $300 billion-plus fundraising target covers 2024 through 2026 and was over 80% complete at $240 billion as of February 2026 [20]. A successor medium-term framework has not been announced, so it is listed above as a window closing rather than as a scheduled event.
Base rates from KKR's own history
KKR's common stock has traded on the NYSE since 15 July 2010; the daily series in this run runs from 11 January 2007 to 28 July 2026 across 4,737 sessions [21], with the pre-July-2010 leg reflecting the predecessor Euronext-listed vehicle rather than the NYSE common. The base rates below are computed on the NYSE era, on closing prices, without dividend adjustment — KKR's annualized dividend of $0.78 is roughly 0.8% of the current price, so reinvestment shifts the recovery dates by weeks, not quarters [22].
An episode is defined as a peak-to-trough decline of 25% or more on closing prices, measured from a running maximum and closed when the price regains that maximum. Five such episodes completed between July 2010 and the current one.
Source: derived from the run's daily closing-price series, 15 July 2010 to 28 July 2026 [23]. Depth = 1 minus (trough close divided by peak close).
Source: derived from the run's daily closing-price series [24]. Months = calendar days divided by 30.44.
Source: derived from the run's daily closing-price series [25]. Peak and trough dates: 29 Apr 2011 to 3 Oct 2011, recovered 8 Mar 2013; 22 Jan 2014 to 11 Feb 2016, recovered 3 Jul 2018; 24 Sep 2018 to 24 Dec 2018, recovered 16 Sep 2019; 19 Feb 2020 to 23 Mar 2020, recovered 9 Jul 2020; 3 Nov 2021 to 30 Sep 2022, recovered 15 Dec 2023; 31 Jan 2025 to 12 Mar 2026, not recovered.
The arithmetic a skeptic can recompute: 1 − (9.92 ÷ 18.96) = 47.7%; 1 − (11.13 ÷ 26.30) = 57.7%; 1 − (18.68 ÷ 28.25) = 33.9%; 1 − (18.50 ÷ 33.93) = 45.5%; 1 − (43.00 ÷ 83.40) = 48.4%; 1 − (83.88 ÷ 167.07) = 49.8%. Median depth of the five completed episodes is 47.7%. Median time from trough back to the prior peak is 14.5 months; median round trip from peak to recovered peak is 22.3 months. The current episode is the second-deepest of the six and took 13.3 months to reach its low — longer than four of the five precedents.
The 2007–09 episode belongs in the record but not in the base rate. From $31.31 on 1 March 2007 the price fell 93.7% to $1.96 on 24 February 2009 and did not regain $31.31 until 22 January 2020 — 130.9 months past the trough. That series is the Euronext-listed predecessor vehicle before the NYSE listing, at a different scale, capital structure and business mix, and treating it as a precedent for the listed KKR common would overstate what this name's own history says.
As of the 28 July 2026 close of $102.66, the current episode sits 138 days — 4.5 months — past its trough, 22.4% above the low and 38.6% below the peak. Regaining $167.07 from here requires a further 62.7%.
The 18-month read
Re-recognition inside roughly 18 to 24 months is a reasonable expectation on this evidence, and the reason is that the path does not require cycle repair. The earnings never broke: fee-related earnings per share, total operating earnings and adjusted net income all grew about 20% year-over-year in the first quarter of 2026 [26], 2025 was a record fundraising year at $129 billion [27], and the gap the price has to close is the multiple. The base rates say this name has closed 34%-to-58% gaps four times out of five within 25.4 months of the peak. Measured from the 12 March 2026 trough, a window running 18 months from today reaches 22.6 months past the trough, which covers four of the five precedents; extending it to 24 months reaches 28.6 months past the trough, still one month short of the slowest case — the 2014–16 episode at 28.7 months.
The strongest fact against the read is that the mechanism has already slipped once. The $7-plus 2026 adjusted-net-income target was affirmed on 5 February 2026 [28] and walked back on 5 May 2026, three months later [29]. Monetization timing is the variable, and it is the variable management controls least. A second slip would push the printed inflection from 2027 into 2028 and put the recovery outside the window.
What would falsify the read, tied to the falsifier ledger: realized carried interest and the disclosed forward monetization figure both declining across the 30 July 2026, late-2026 and early-February 2027 prints, against the $720 million and $1.2 billion baselines set on 5 May 2026; or fee-related earnings per share growth dropping out of the high-teens range that has held for three years. Either would mean the mechanism is not firing, at which point the base rates cease to be the right reference and the 2014–16 case becomes the relevant precedent.
What consensus expects, and when
The sell side has not capitulated. The run's estimates summary carries 21 ratings — 6 strong buy, 12 buy, 3 hold, and none at sell or strong sell — with a mean price target of $123.48 [30]. The run's consensus feed shows the same picture on a broker-scale taxonomy: 12 buy, 7 outperform, 3 hold, none negative, for a consensus recommendation score of 1.59 where 1 is buy and 5 is sell, and a target distribution of $122 median, $147 high and $105 low across twenty published targets.
Close, 28 Jul 2026
Mean target
Lowest target
Sell or underperform ratings
Sources: close from the run's daily price series [31]; mean target and rating mix from the run's analyst estimates summary [32]; target dispersion from the run's consensus feed.
Two readings of that positioning both deserve stating. The lowest target on the street, $105, sits 2.3% above the last close — after a 49.8% decline, not one of twenty published targets implies downside. On the framework's fear gauge that is the opposite of capitulation, and it is a fact against the setup. On the framework's consensus rule it is the supportive configuration: the sell side still underwrites the earnings, and it is the buy side that has sold. The two readings cannot both be resolved here; the drawdown's ownership and volume evidence sits in Dislocation.
What the targets imply about multiple is more informative than the level. The mean target of $123.48 against FY2027 consensus adjusted earnings of $7.35 per share is 16.80x. The current price of $102.66 against FY2026 consensus of $6.12 is 16.78x. The street's twelve-month target is today's multiple rolled onto next year's earnings — it embeds no re-rating at all. The most bullish target on the tape, $147, is still 12% below the January 2025 peak.
Source: reported figures and consensus means from the run's estimates and earnings-calendar feeds; the 4Q25 reported figure of $1.12 includes the carried-interest repayment obligation and is $1.30 excluding it [33].
Consensus locates the recovery precisely. The annual path runs $4.87 actual for FY2025, $6.12 for FY2026 on 22 estimates, $7.35 for FY2027 on 22 estimates, and $8.60 for FY2028 on 10. Quarterly, the estimates step from $1.427 for the second quarter of 2026 to $1.589 for the third and $1.699 for the fourth. The candidate quarter is the fourth quarter of 2026, reported in early February 2027: it is the first quarter in which consensus has KKR printing an adjusted-net-income run-rate of roughly $6.80 annualized — the level the withdrawn $7-plus guidance implied, arriving four quarters late, and the first print at which the 2026 shortfall becomes a completed fact rather than an open question. The nearer prints on 30 July 2026 and in late 2026 are tests of whether that path is intact, not the re-rating event itself.
The gap between consensus and the March 2026 trough is worth one line of arithmetic. At the $83.88 low, the FY2027 consensus of $7.35 was being capitalized at 11.4x. At $102.66 it is 14.0x. Both sit well below the 35.1x trailing multiple carried at the January 2025 peak.
The instrument facts
These are facts about listed instruments, stated as facts. No structure, strike, expiry or sizing is suggested anywhere in this report.
Long-dated listed options exist on KKR. As of the 28 July 2026 close, the listed option chain extended to a 21 January 2028 expiration — 541 calendar days, or about 17.8 months, beyond that close — with a 17 December 2027 series also listed at 506 days, or about 16.6 months. Intermediate series were listed for 15 January 2027, 19 March 2027, 21 May 2027 and 17 June 2027 (Stock Options Channel and Public.com option chains, retrieved 29 July 2026, both showing the $102.66 reference price). Expiries beyond twelve months are therefore available; the longest listed expiry falls just under eighteen months.
Implied volatility. KKR's 30-day mean implied volatility was 41.5% as of 28 July 2026 — 40.4% on calls, 42.5% on puts — against 30-day close-to-close historical volatility of 32.5% (AlphaQuery KKR volatility statistics, data date 28 July 2026). Against the framework's reference lines, where up to roughly 50–55 is treated as acceptable and 60–70 as elevated, 41.5% sits inside the acceptable band. This is the 30-day measure; the implied volatility of the January 2028 series specifically was not verifiable from available sources.
Liquidity. KKR is an S&P 500 constituent with a multi-exchange listed option market. On the 28 July 2026 session, 6,668 call contracts and 1,805 put contracts traded against 3.40 million shares (Stock Options Channel, retrieved 29 July 2026). Open interest is concentrated in the near-dated series; a contract-level open-interest tally for the December 2027 and January 2028 expirations was not verifiable from available sources.
Because listed options with expiries beyond twelve months do exist here, the framework's watchlist-only consequence — the case where no qualifying long-dated instrument is available — does not apply to this name.